BrasilAgro - Companhia Brasileira de Propriedades Agrícolas
LND NYSE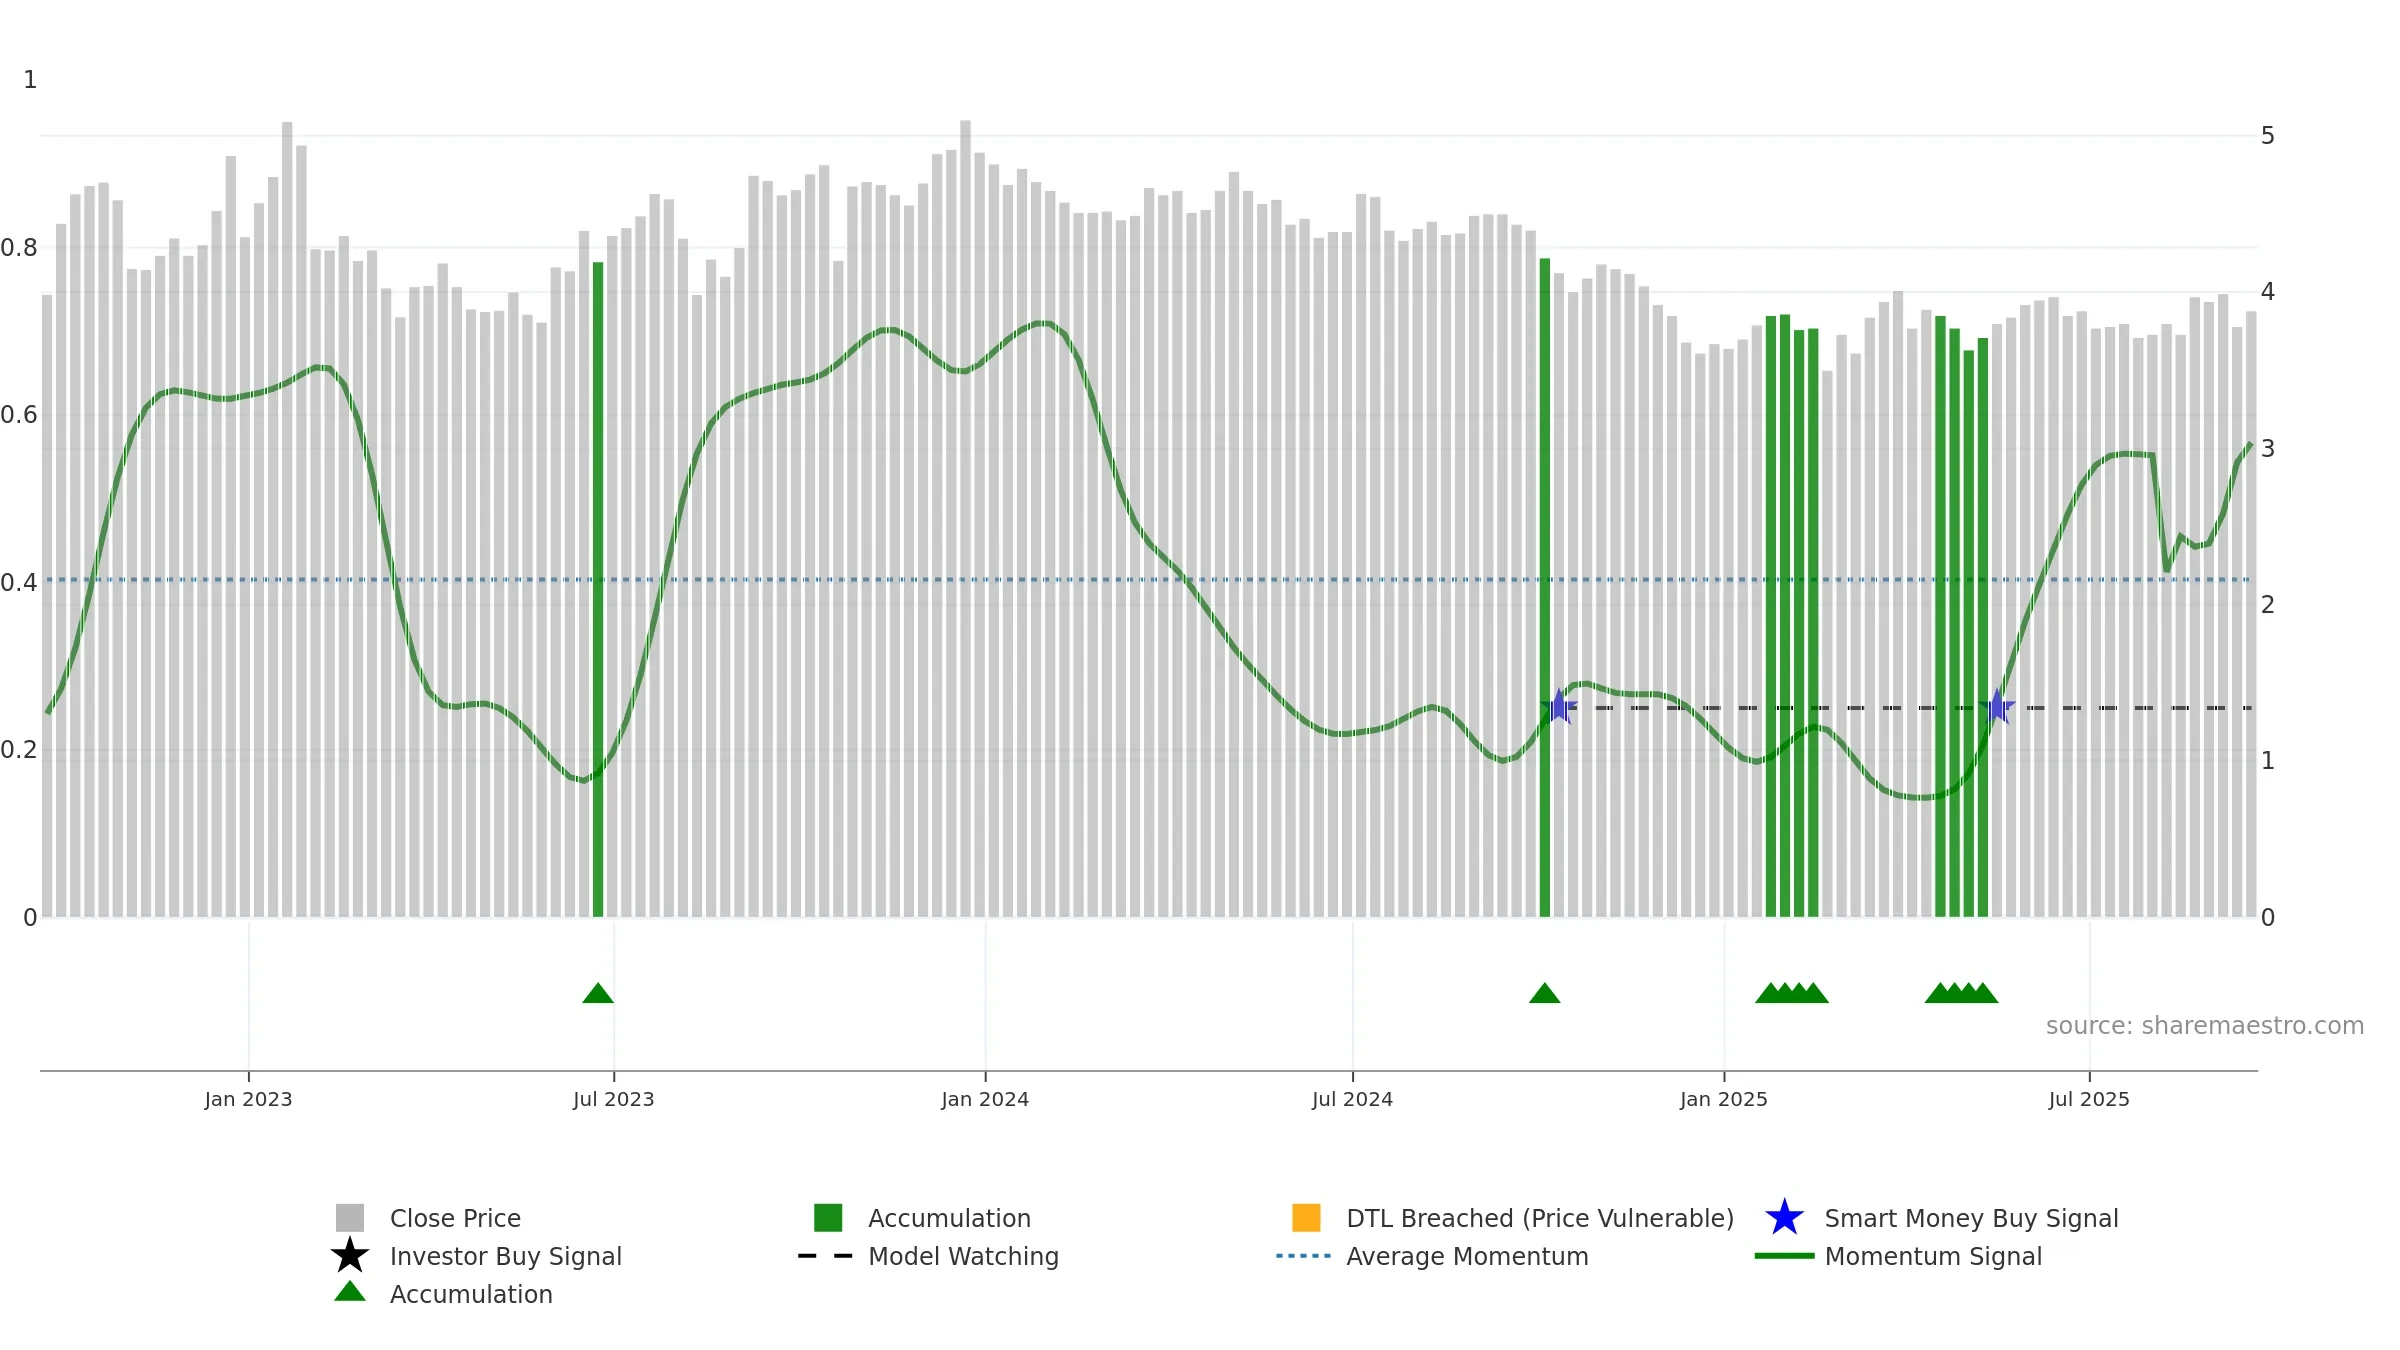
Weekly Report
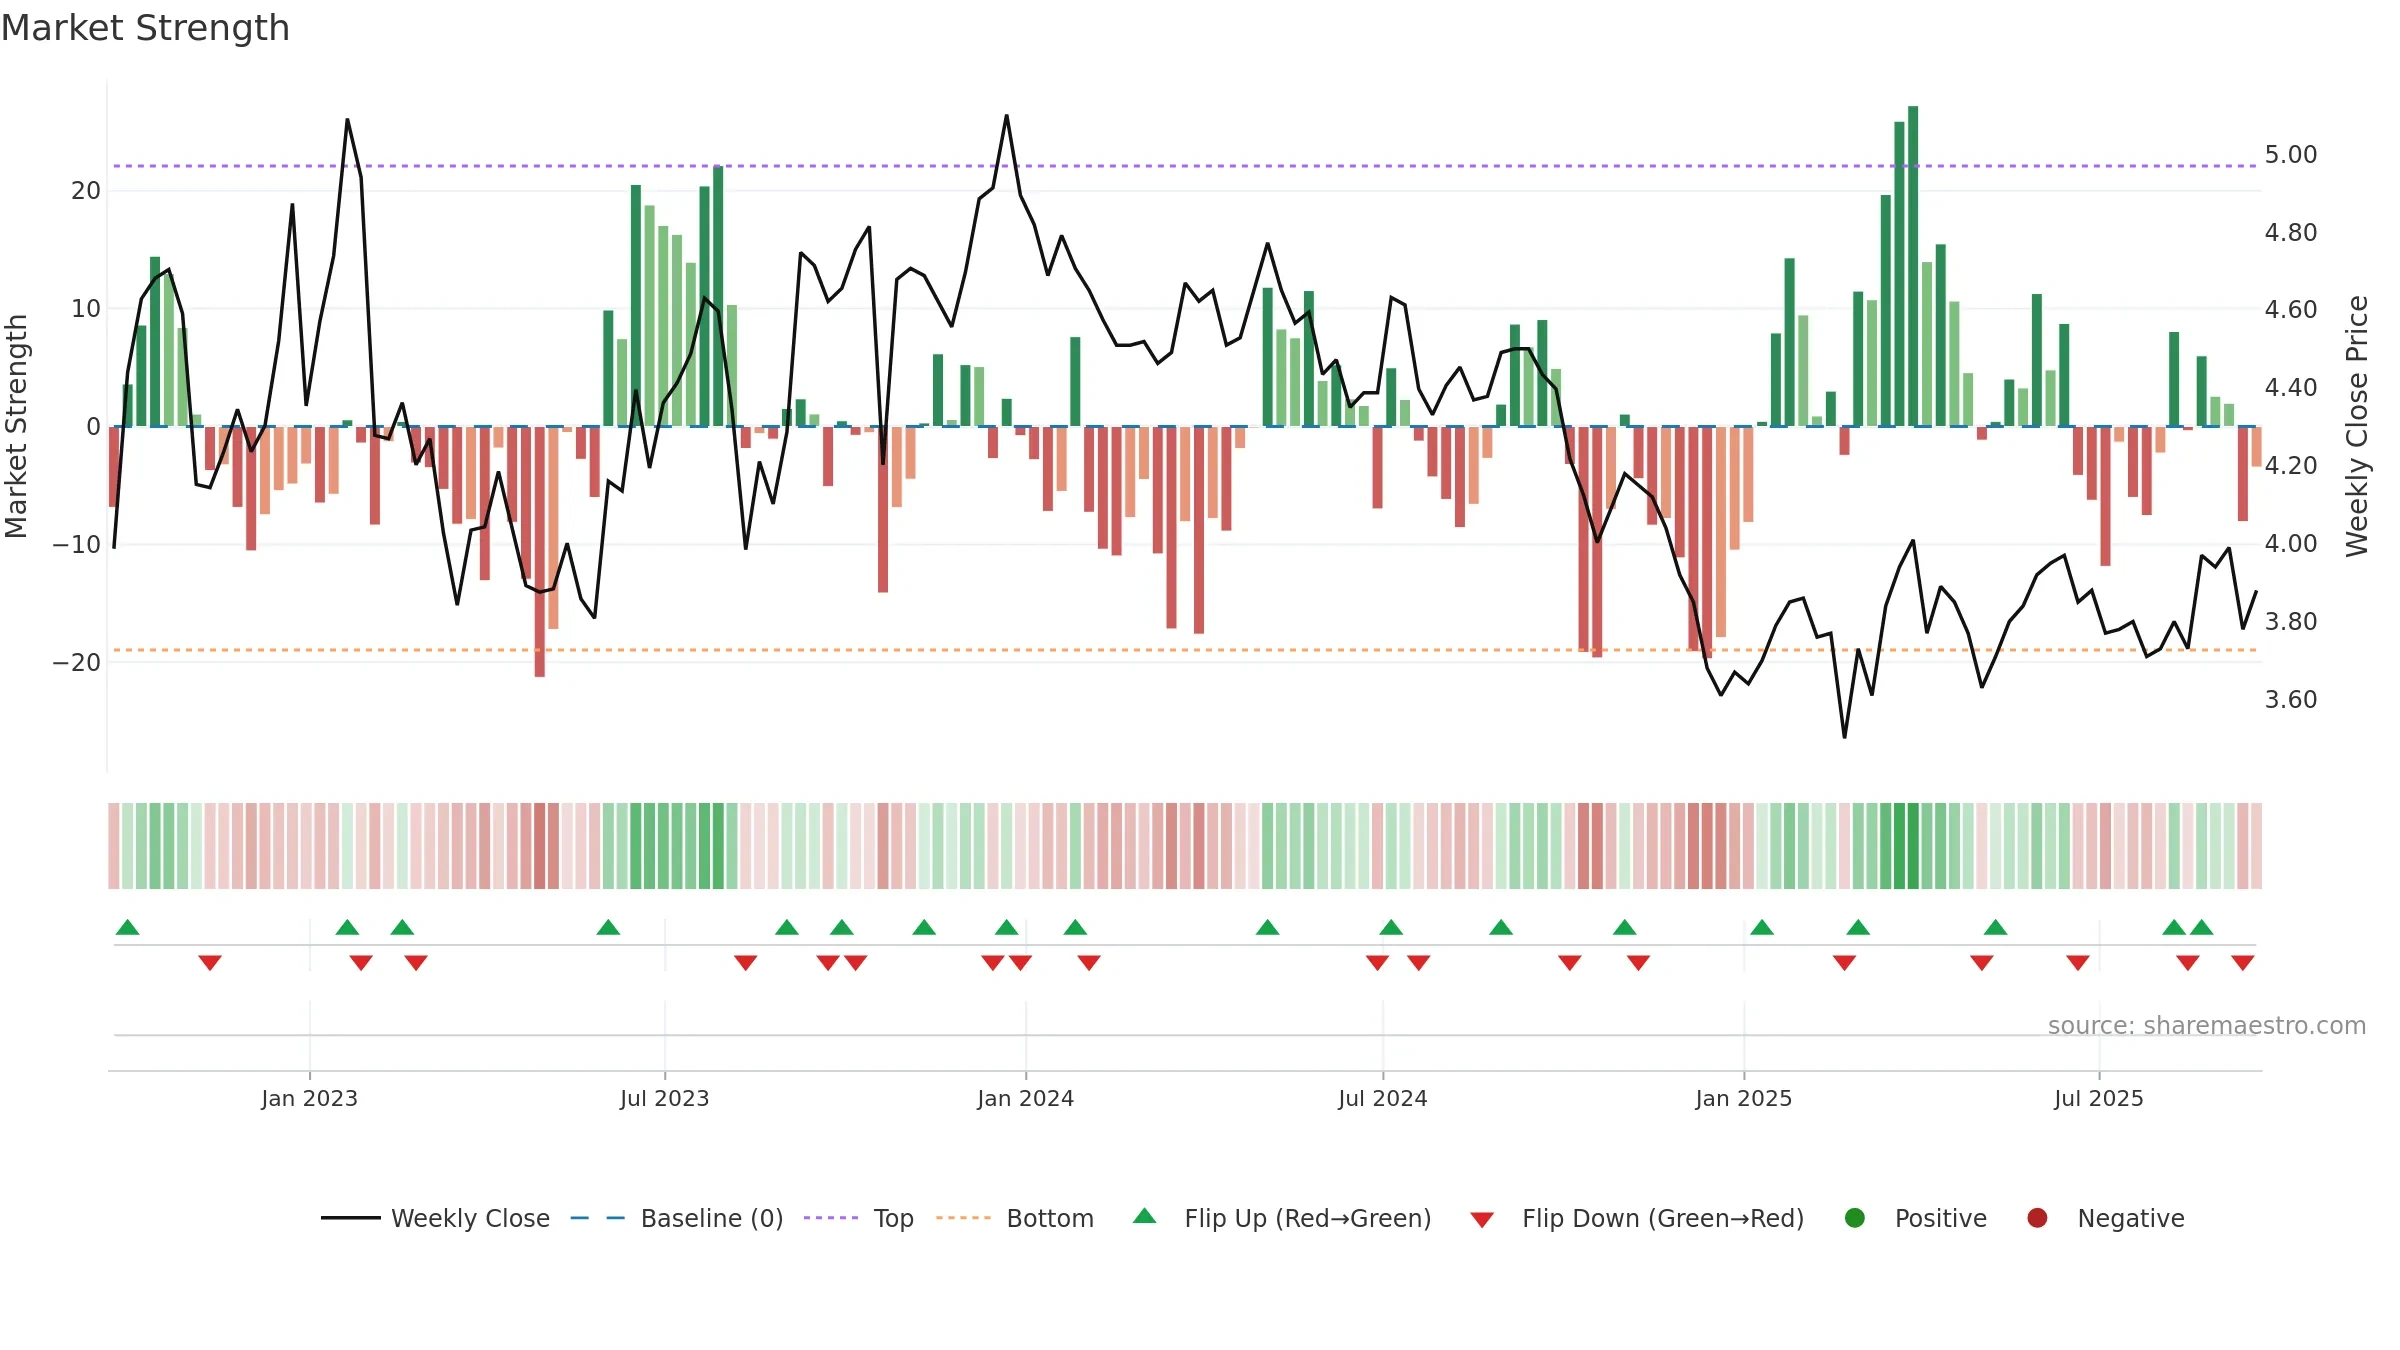
BrasilAgro - Companhia Brasileira de Propriedades Agrícolas closed at 3.8800 (-1.02% WoW) . Data window ends Fri, 19 Sep 2025.
How to read this — Price slope is upward, indicating persistent buying over the window. Low weekly volatility favours steadier follow-through. Volume trend diverges from price — watch for fatigue or rotation. Returns are positively correlated with volume — strength tends to arrive on higher activity. Distance to baseline is narrowing — reverting closer to its fair-value track. Price holds above key averages, indicating constructive participation.
Up-slope supports buying interest; pullbacks may be contained if activity stays firm. Because liquidity isn’t confirming, prefer evidence of fresh demand before chasing moves.
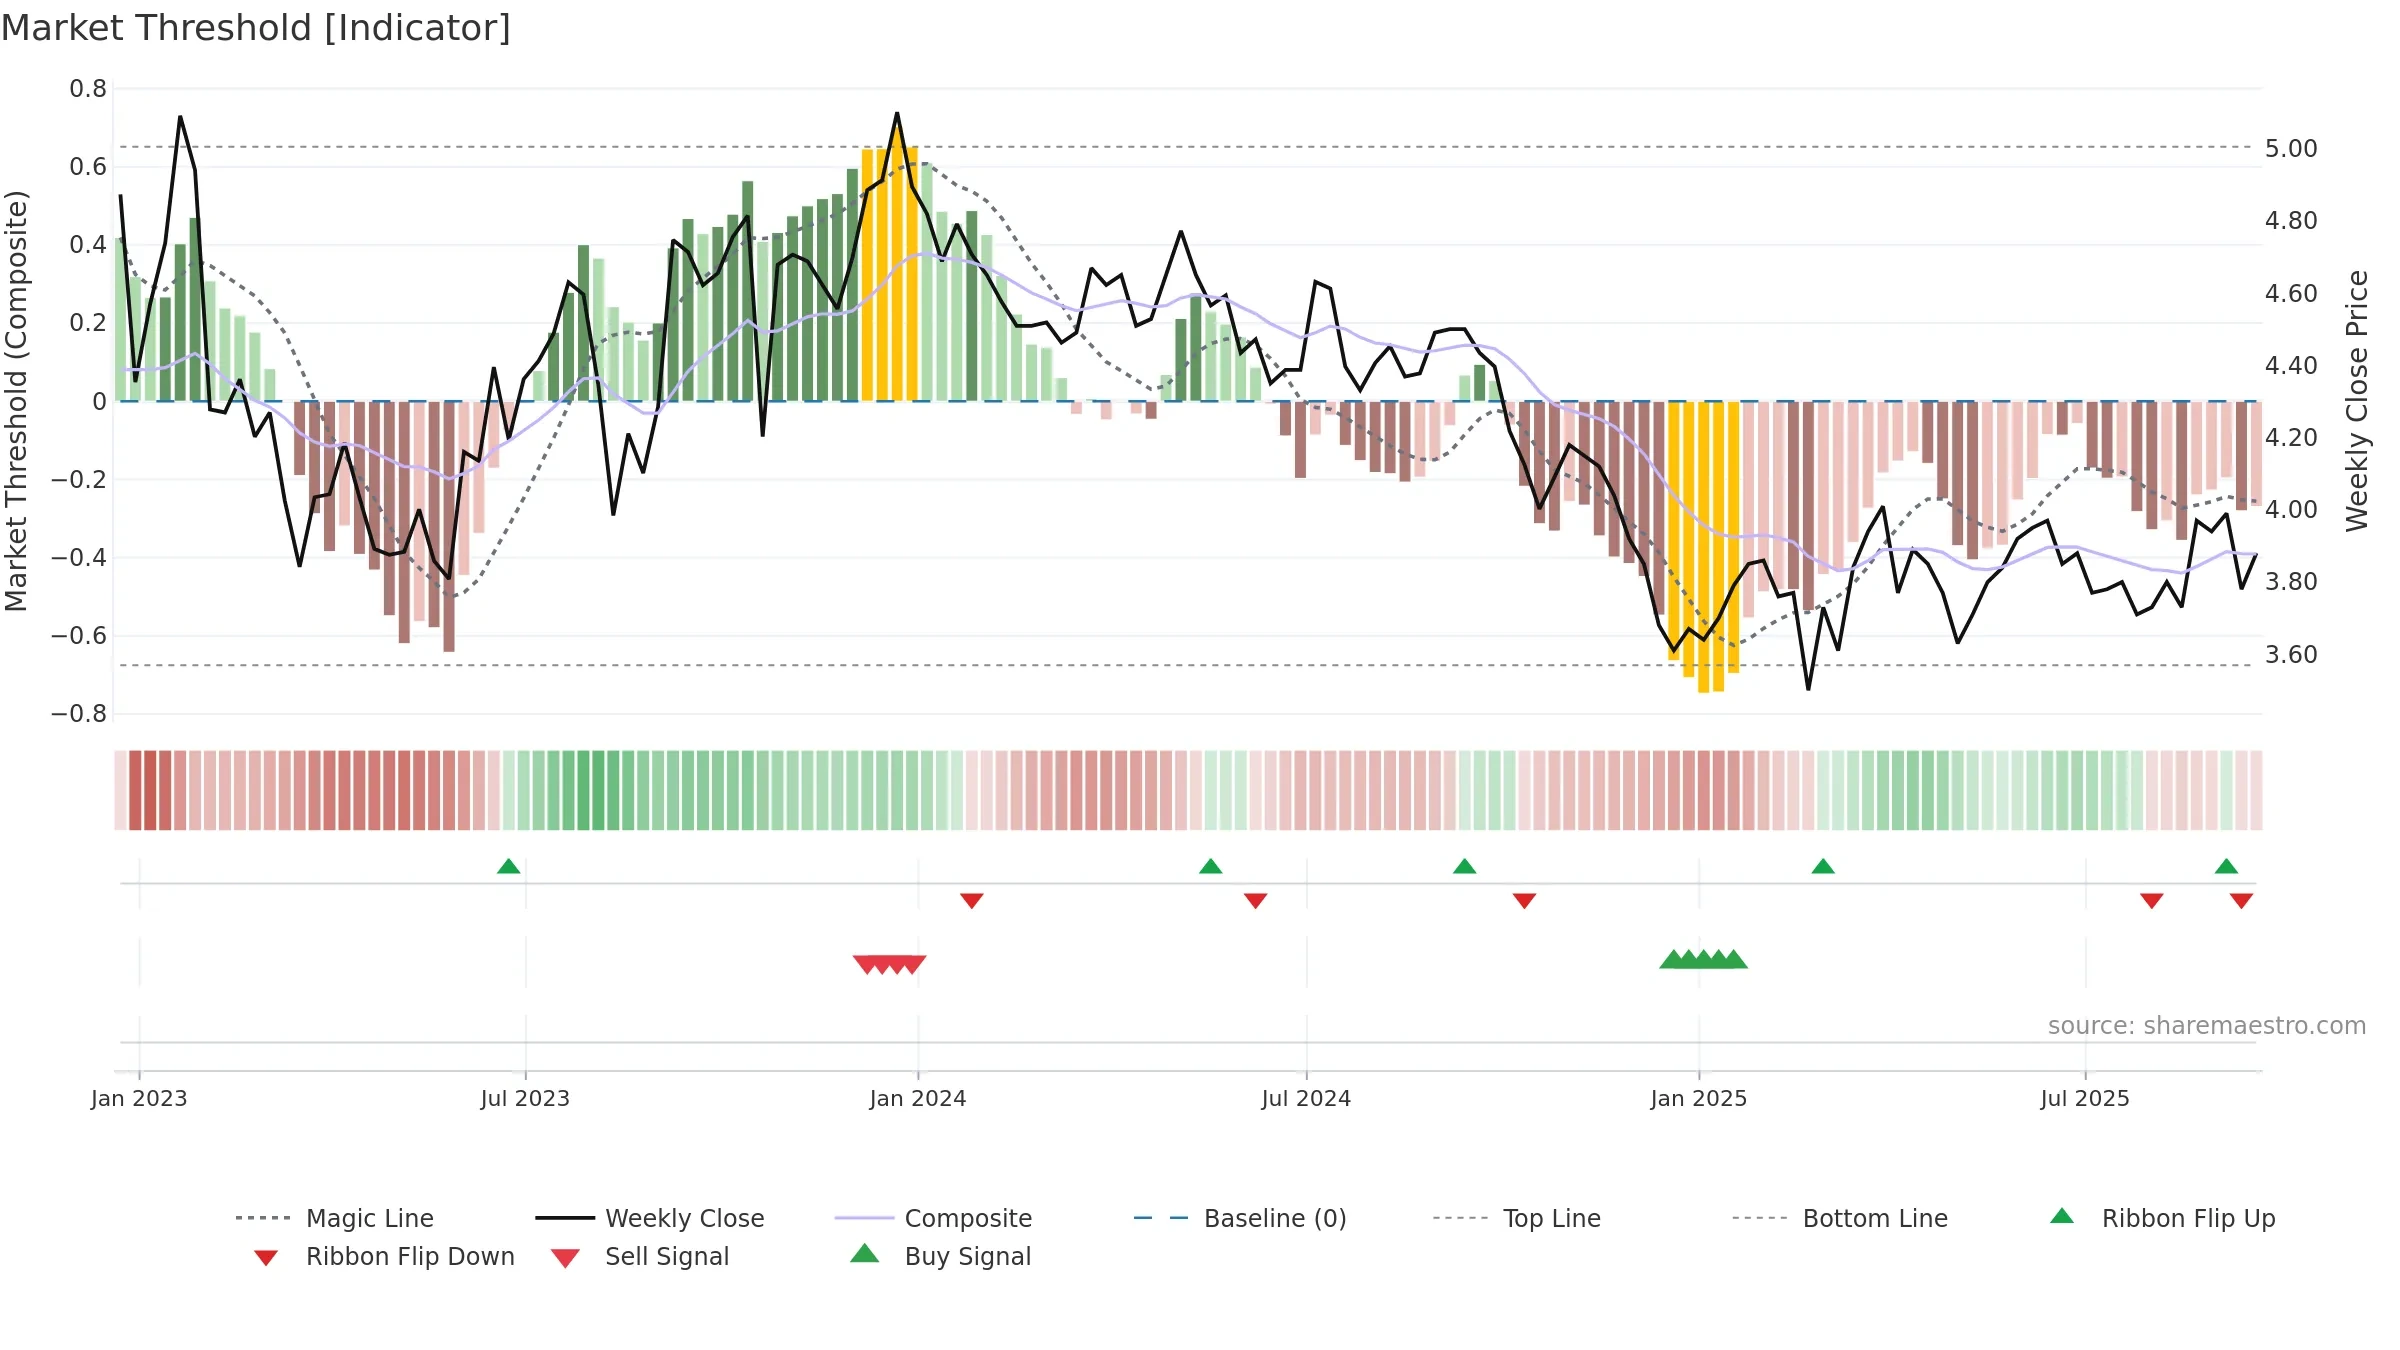
Gauge maps the trend signal to a 0–100 scale.
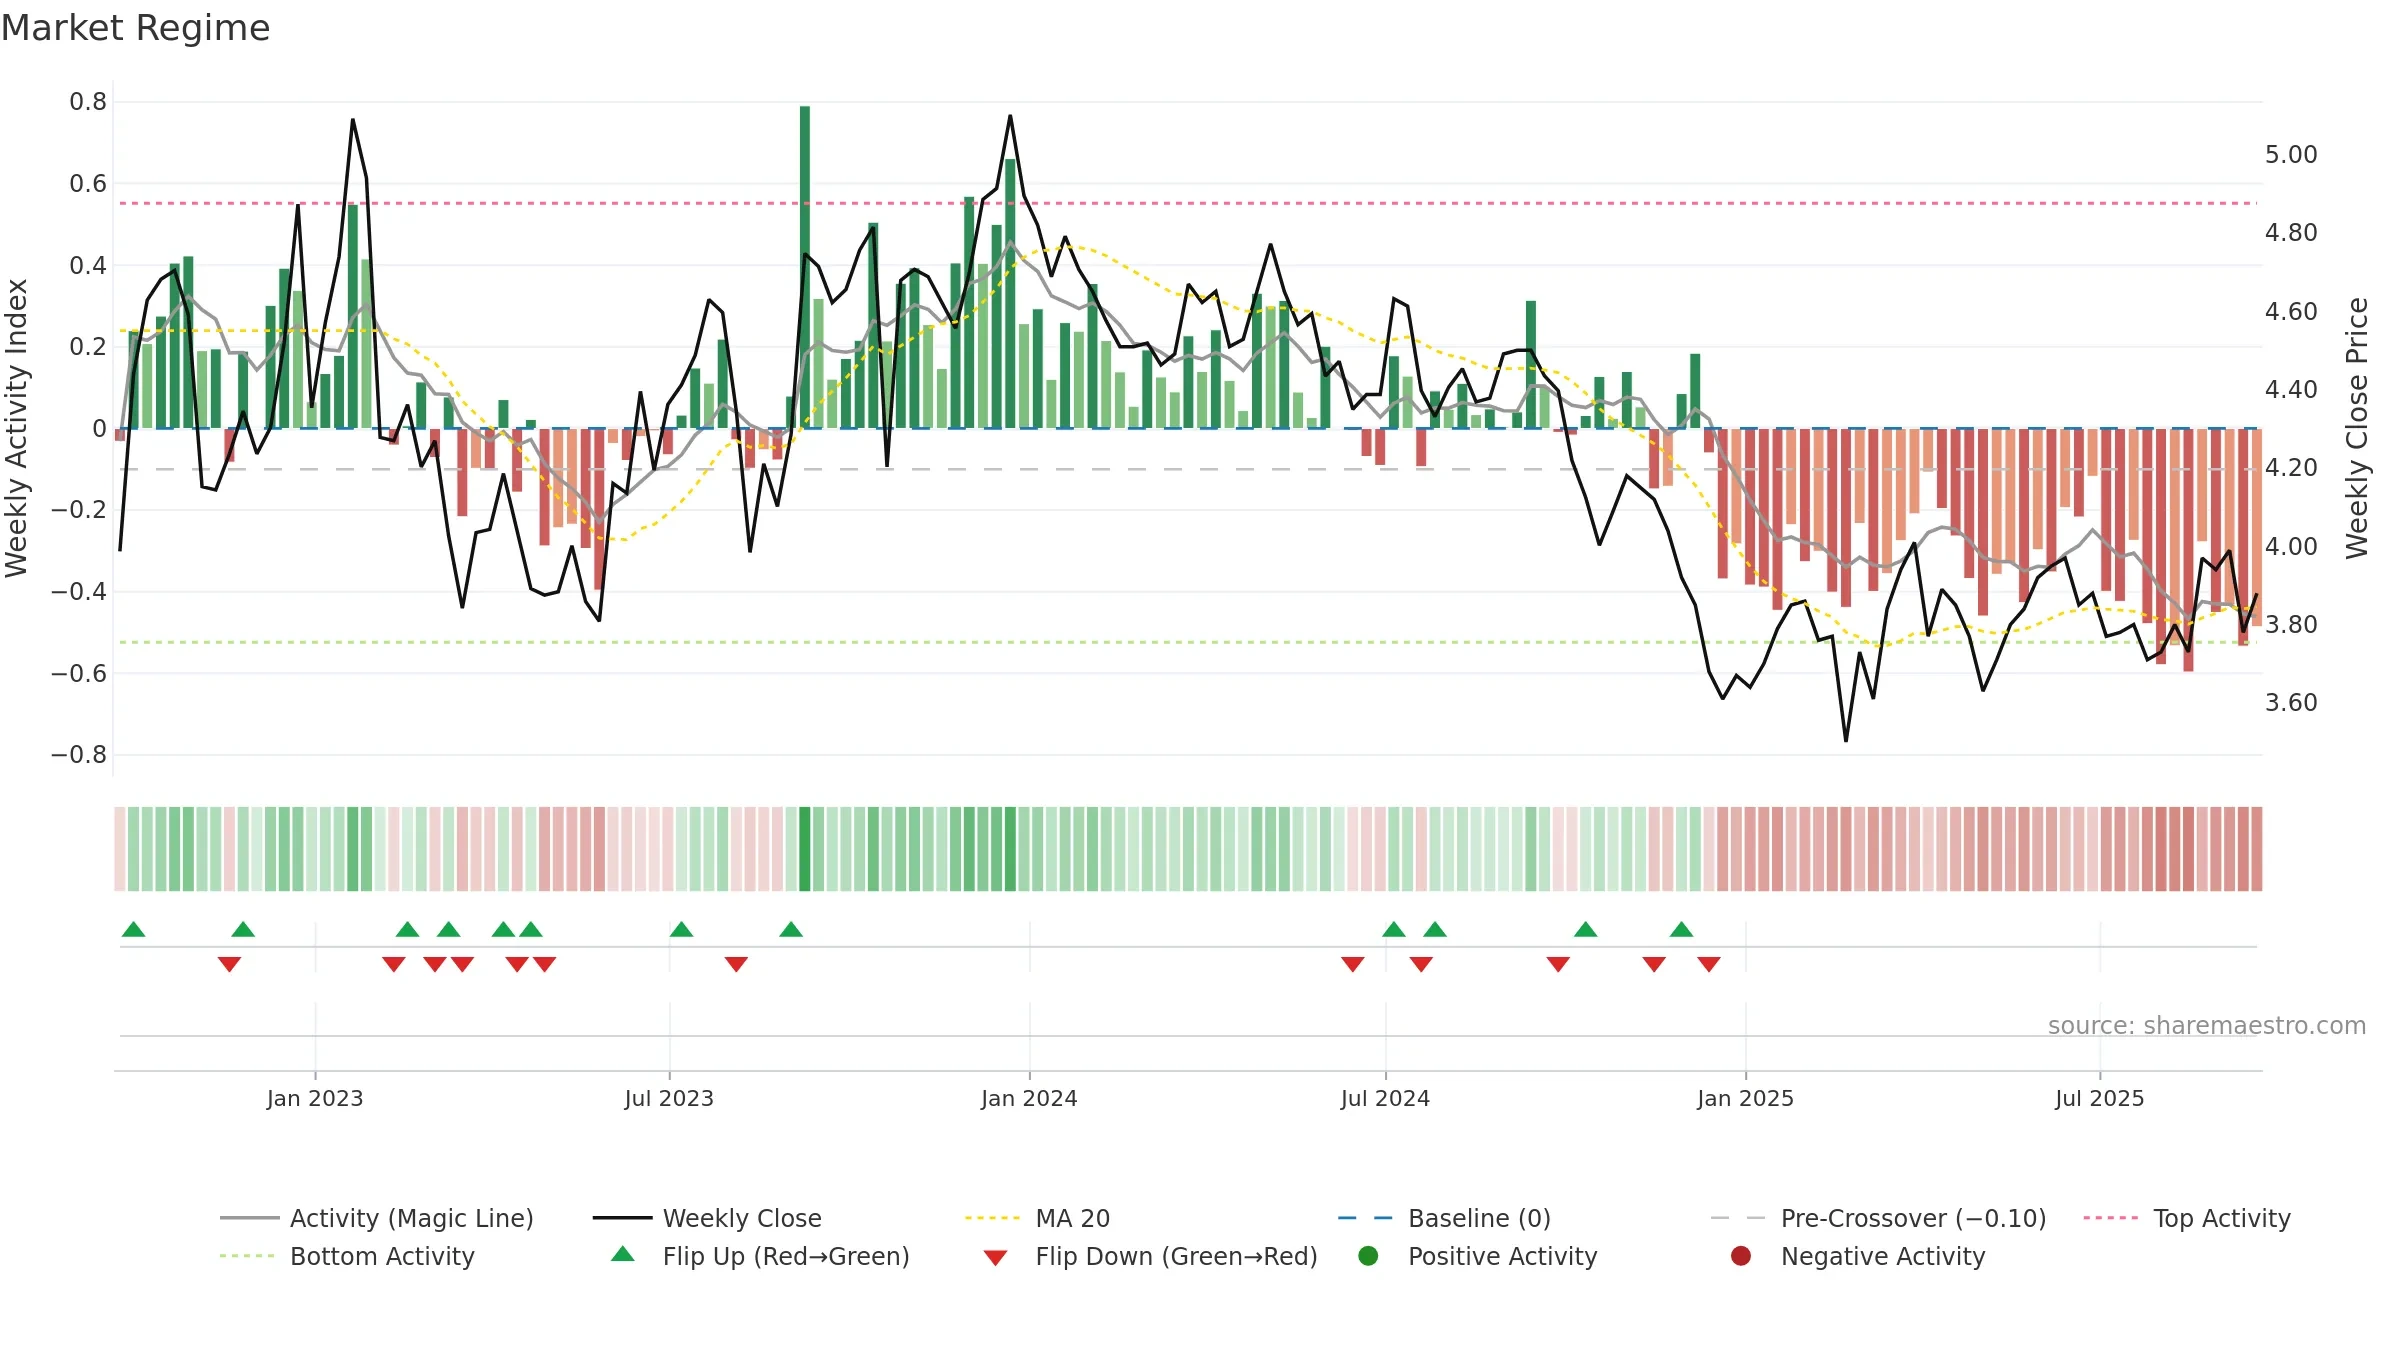
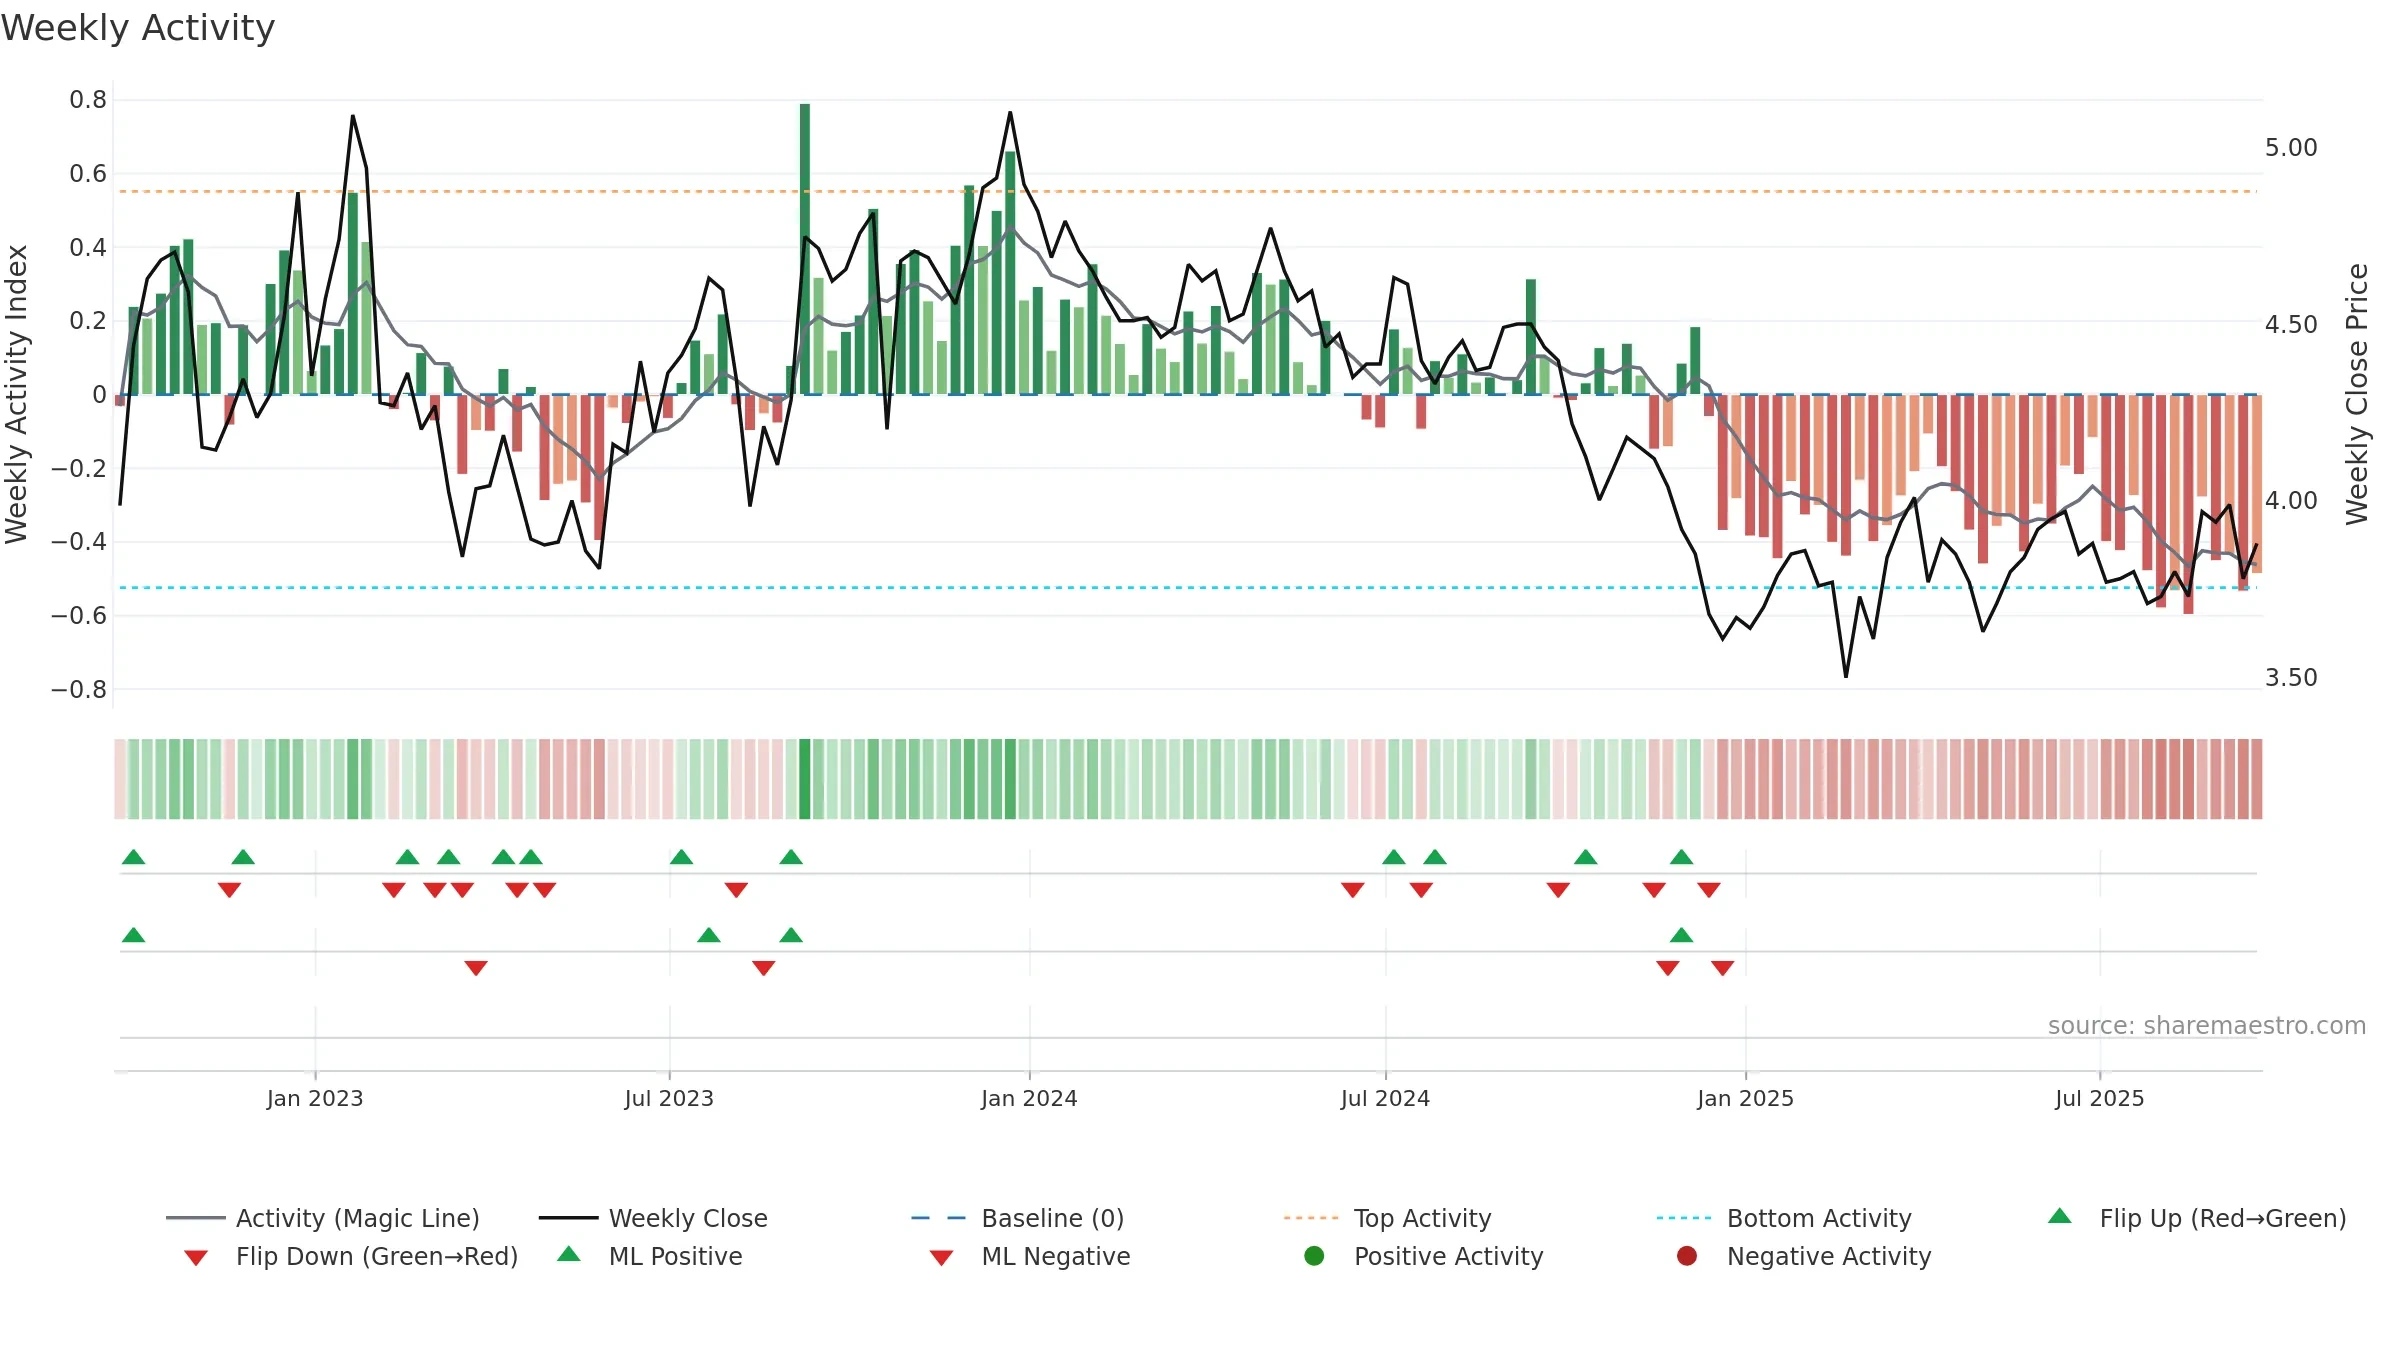
How to read this — Range-bound conditions; conviction is limited until a break or acceleration emerges.
Wait for a directional break or improving acceleration.
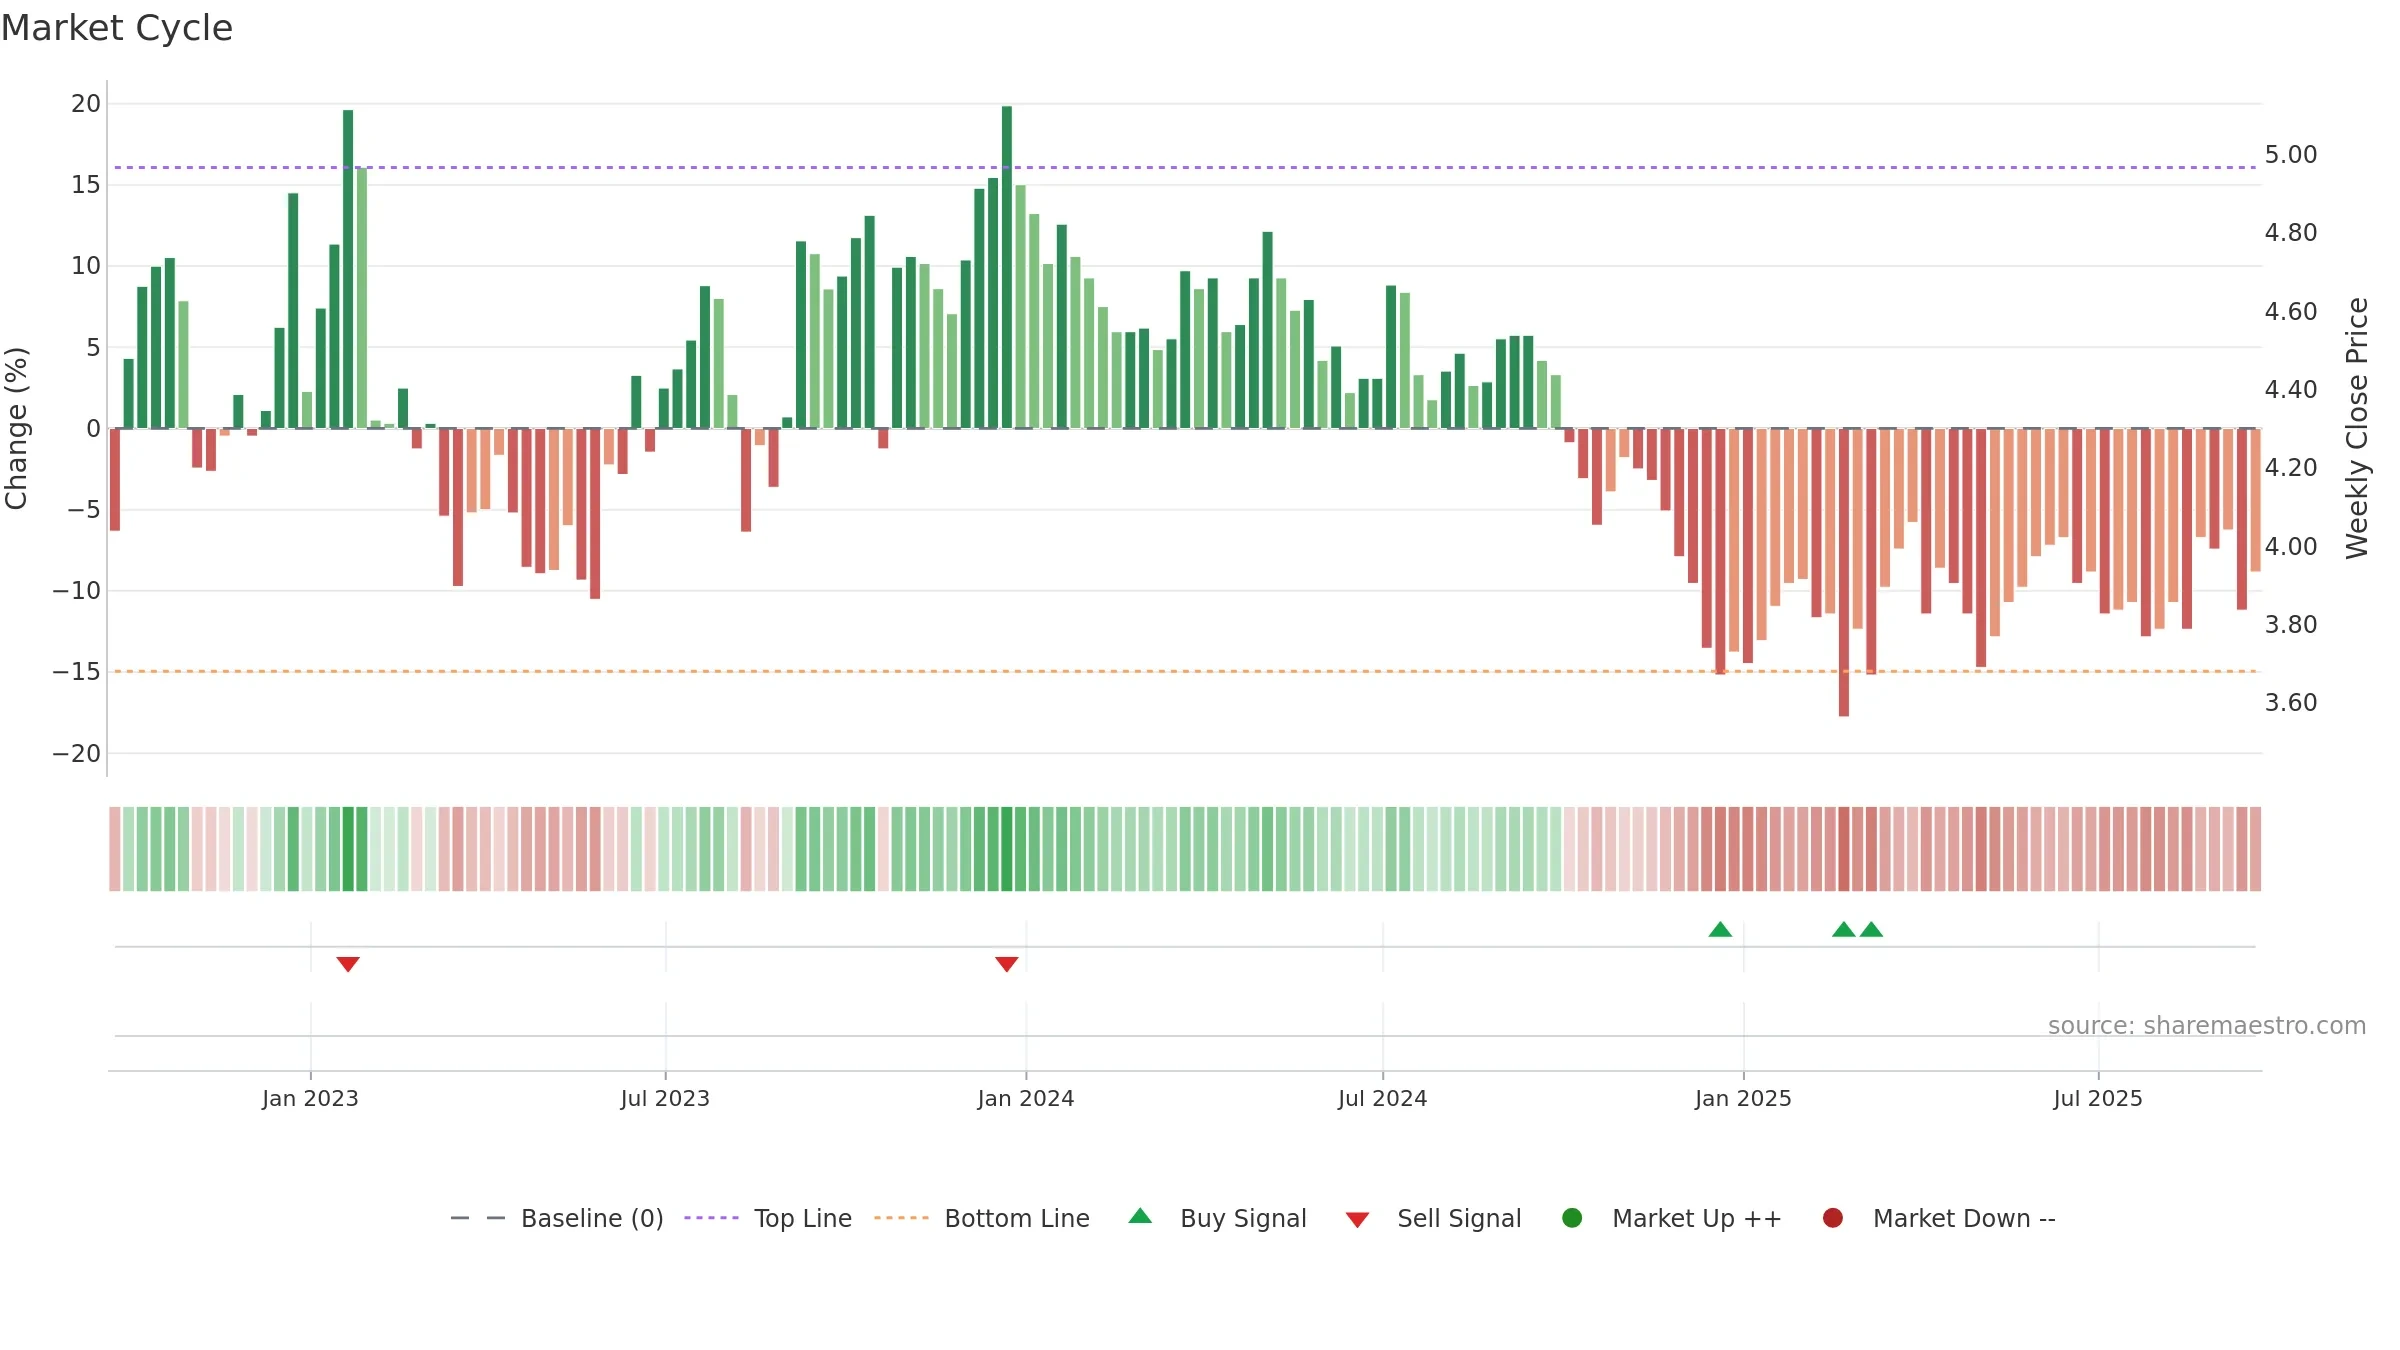
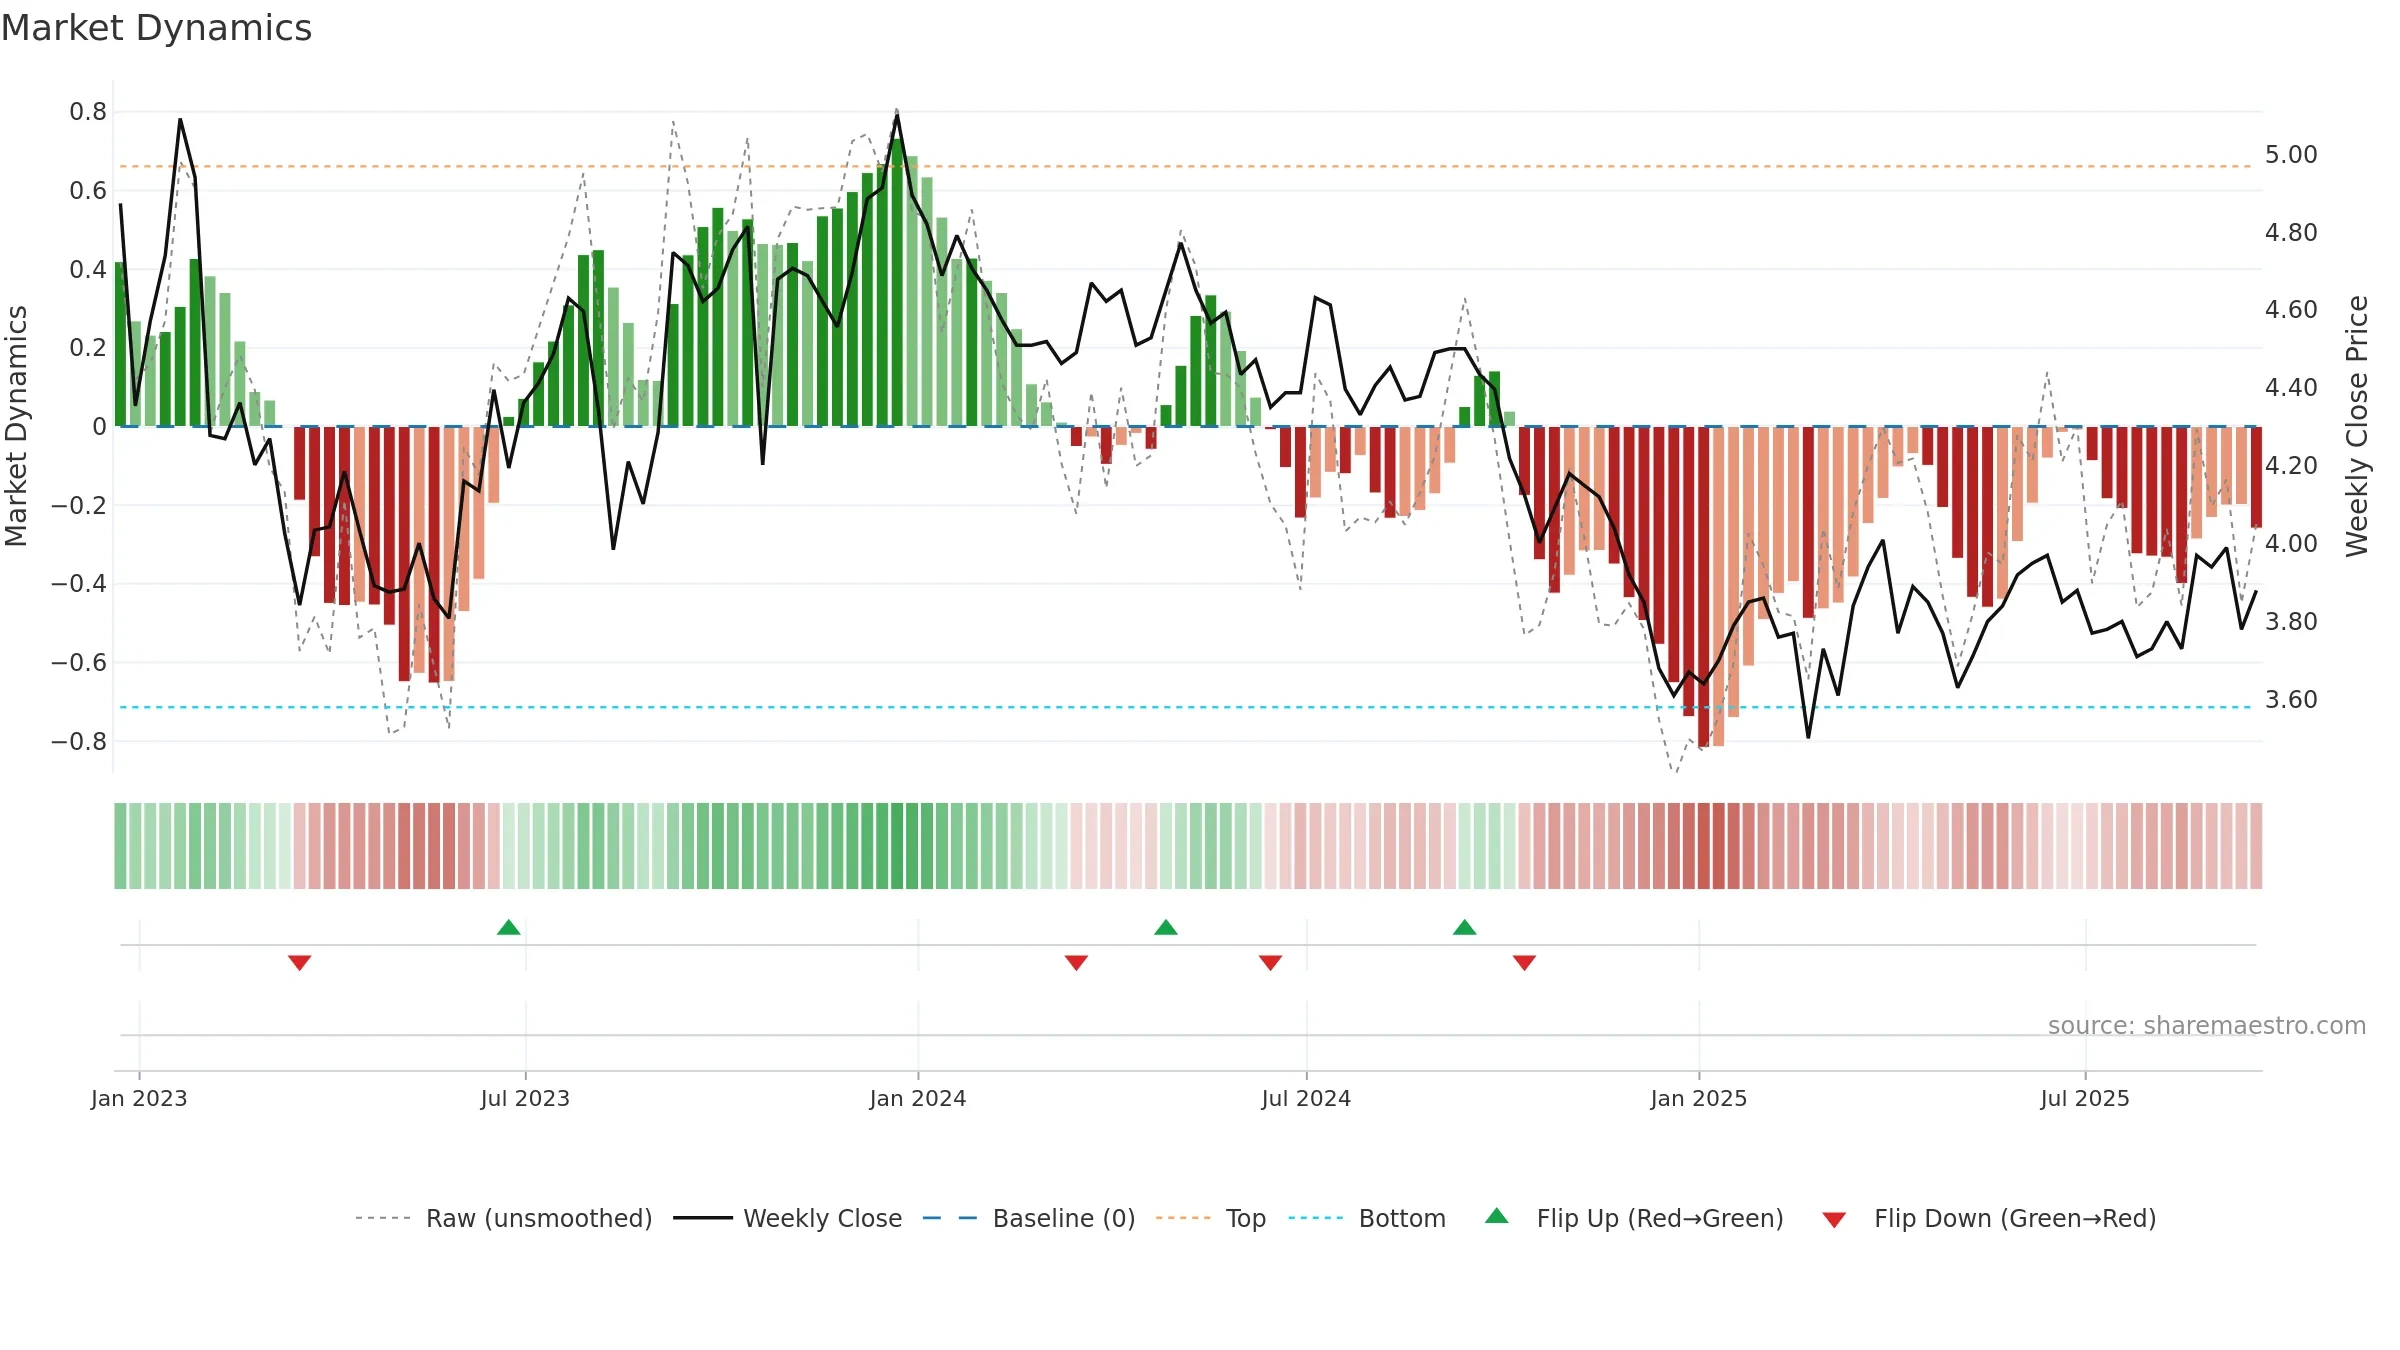
Valuation neutral pending further data.
Conclusion
Positive setup. ★★★★☆ confidence. Price window: 4. Trend: Range / Neutral; gauge 56. In combination, liquidity diverges from price.
- Price holds above 8w & 26w averages
- Low return volatility supports durability
- Liquidity diverges from price
Why: Price window 4.02% over 8w. Close is -2.76% below the prior-window high. Return volatility 1.77%. Volume trend falling. Liquidity divergence with price. Trend state range / neutral. Momentum neutral and rising. Valuation neutral.
Tip: Most metrics include a hover tooltip where they appear in the report.