East West Bancorp, Inc.
EWBC NASDAQ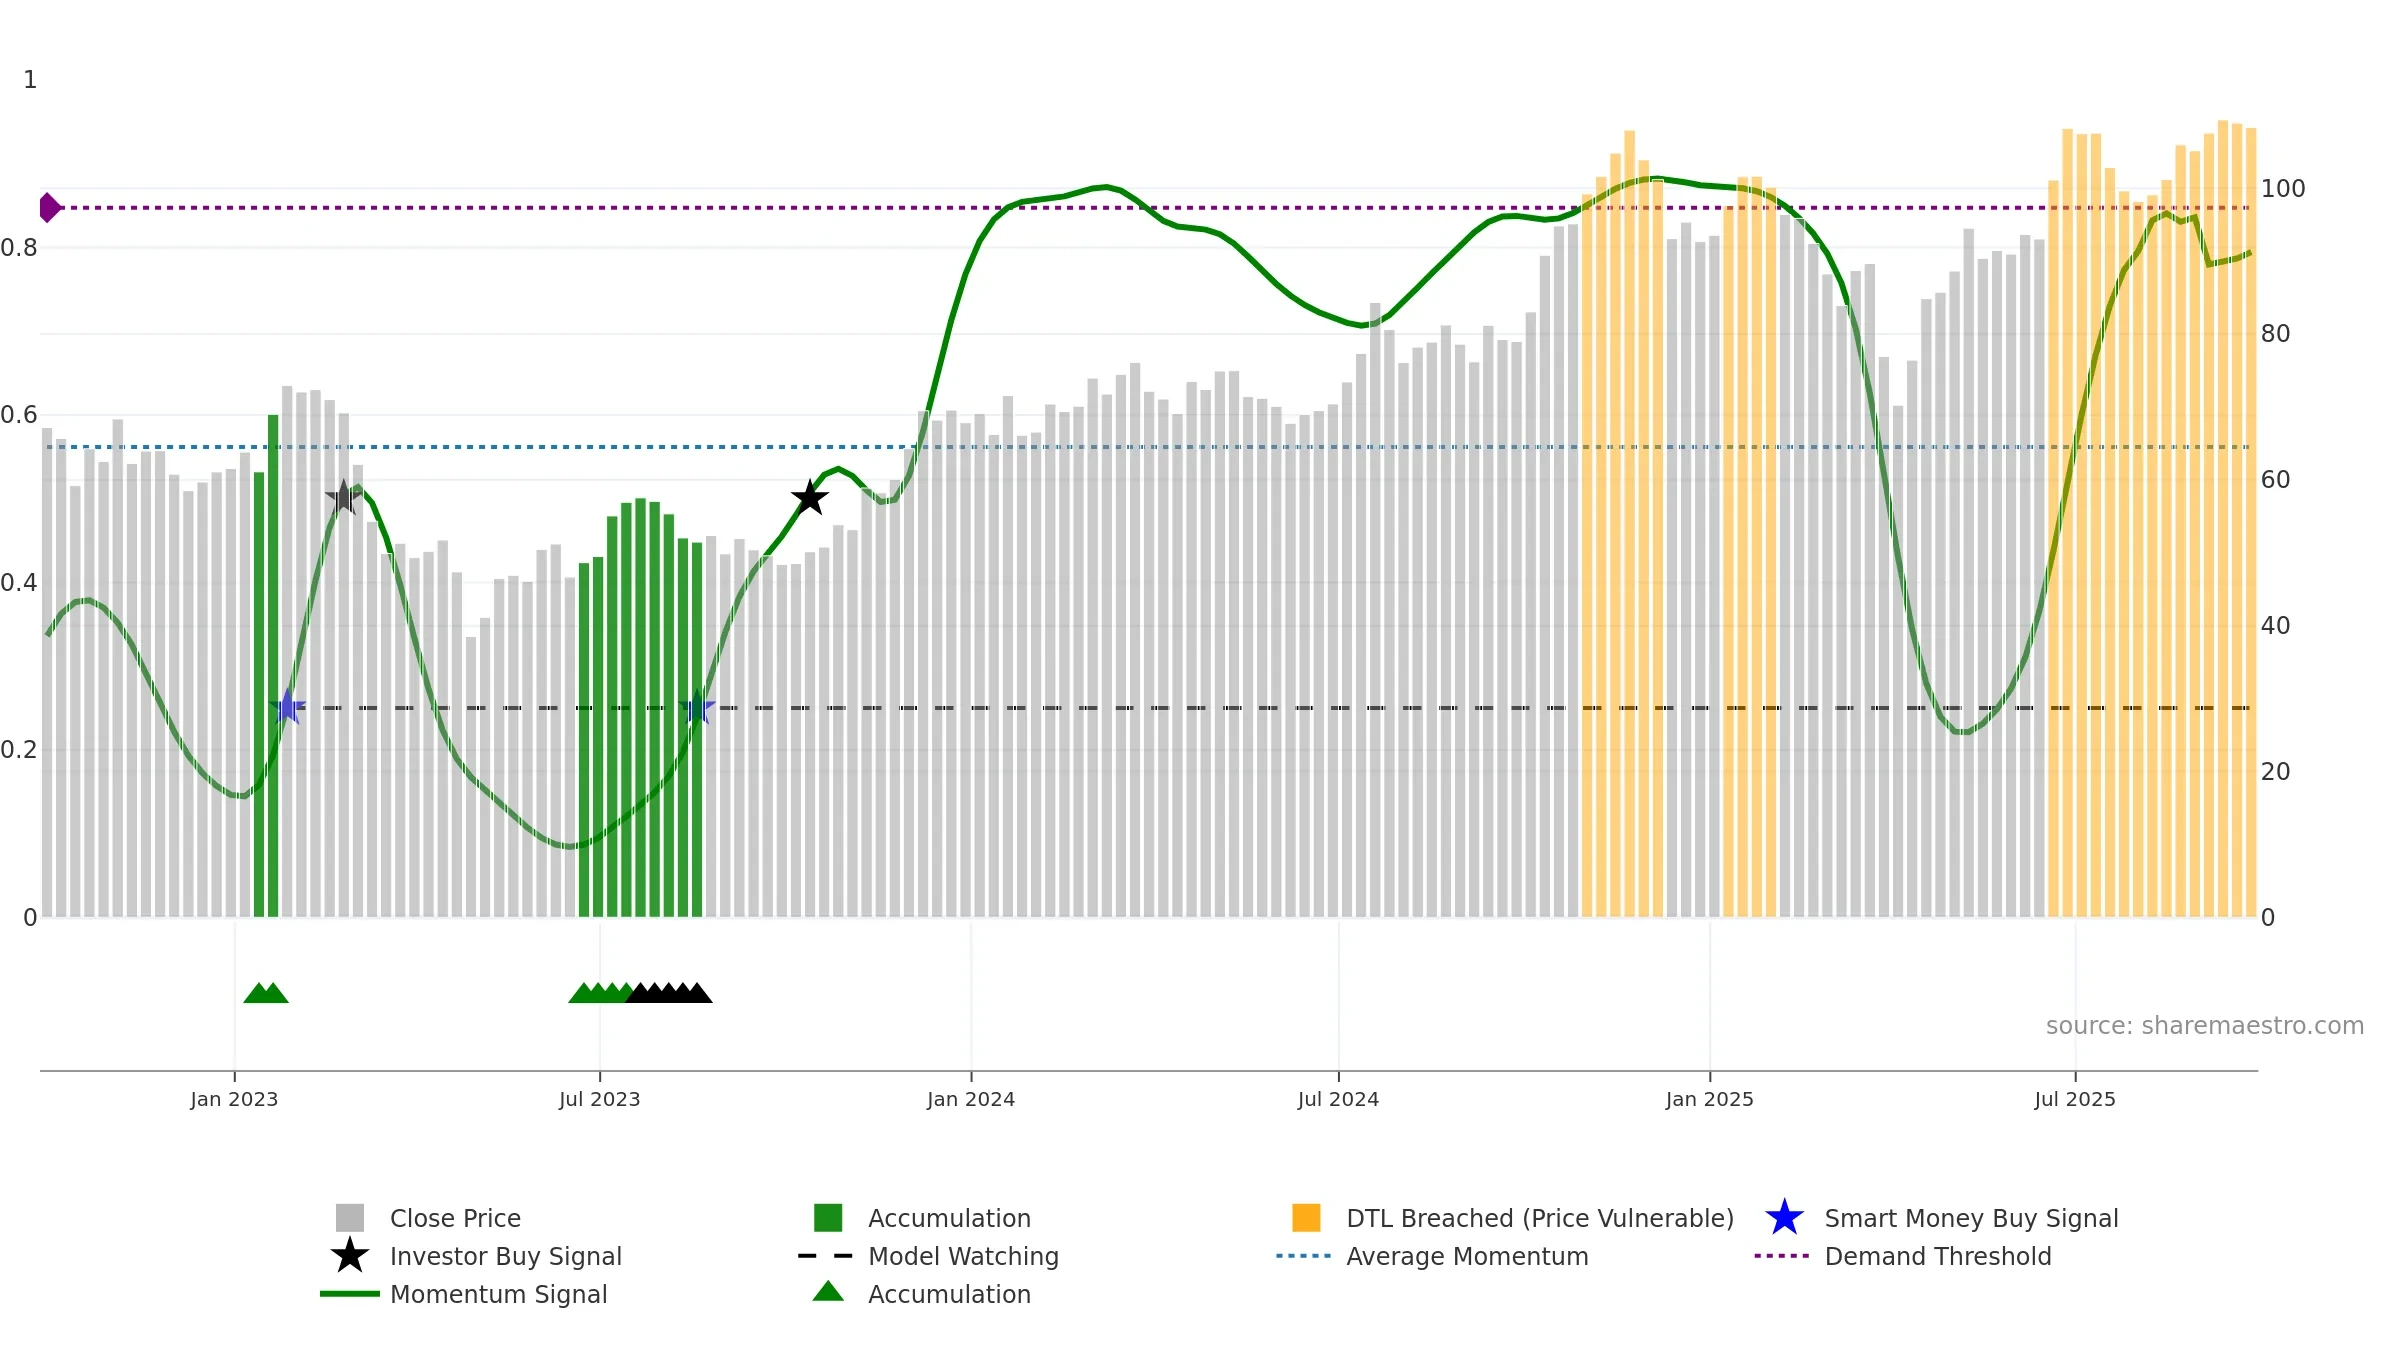
Weekly Summary
East West Bancorp, Inc. closed at 108.9500 (-0.60% WoW) . Data window ends Fri, 19 Sep 2025.
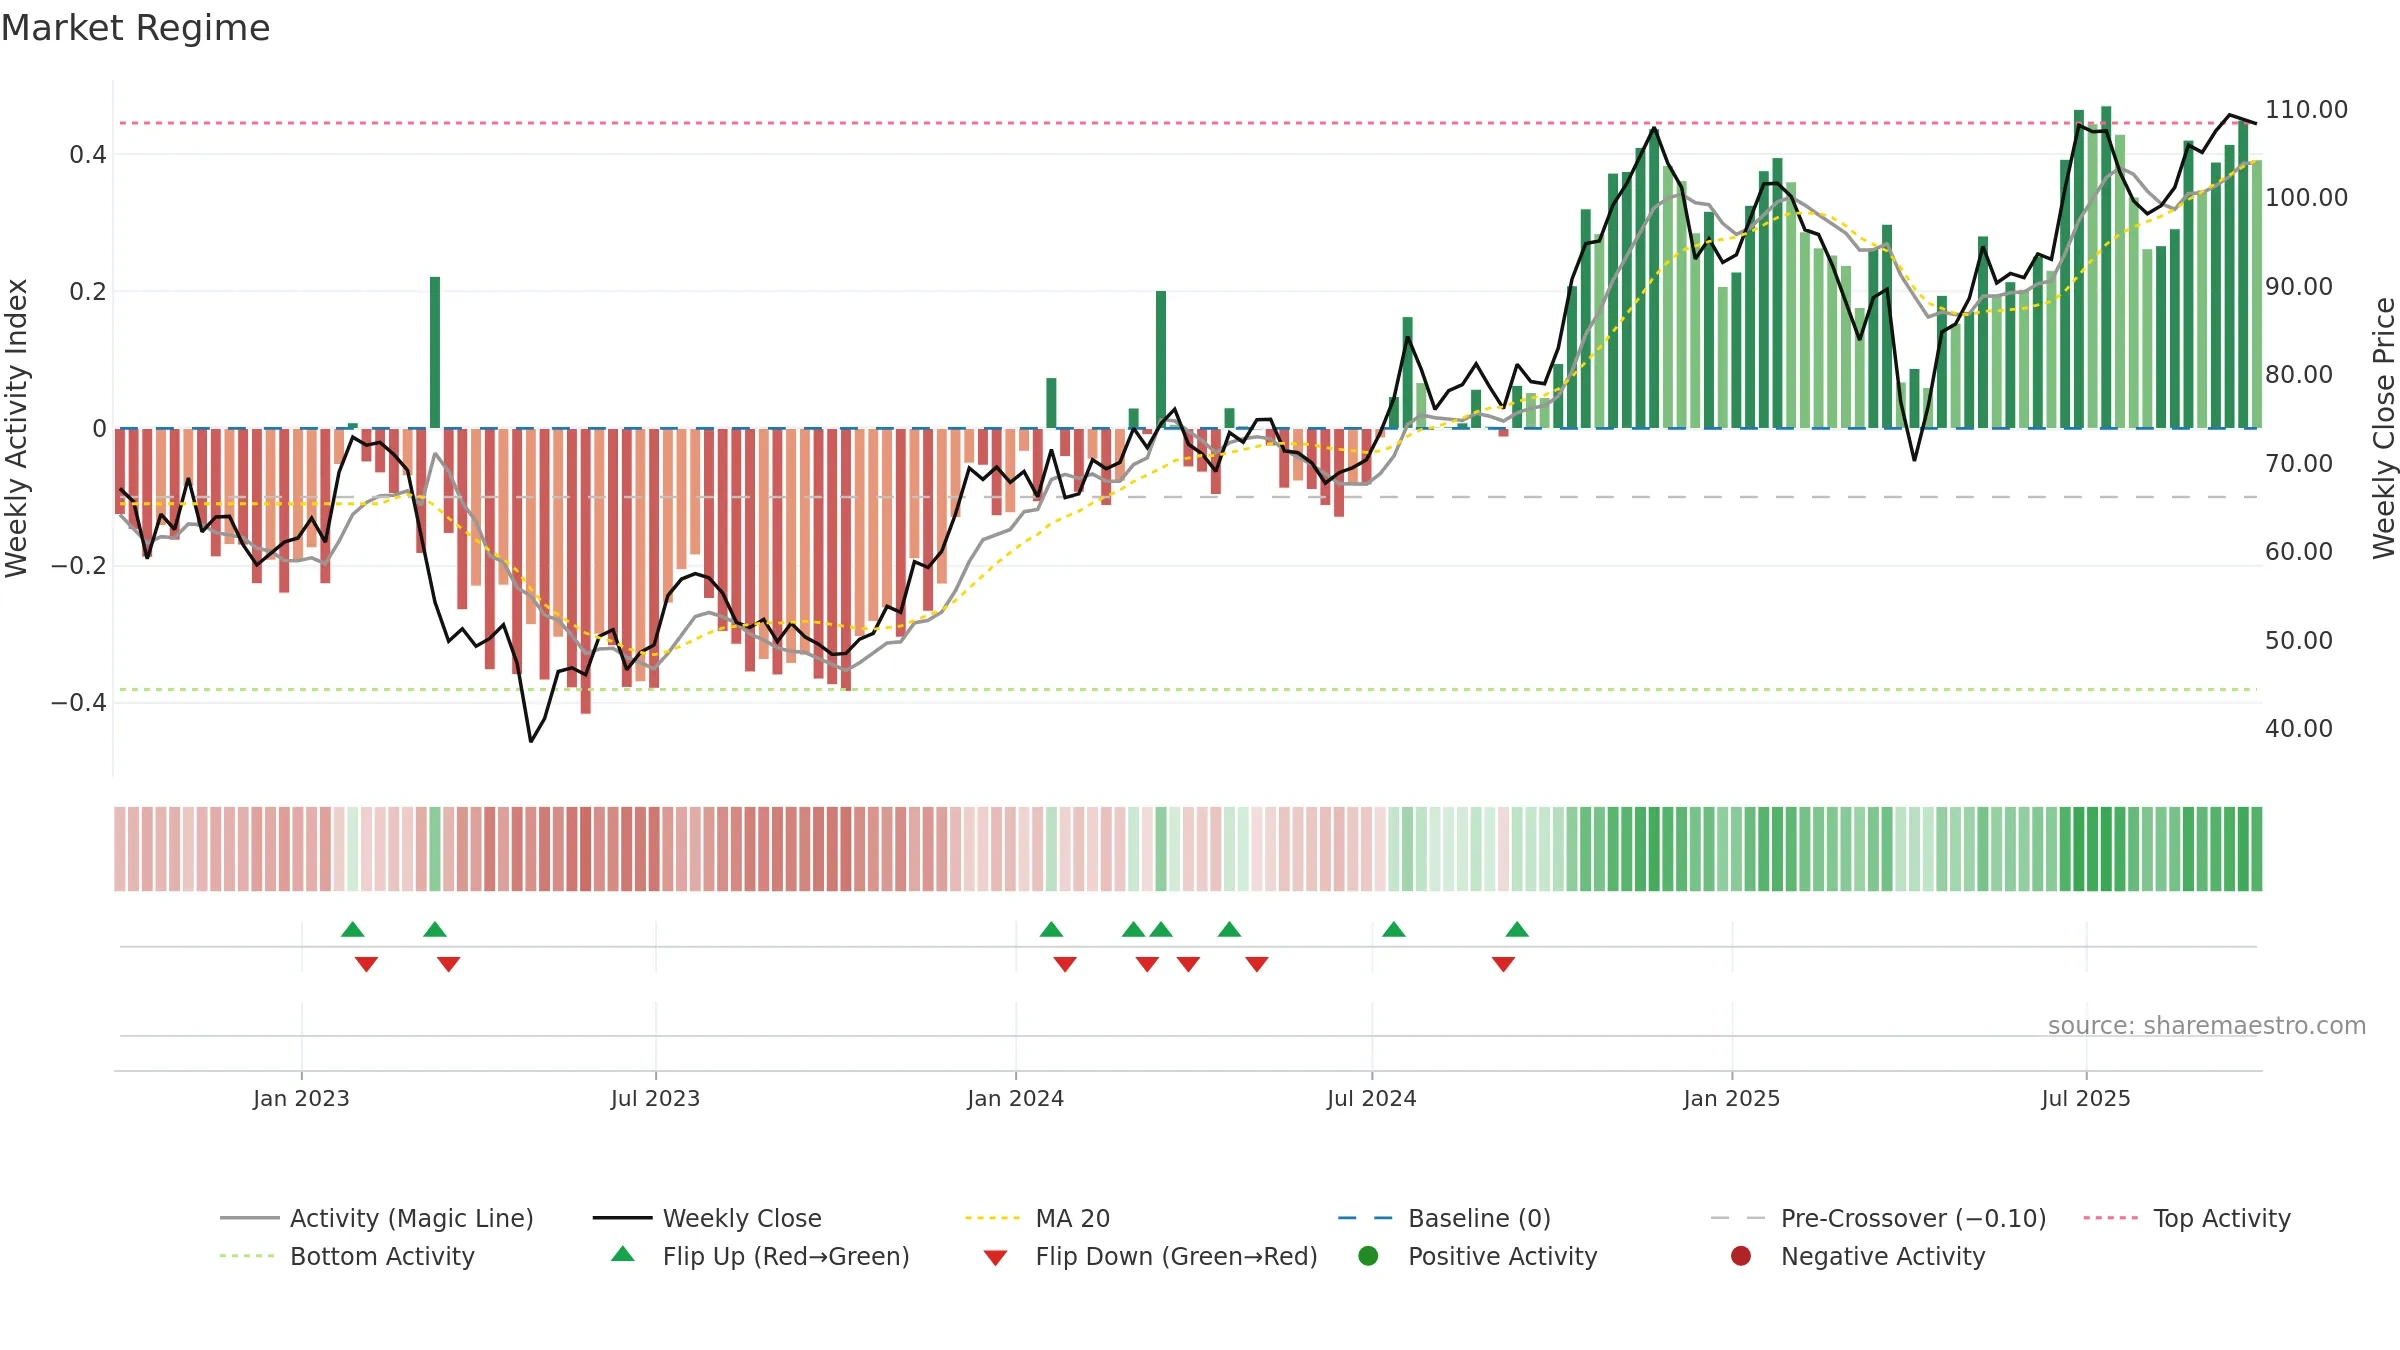
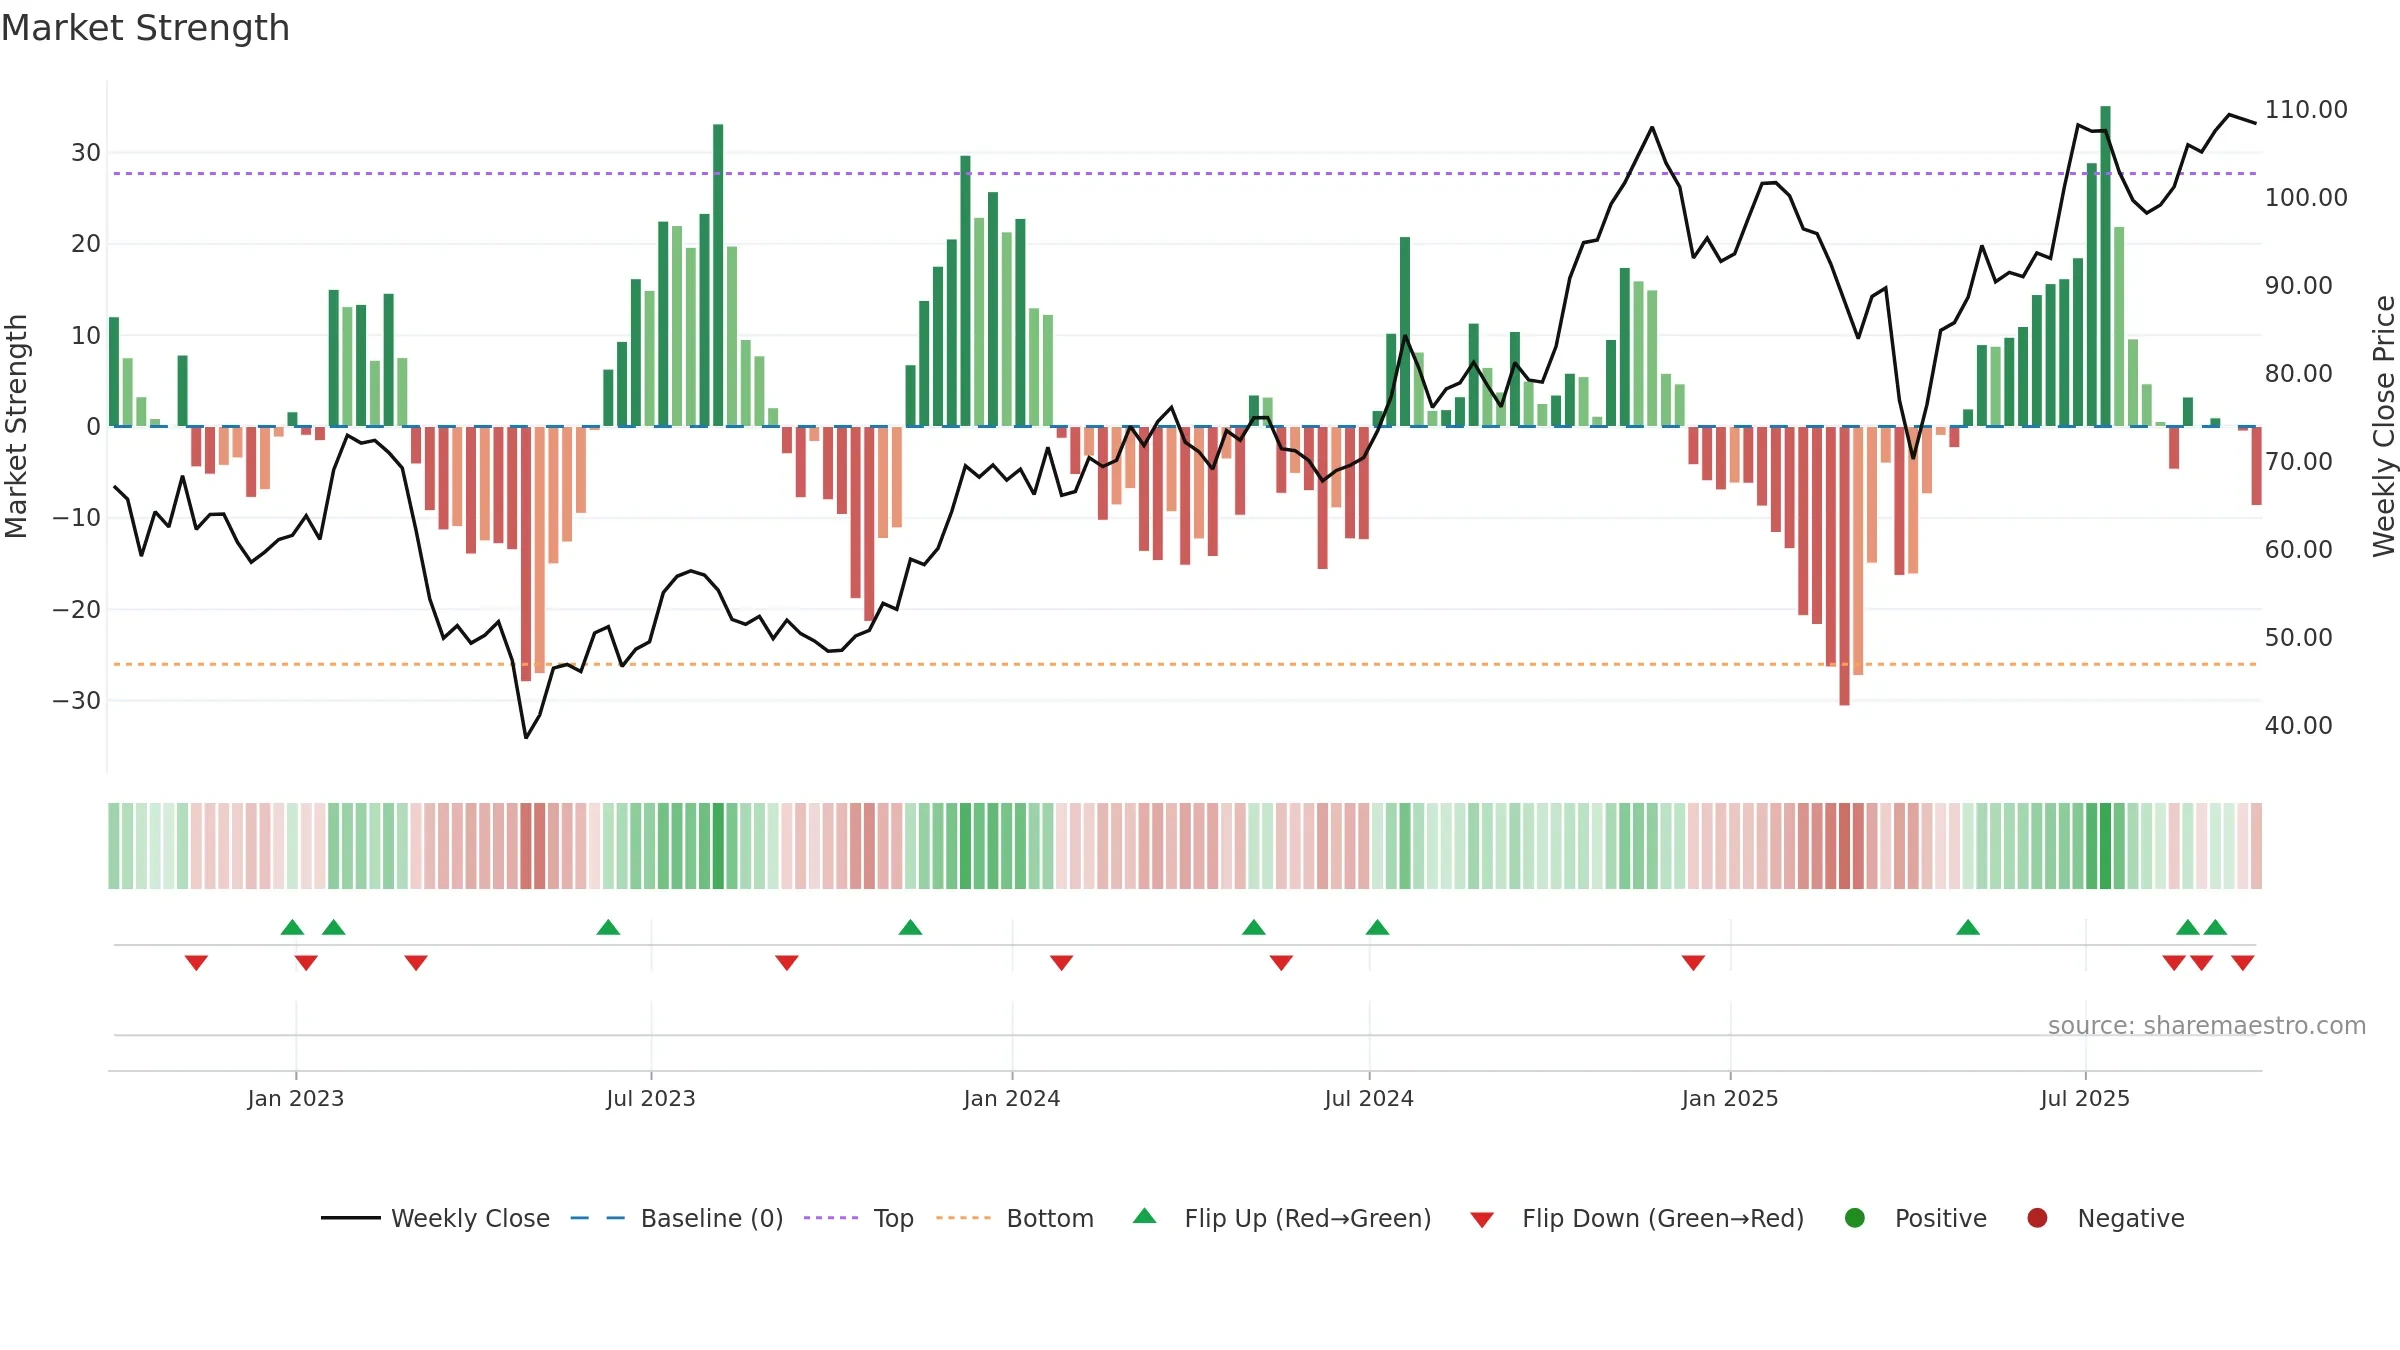
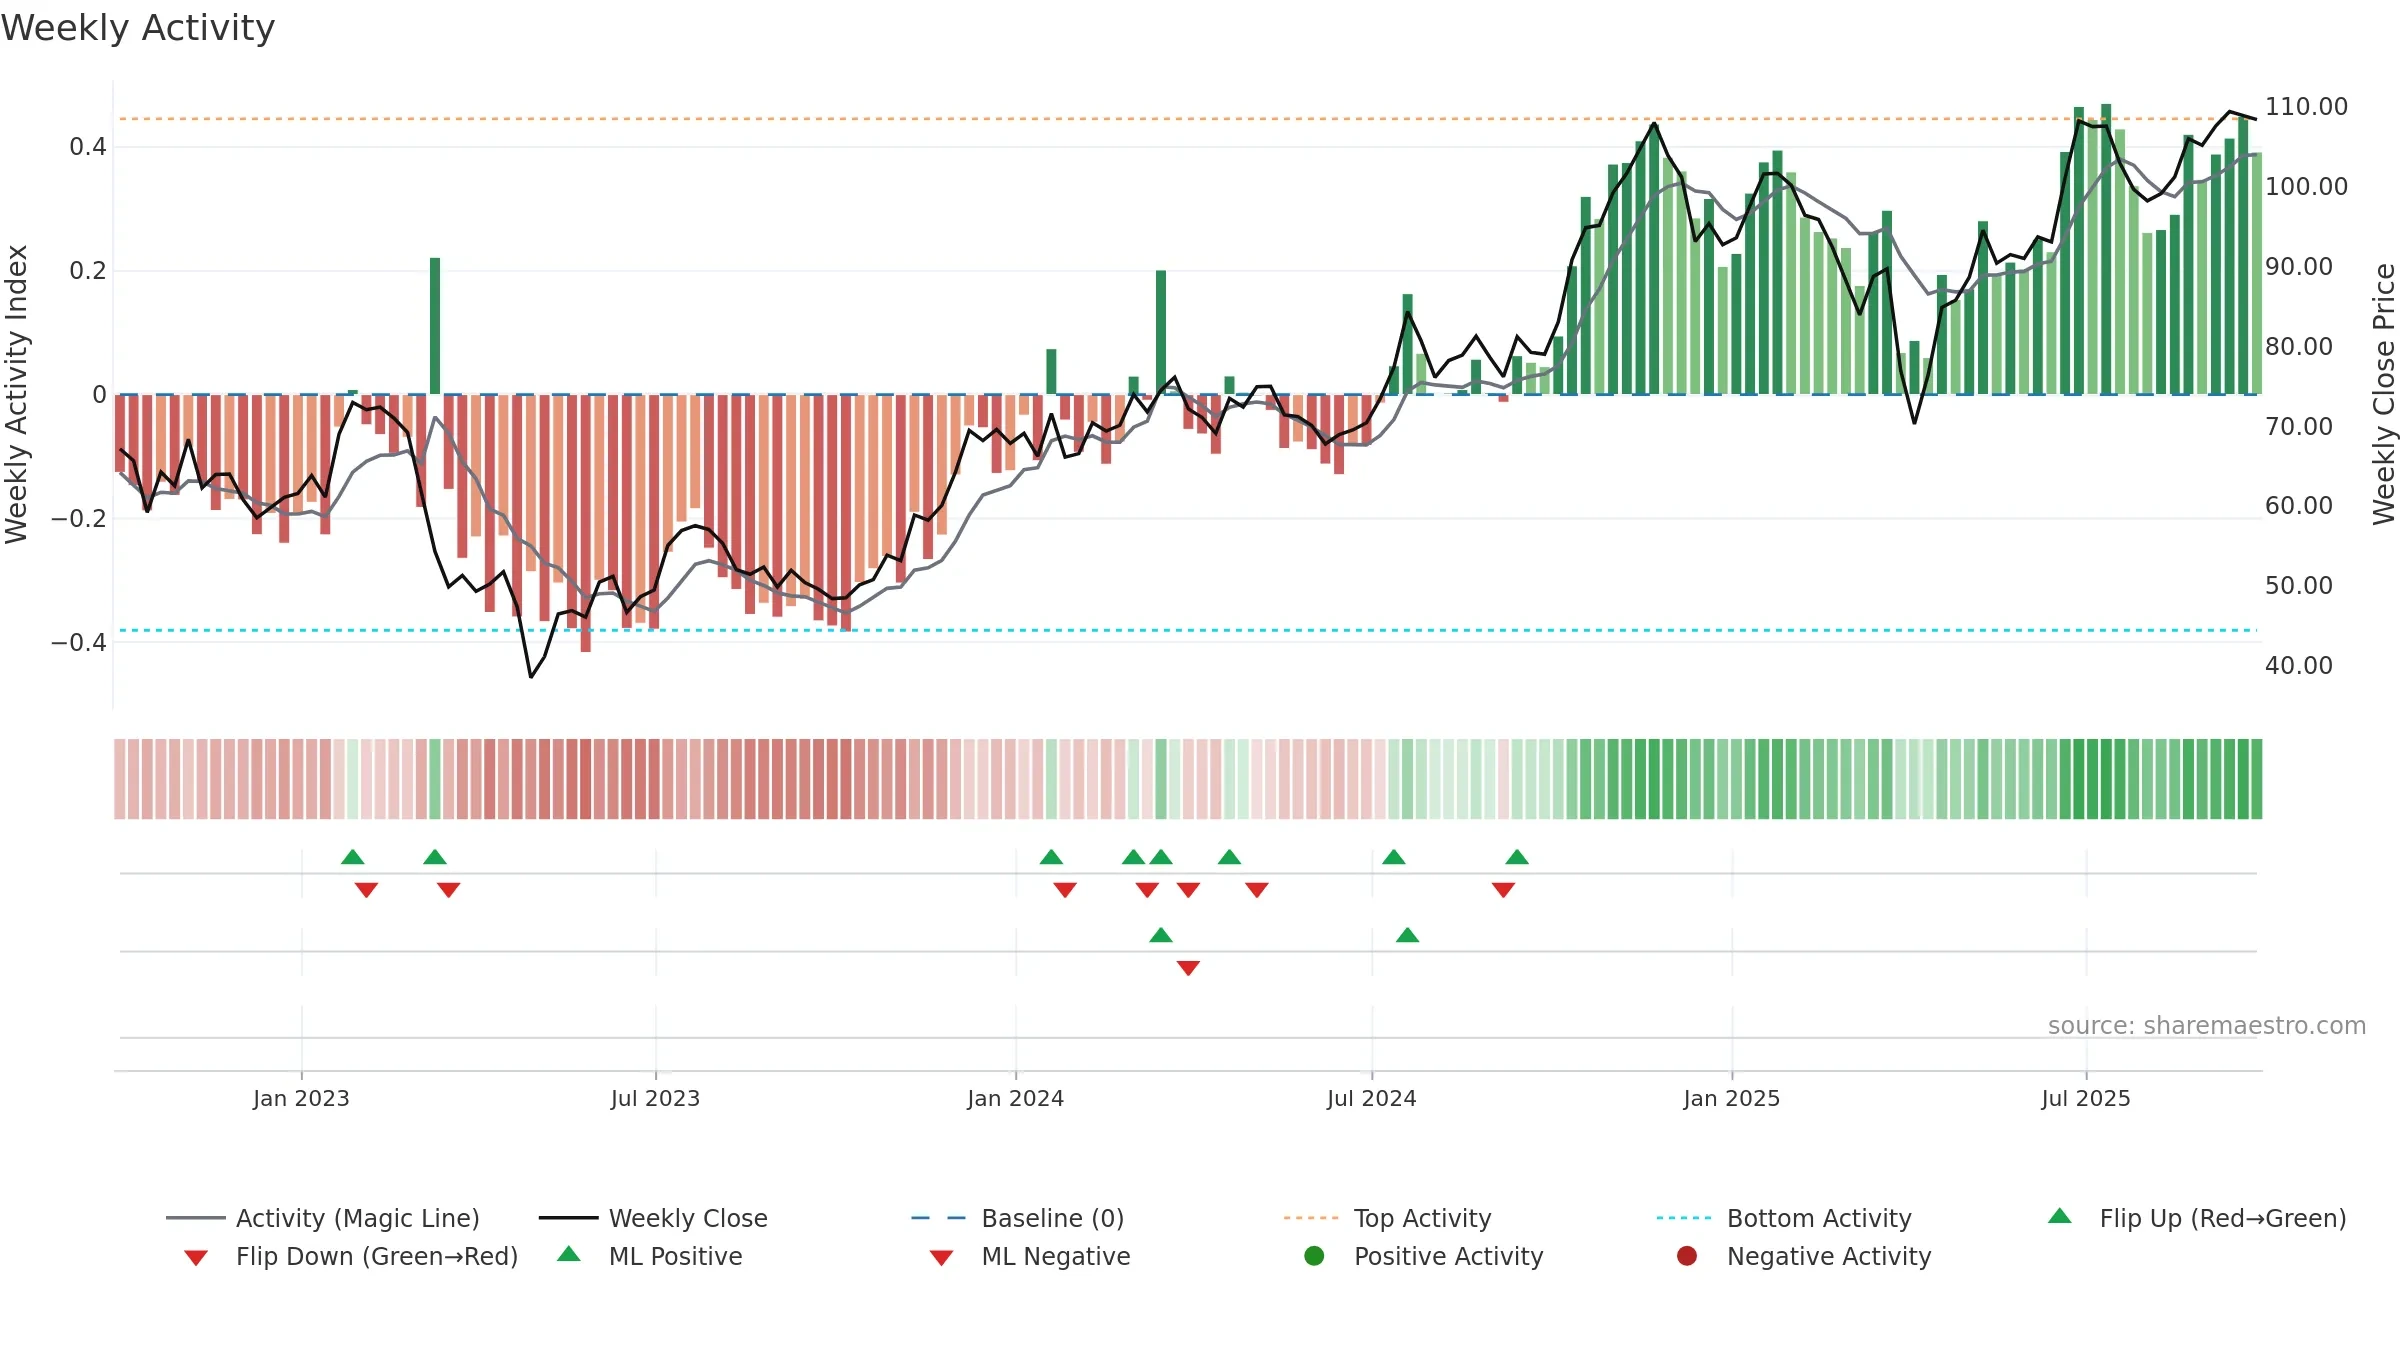
How to read this — Price slope is upward, indicating persistent buying over the window. Low weekly volatility favours steadier follow-through. Volume and price are moving in the same direction — a constructive confirmation. Returns are positively correlated with volume — strength tends to arrive on higher activity. Price holds above key averages, indicating constructive participation.
Up-slope supports buying interest; pullbacks may be contained if activity stays firm.
Gauge maps the trend signal to a 0–100 scale.
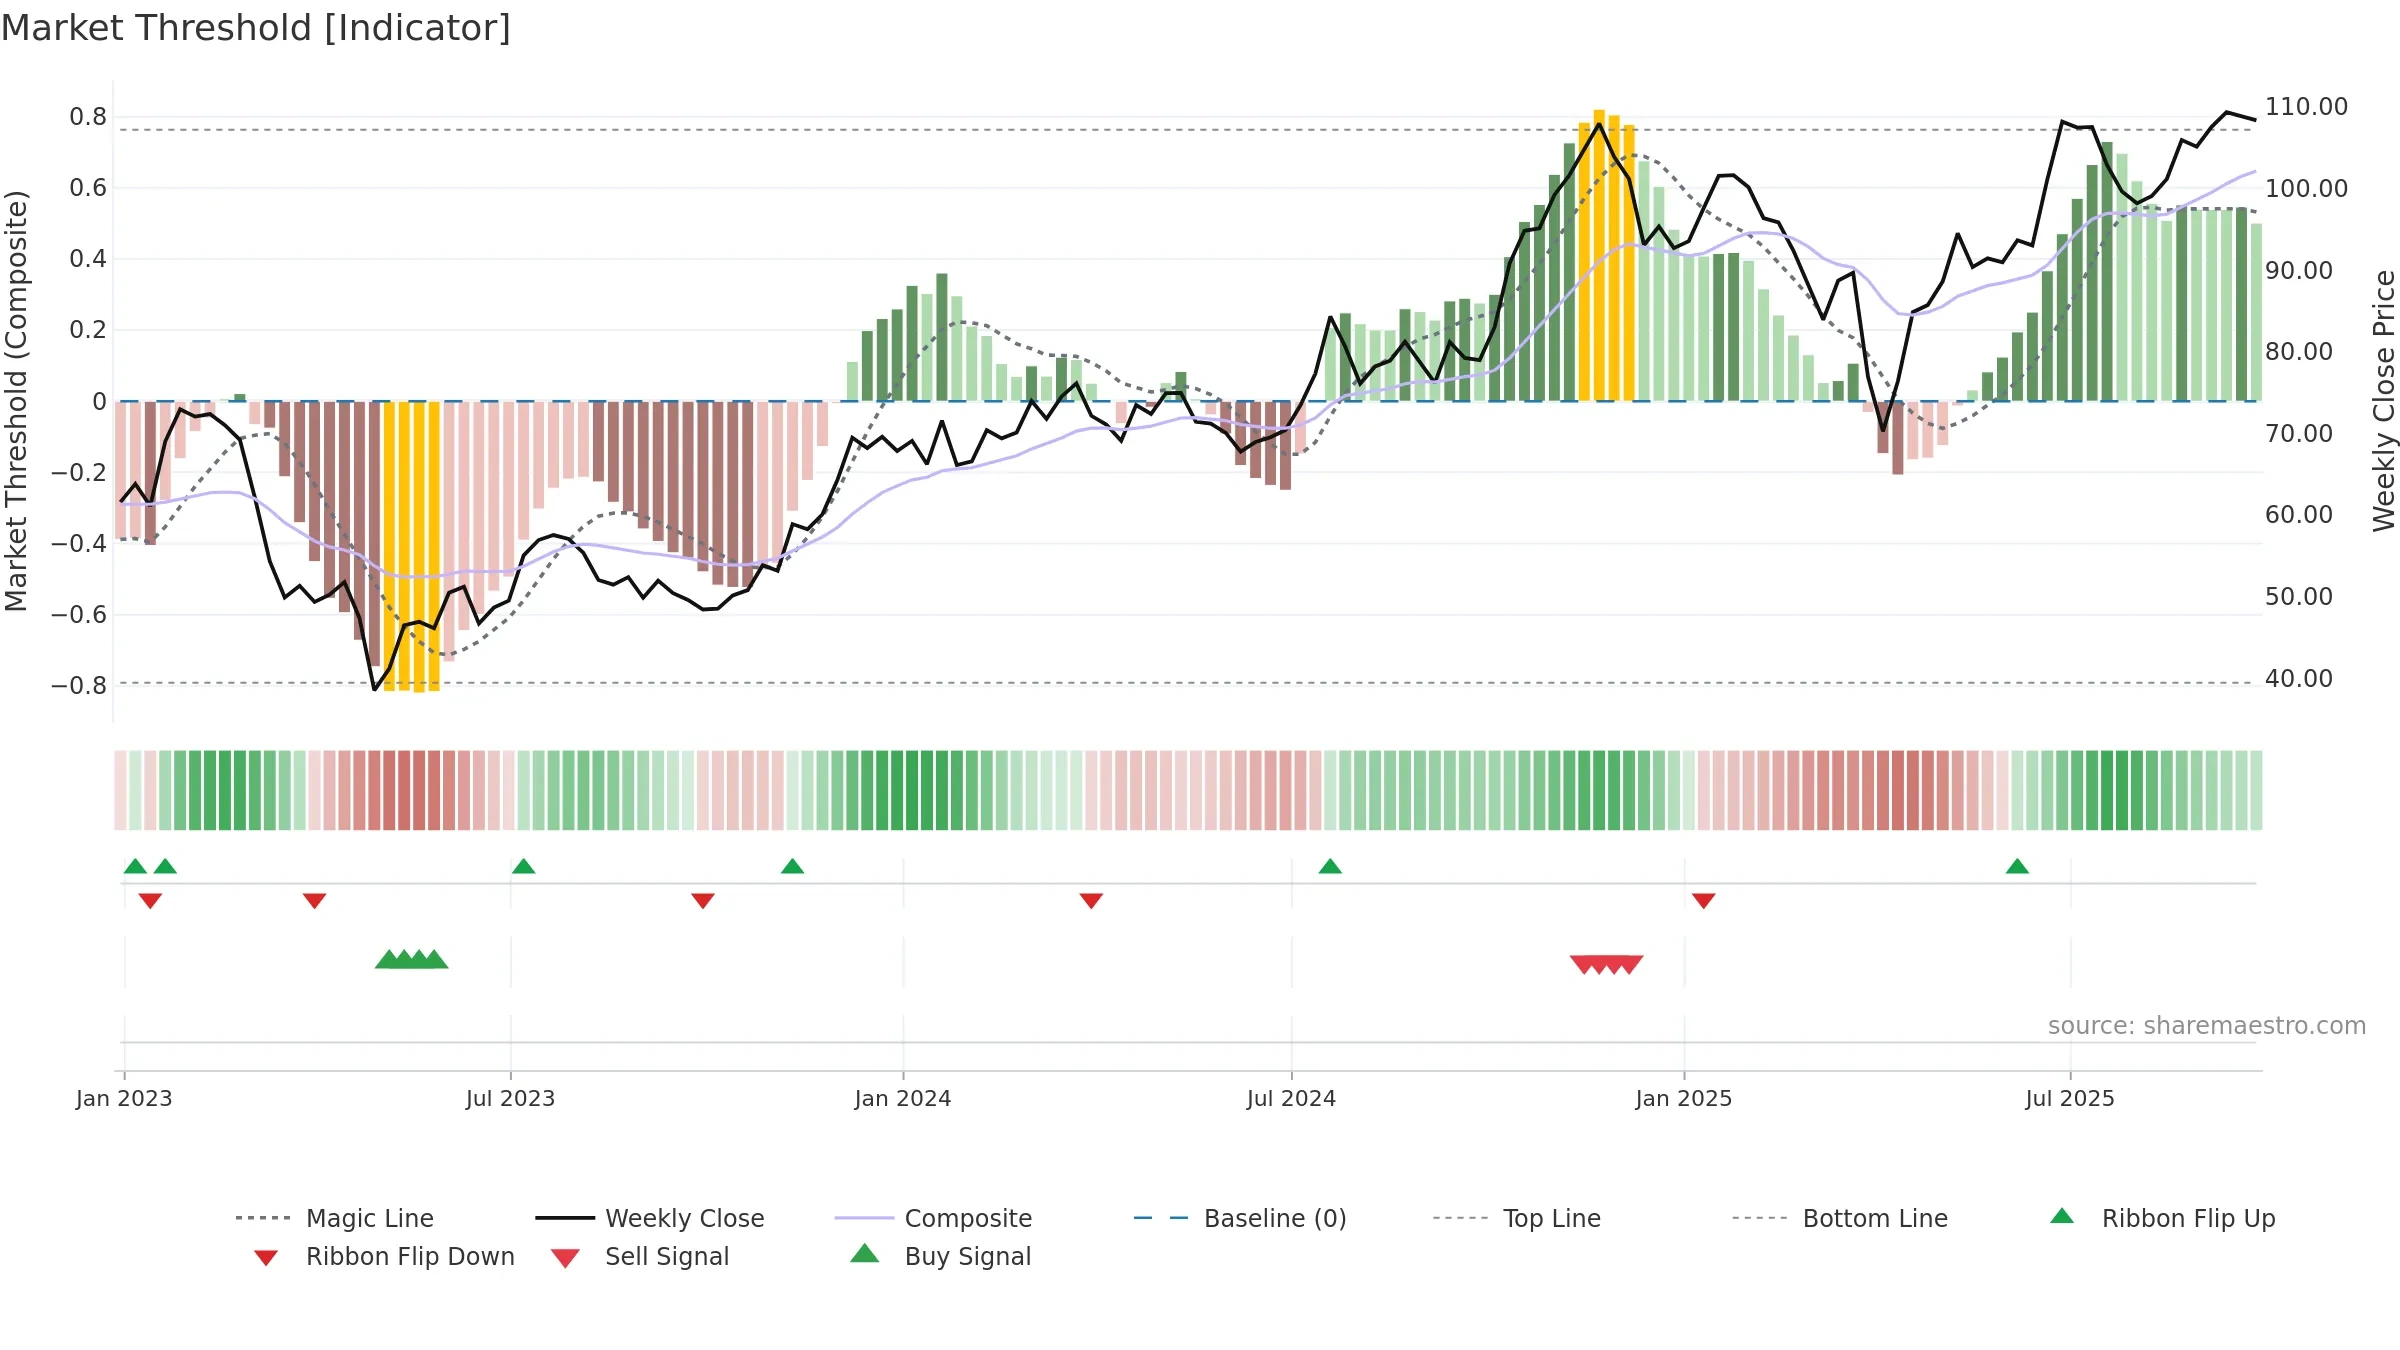
How to read this — Gauge is elevated but momentum is rolling over; topping risk is rising. Notable breakdown from ≥0.80 weakens trend quality.
Stay alert: protect gains or seek confirmation before adding risk.

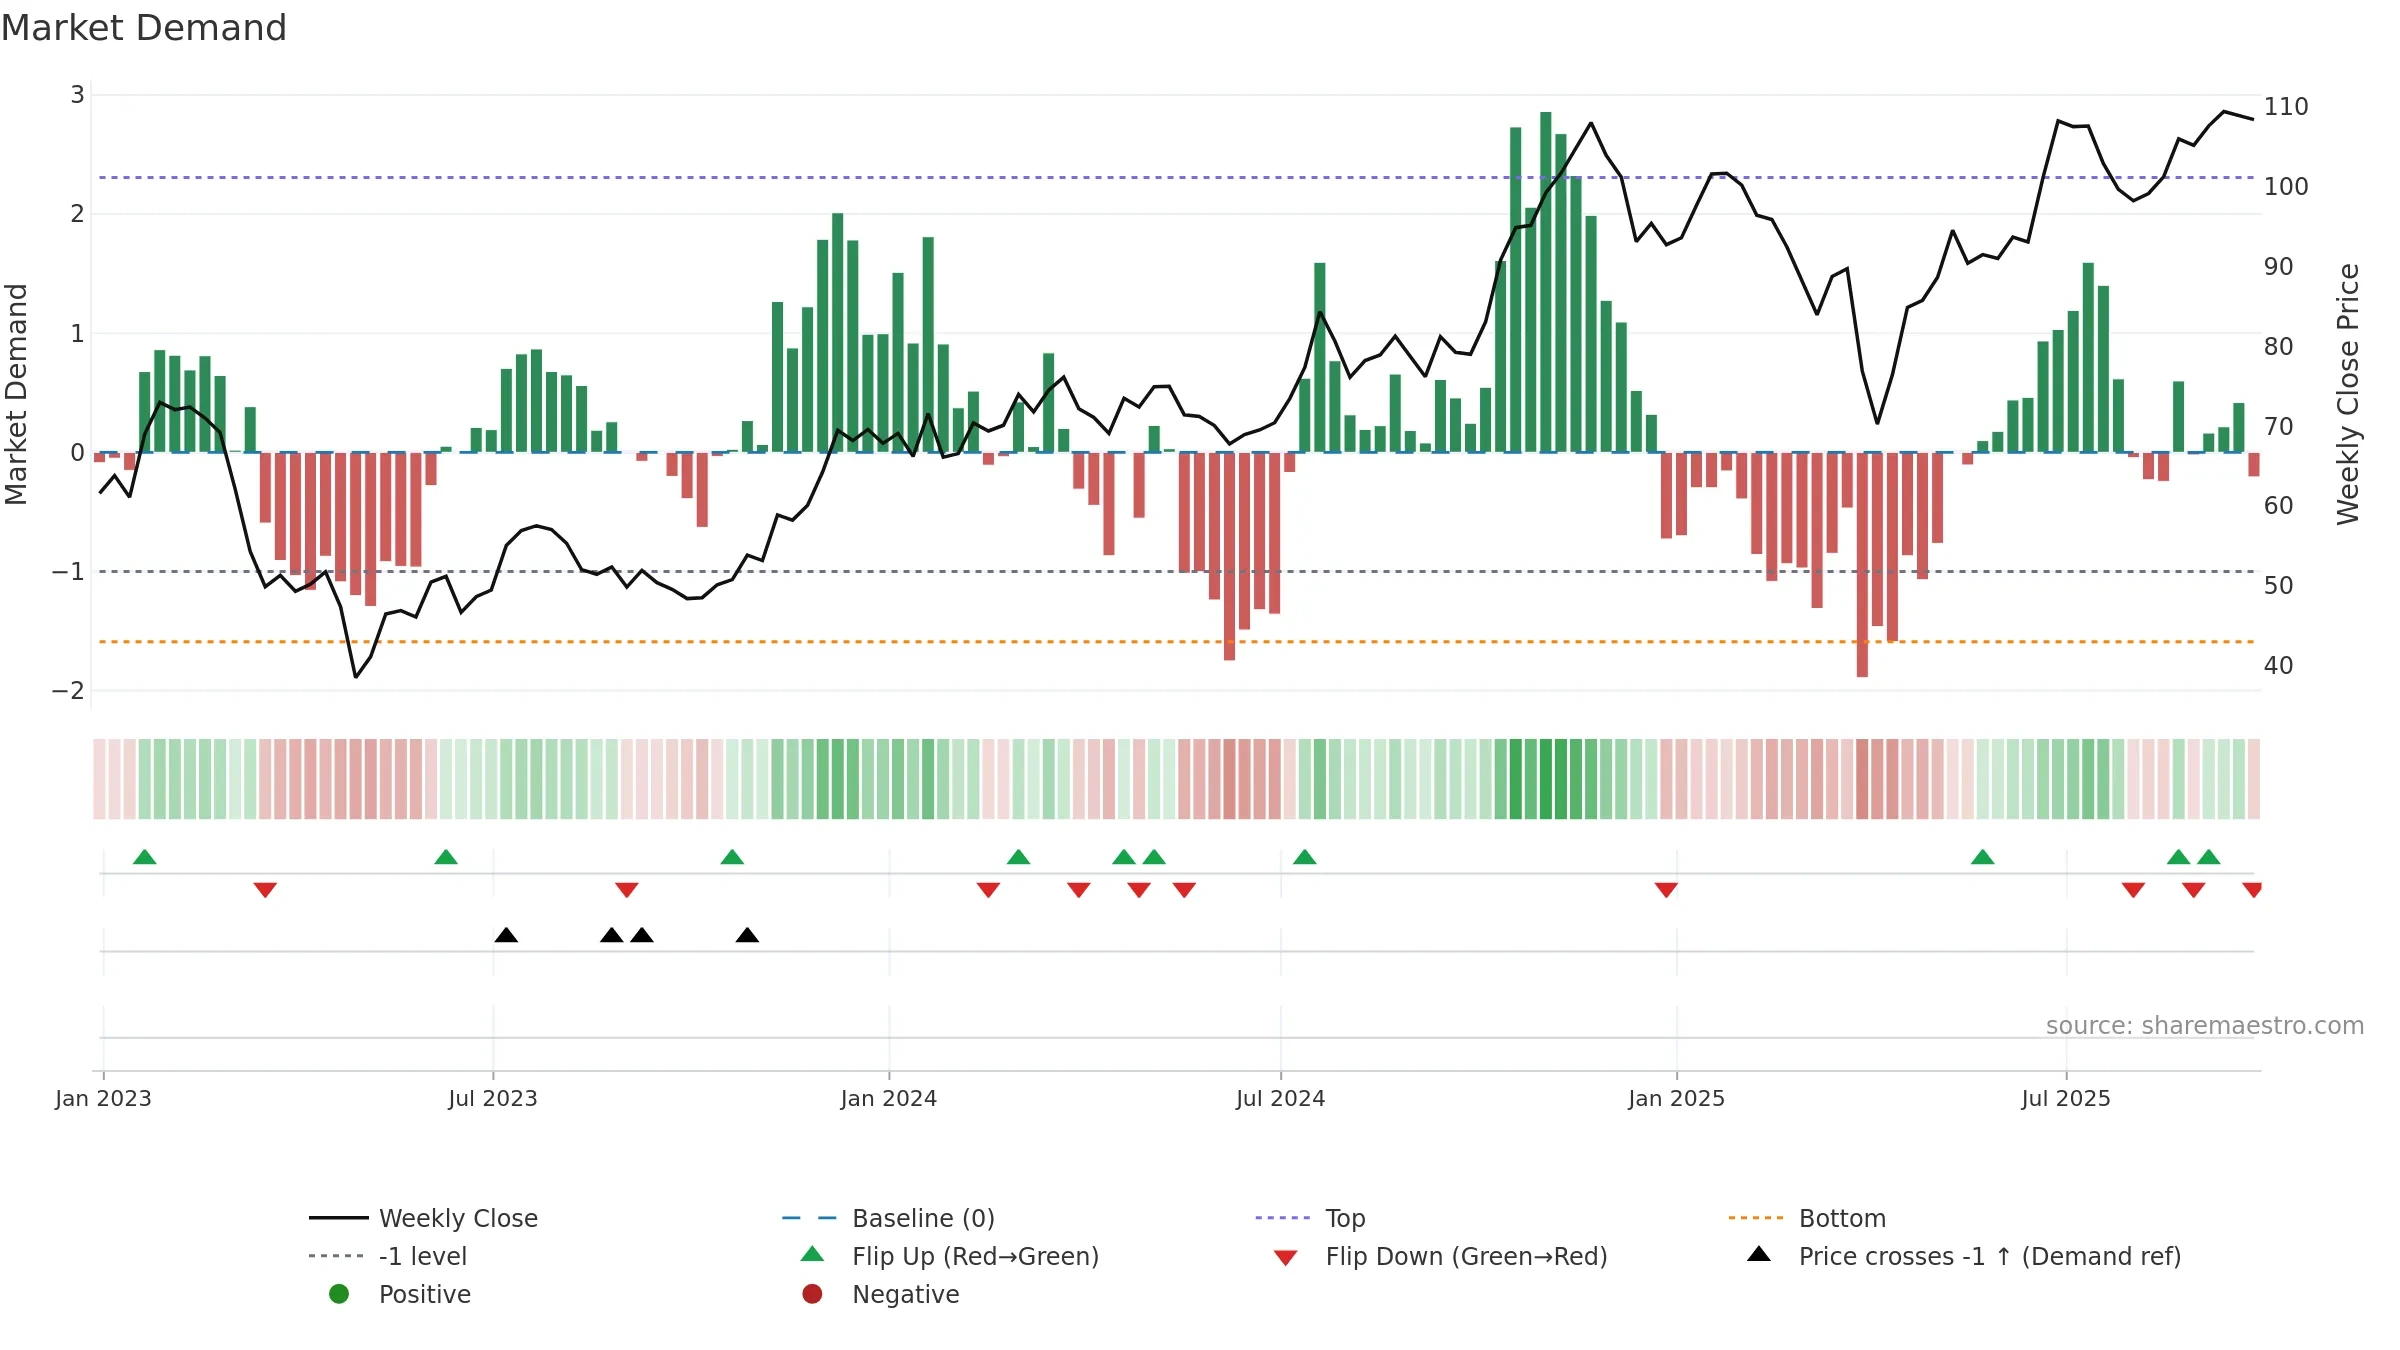
Relative strength is Negative
(< 0%, underperforming).
Latest MRS: -1.52% (week ending Fri, 19 Sep 2025).
Slope: Rising over 8w.
Notes:
- Below zero line indicates relative weakness vs benchmark.
- MRS slope rising over ~8 weeks.
Conclusion
Neutral setup. ★★★☆☆ confidence. Trend: Uptrend at Risk · 10.95% over window · vol 1.89% · liquidity convergence · posture above
- Price holds above 8–26 week averages
- Liquidity confirms the price trend
- Low return volatility supports durability
- Solid multi-week performance
- High level but momentum rolling over (topping risk)
- Momentum is weak/falling
- Recent breakdown from ≥0.80 weakens trend quality
Why: Price window 10.95% over w. Return volatility 1.89%. Volume trend rising. Liquidity convergence with price. Trend state uptrend at risk. Momentum bullish and falling.
Tip: Most metrics include a hover tooltip where they appear in the report.