Mirrabooka Investments Limited
MIR ASX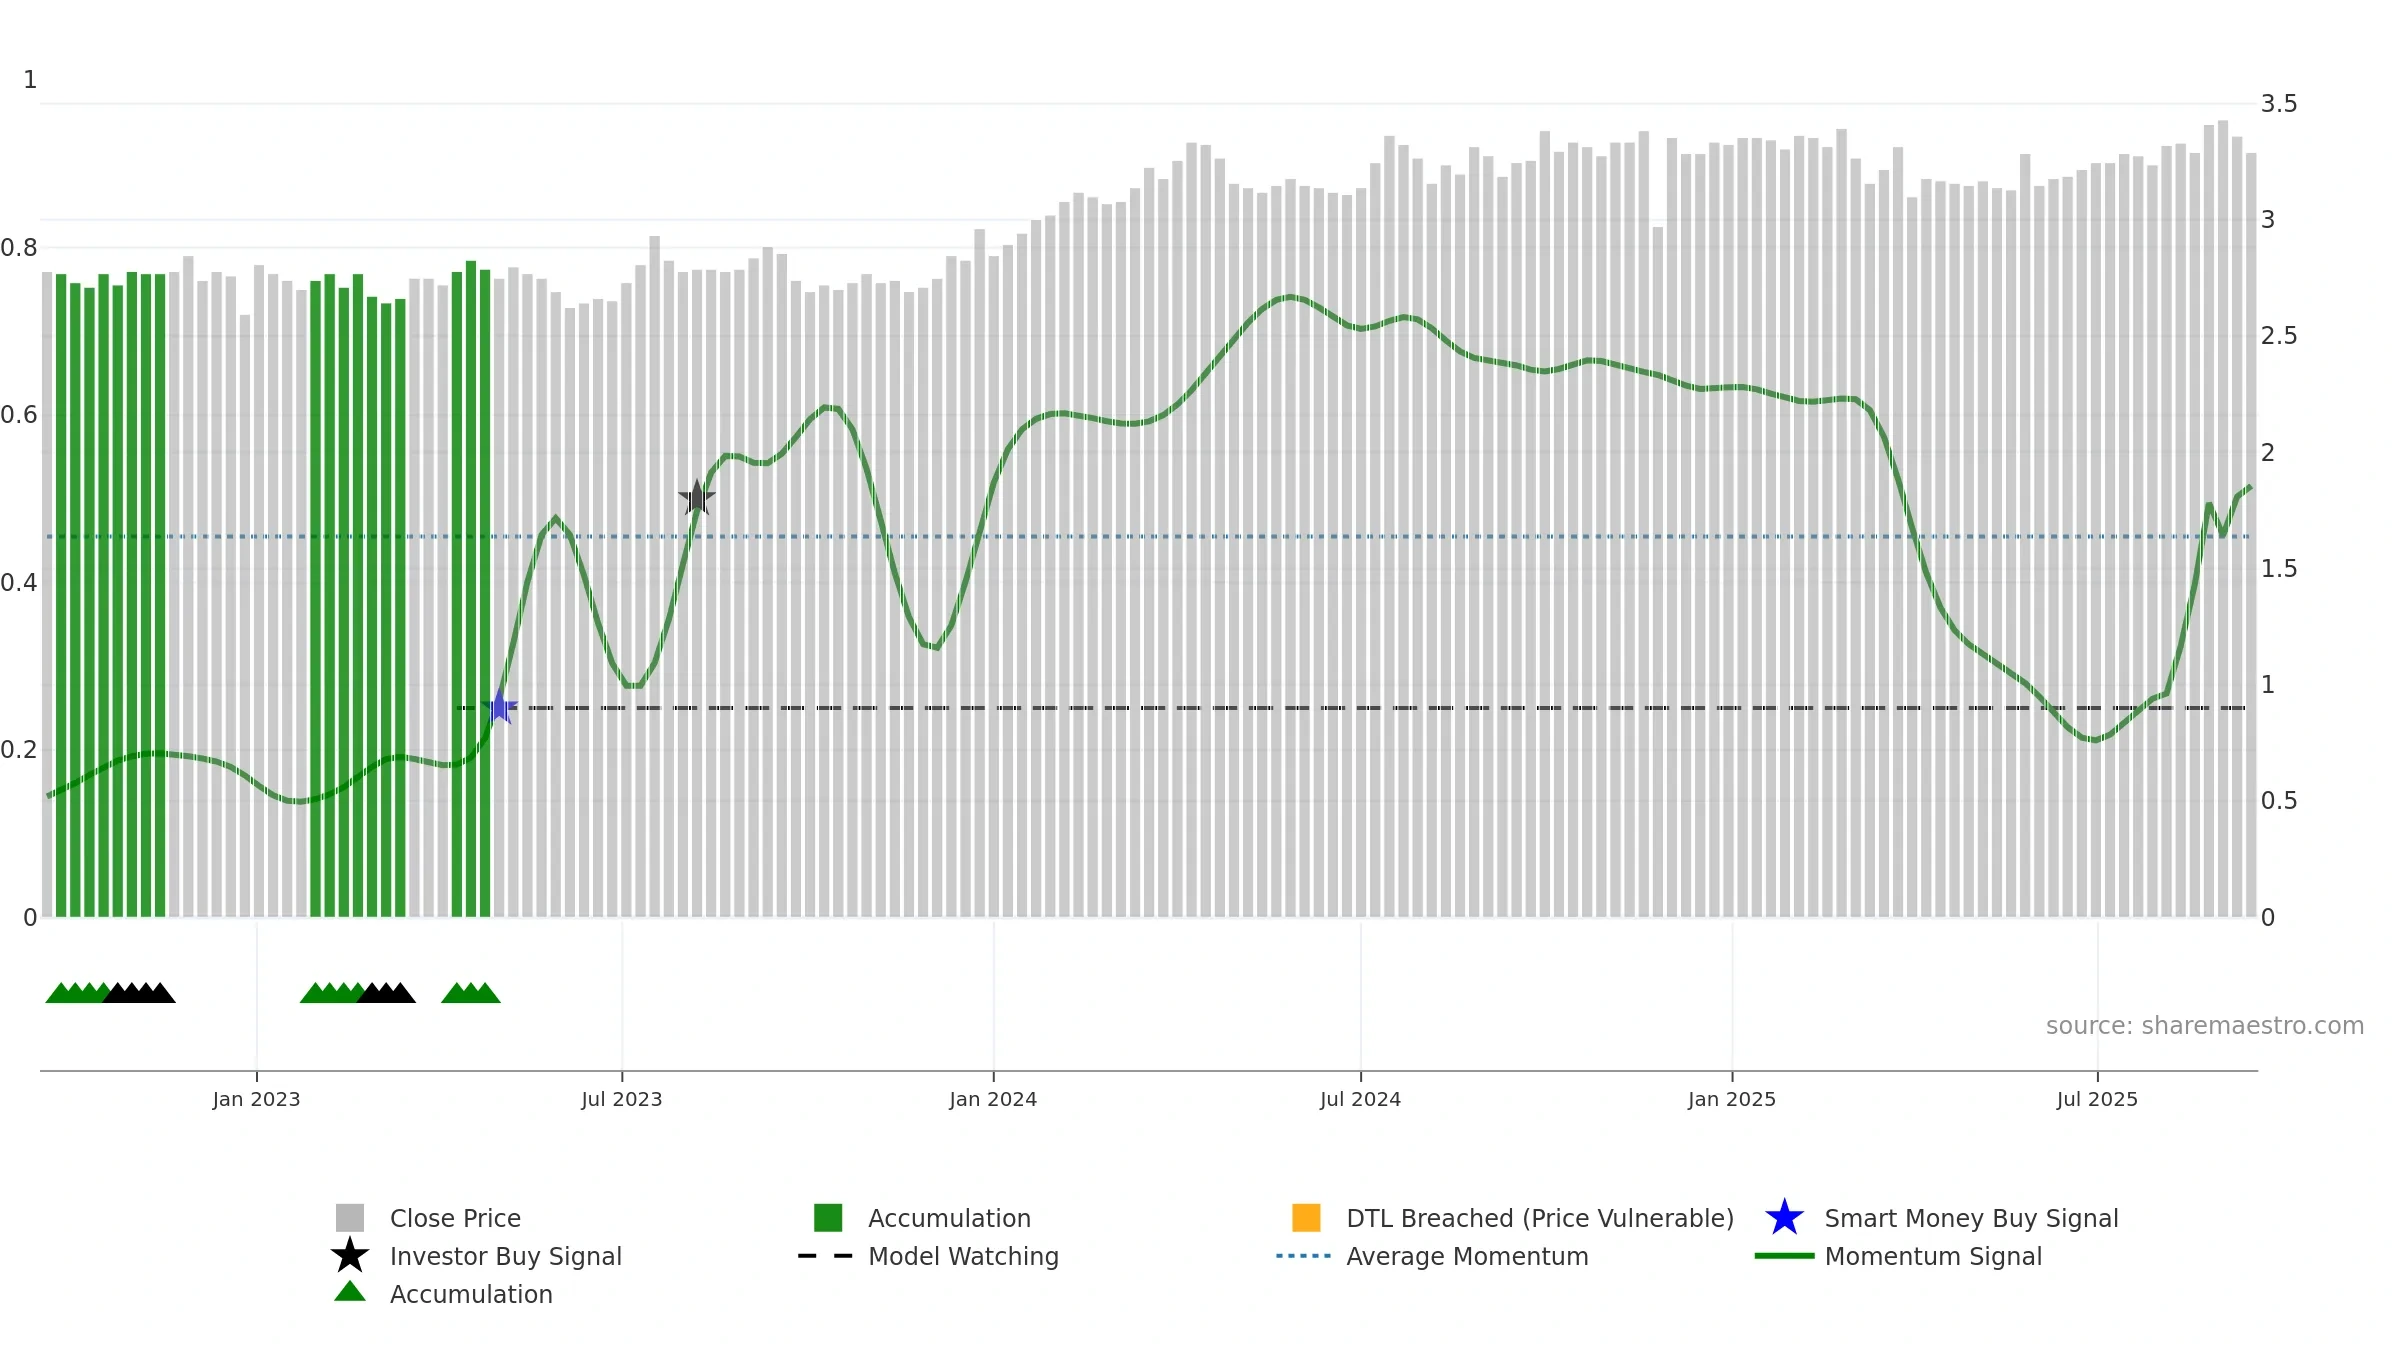
Weekly Report
Mirrabooka Investments Limited closed at 3.2900 (-0.90% WoW) . Data window ends Mon, 15 Sep 2025.
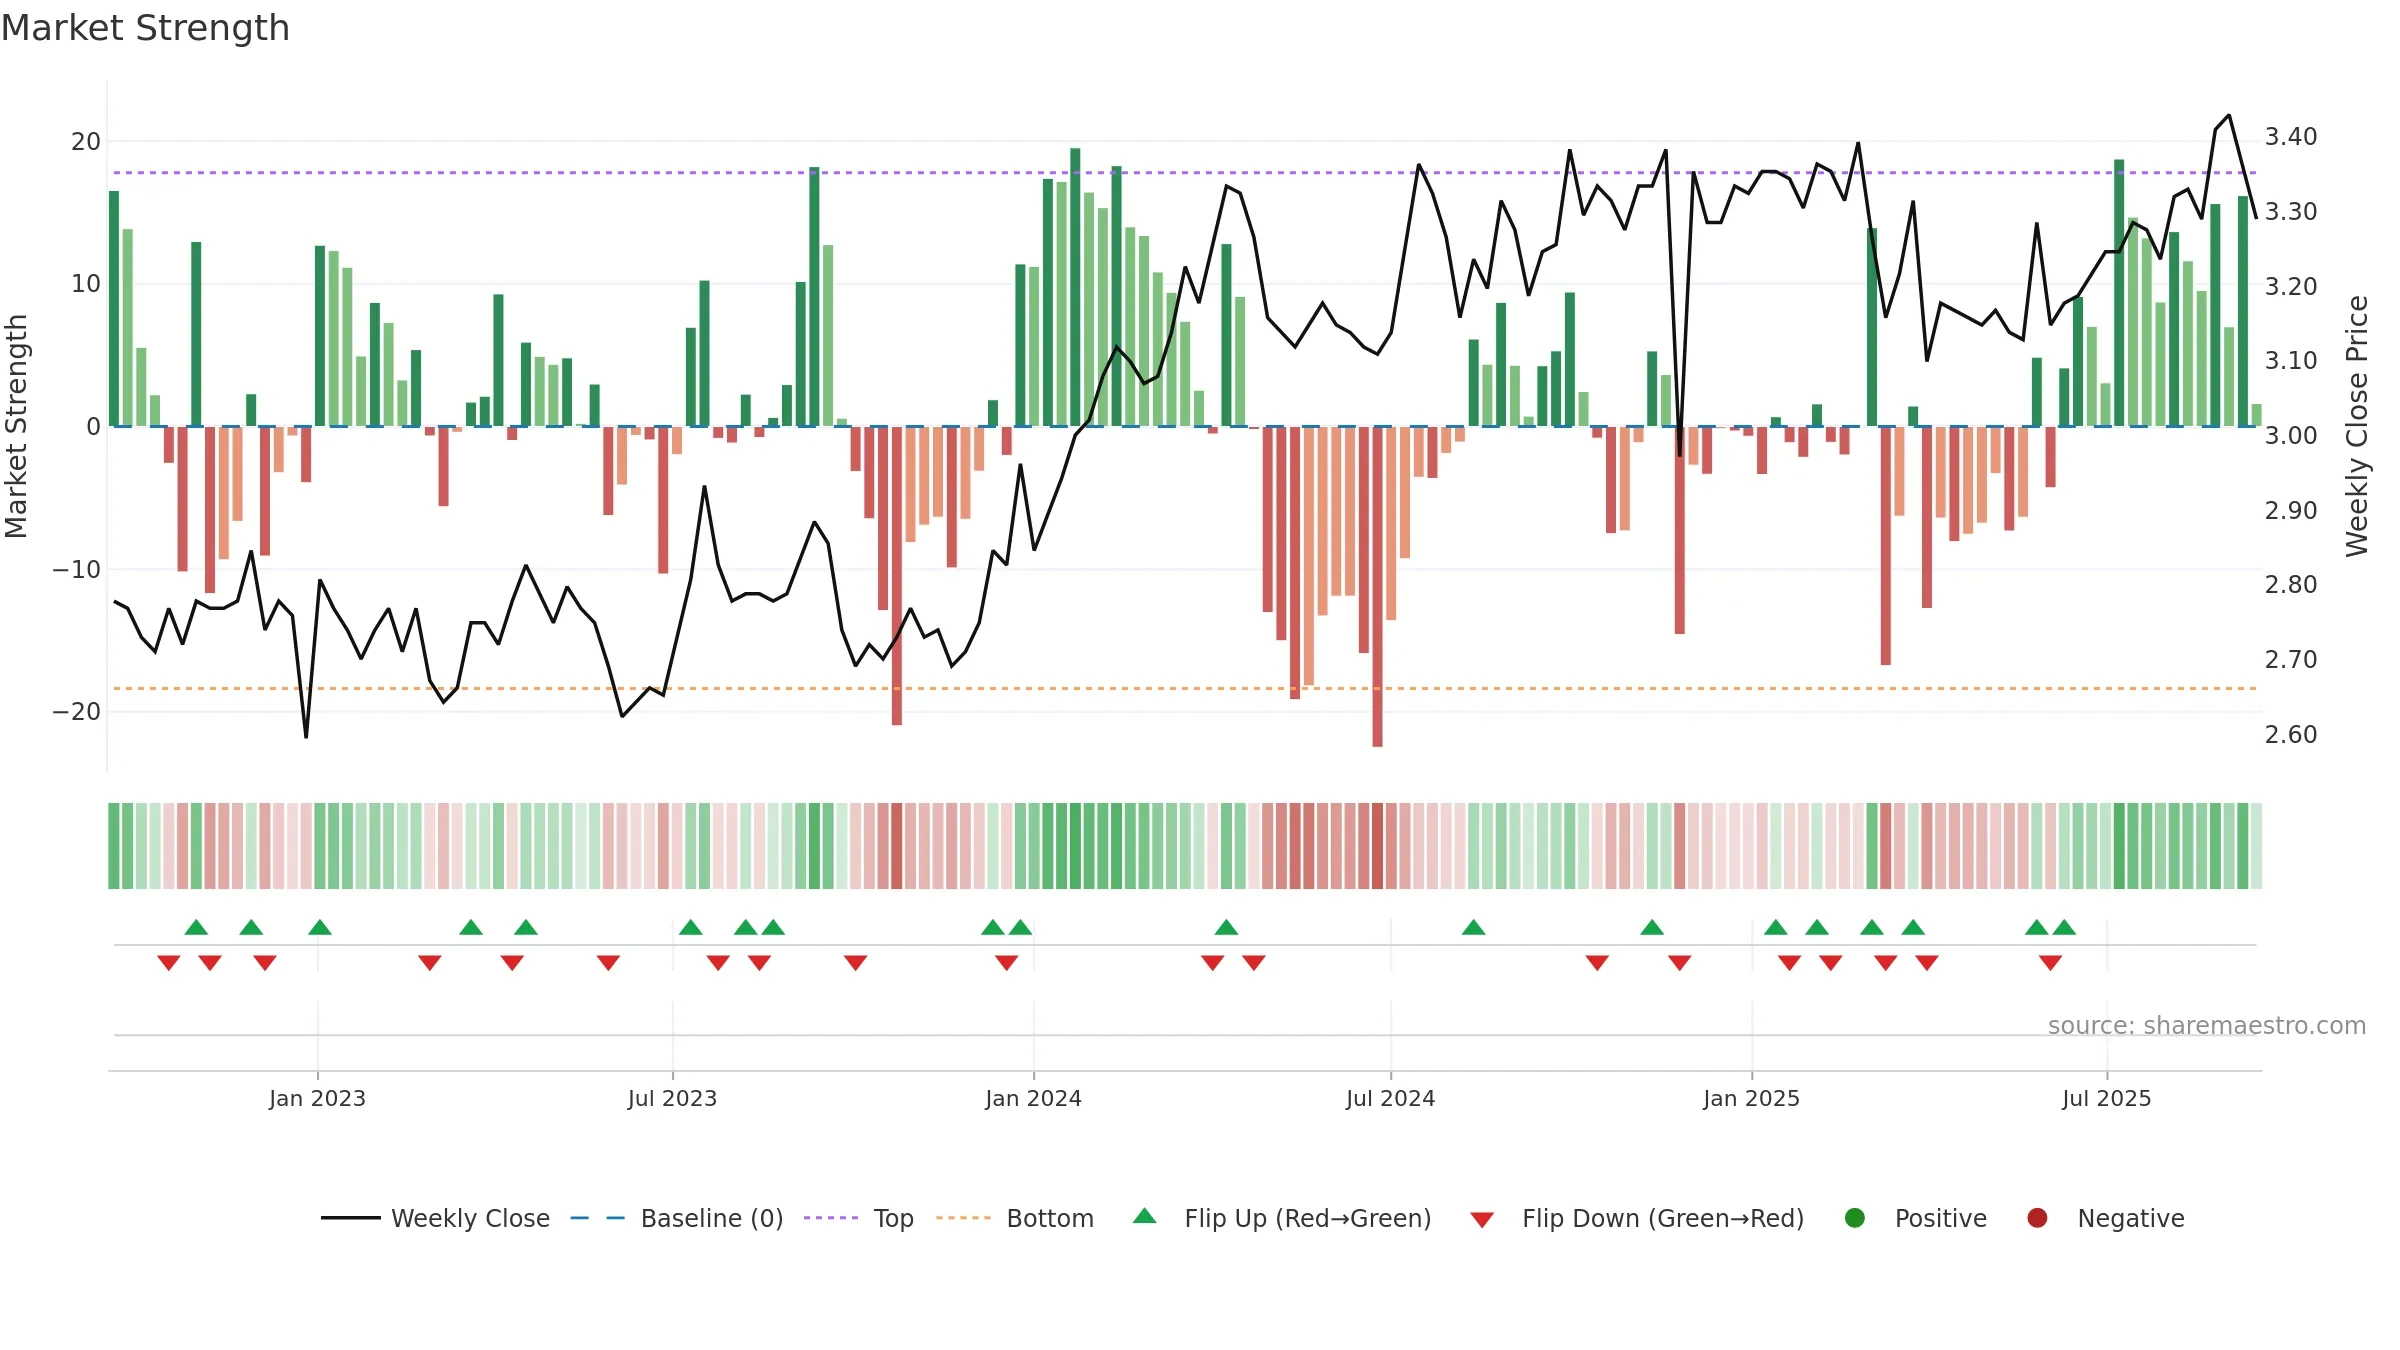
How to read this — Price slope is upward, indicating persistent buying over the window. Low weekly volatility favours steadier follow-through. Volume trend diverges from price — watch for fatigue or rotation. Constructive MA stack supports the up-drift; pullbacks may find support at the 8–13 week region.
Up-slope supports buying interest; pullbacks may be contained if activity stays firm. Because liquidity isn’t confirming, prefer evidence of fresh demand before chasing moves.
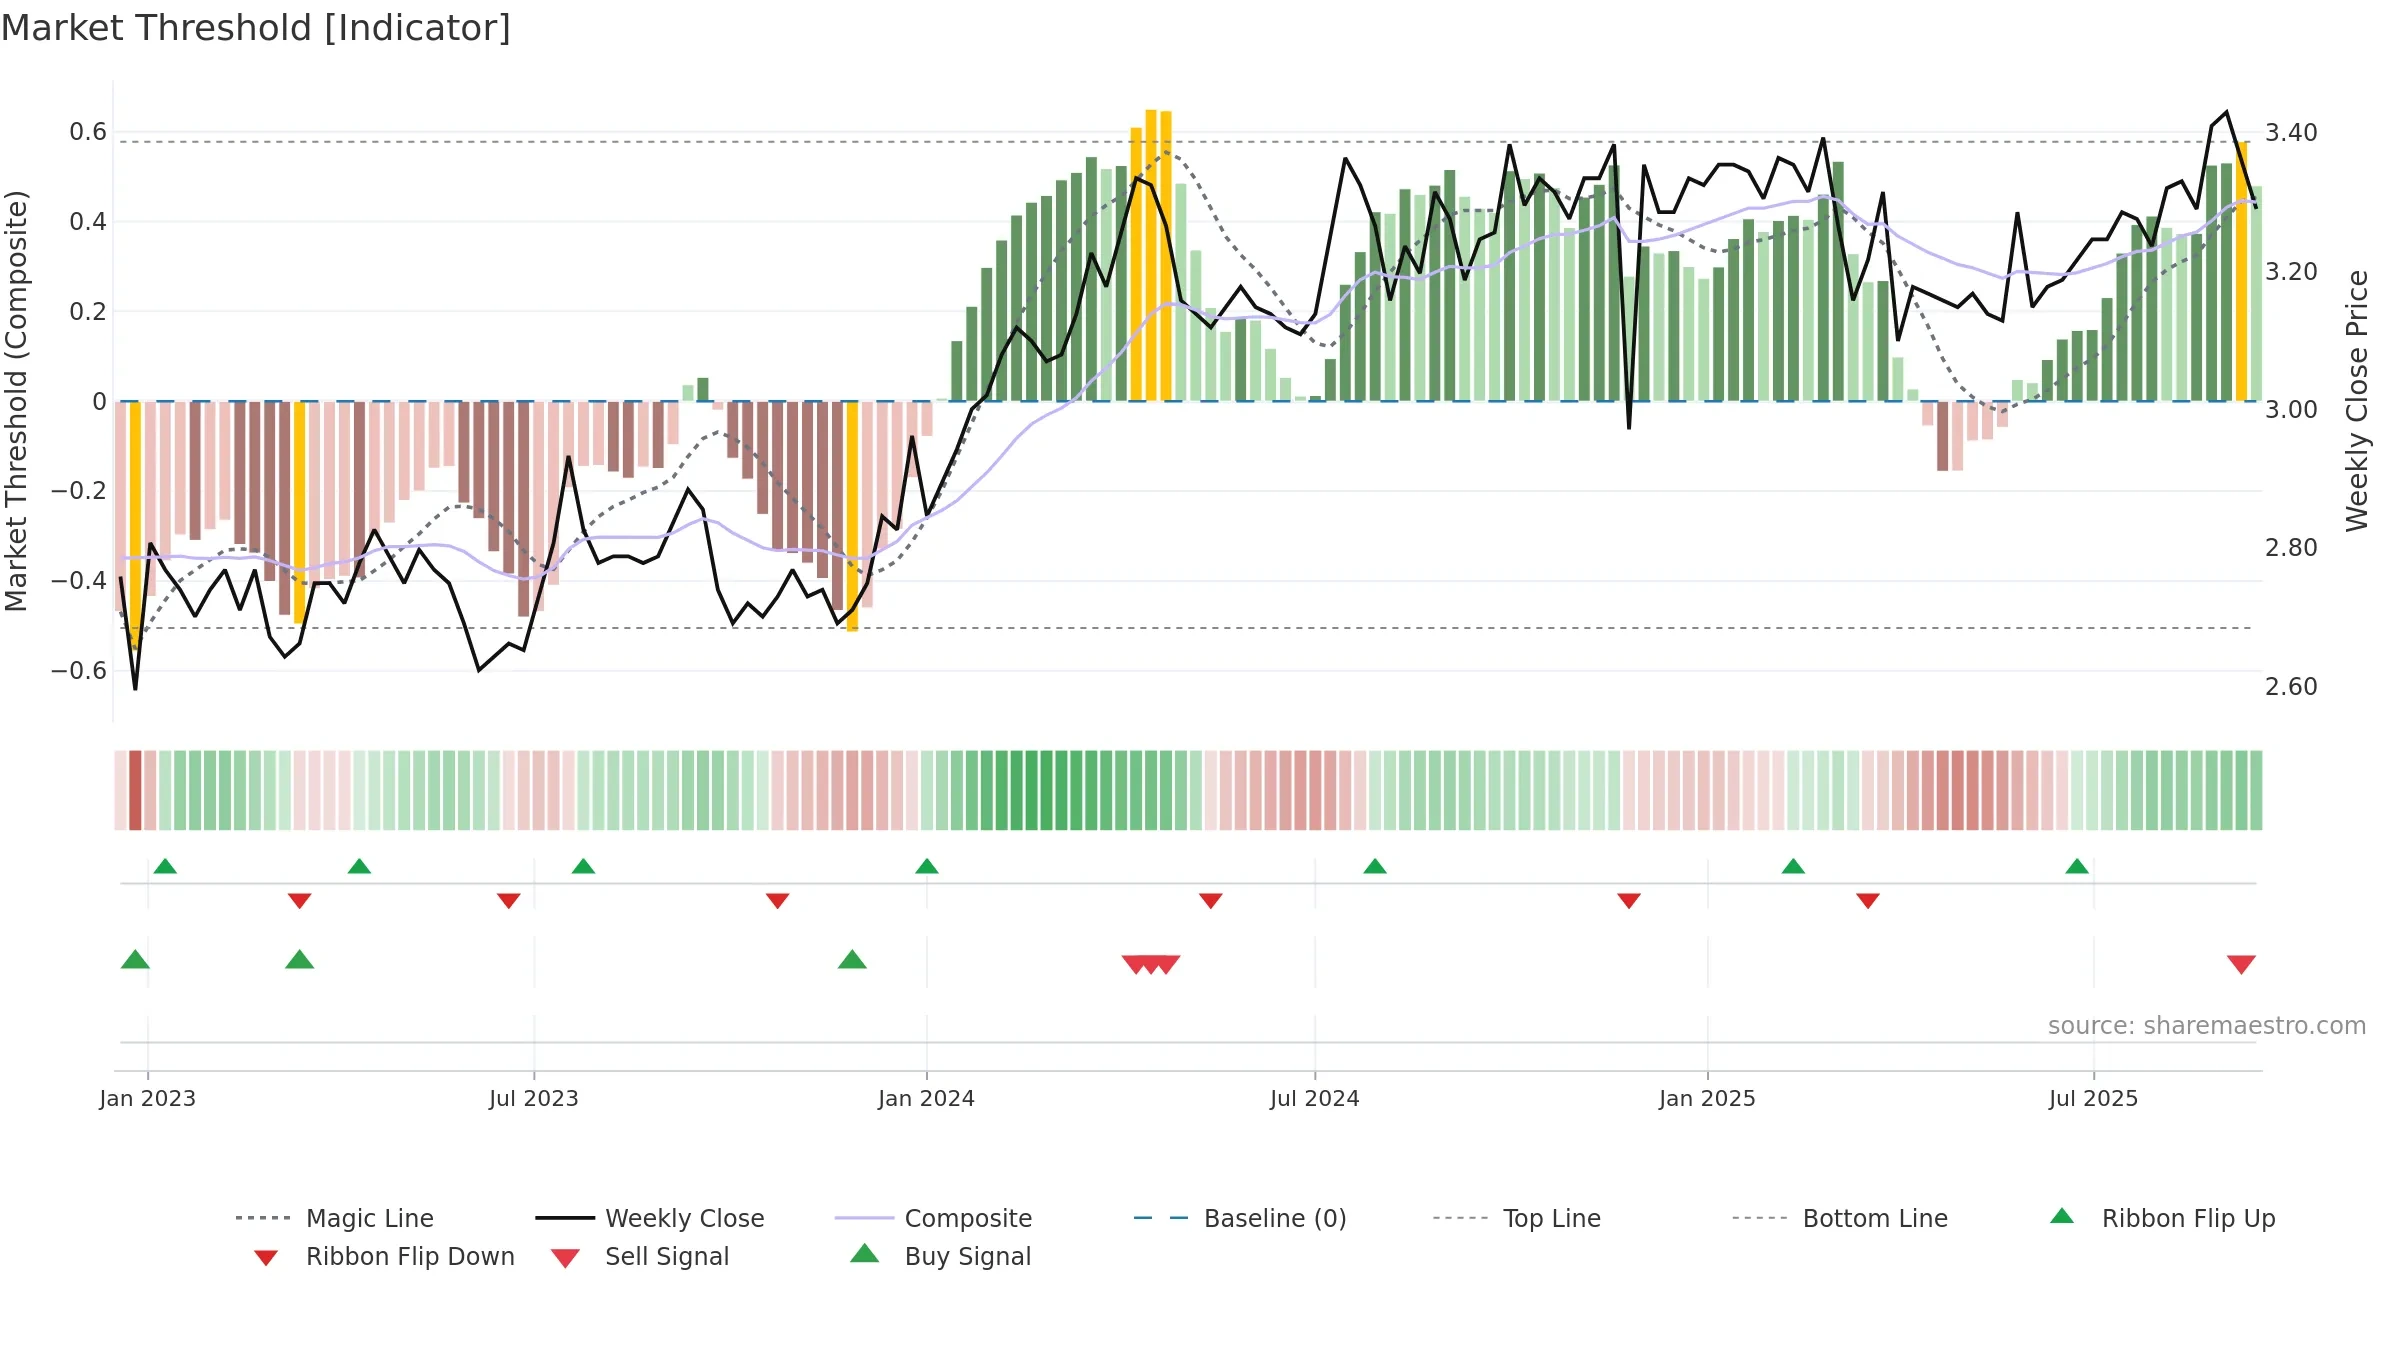
Gauge maps the trend signal to a 0–100 scale.
How to read this — Range-bound conditions; conviction is limited until a break or acceleration emerges.
Wait for a directional break or improving acceleration.
Price is above fair value; upside may be capped without catalysts.
Conclusion
Neutral setup. ★★★☆☆ confidence. Price window: 1. Trend: Range / Neutral; gauge 51. In combination, liquidity diverges from price.
- Constructive moving-average stack
- Low return volatility supports durability
- Price is not above key averages
- Liquidity diverges from price
Why: Price window 1.66% over 8w. Close is -4.08% below the prior-window high. Return volatility 1.12%. Volume trend falling. Liquidity divergence with price. Trend state range / neutral. MA stack constructive. Momentum neutral and rising. Valuation limited upside without catalysts.
Tip: Most metrics include a hover tooltip where they appear in the report.