Magnachip Semiconductor Corporation
MX NYSE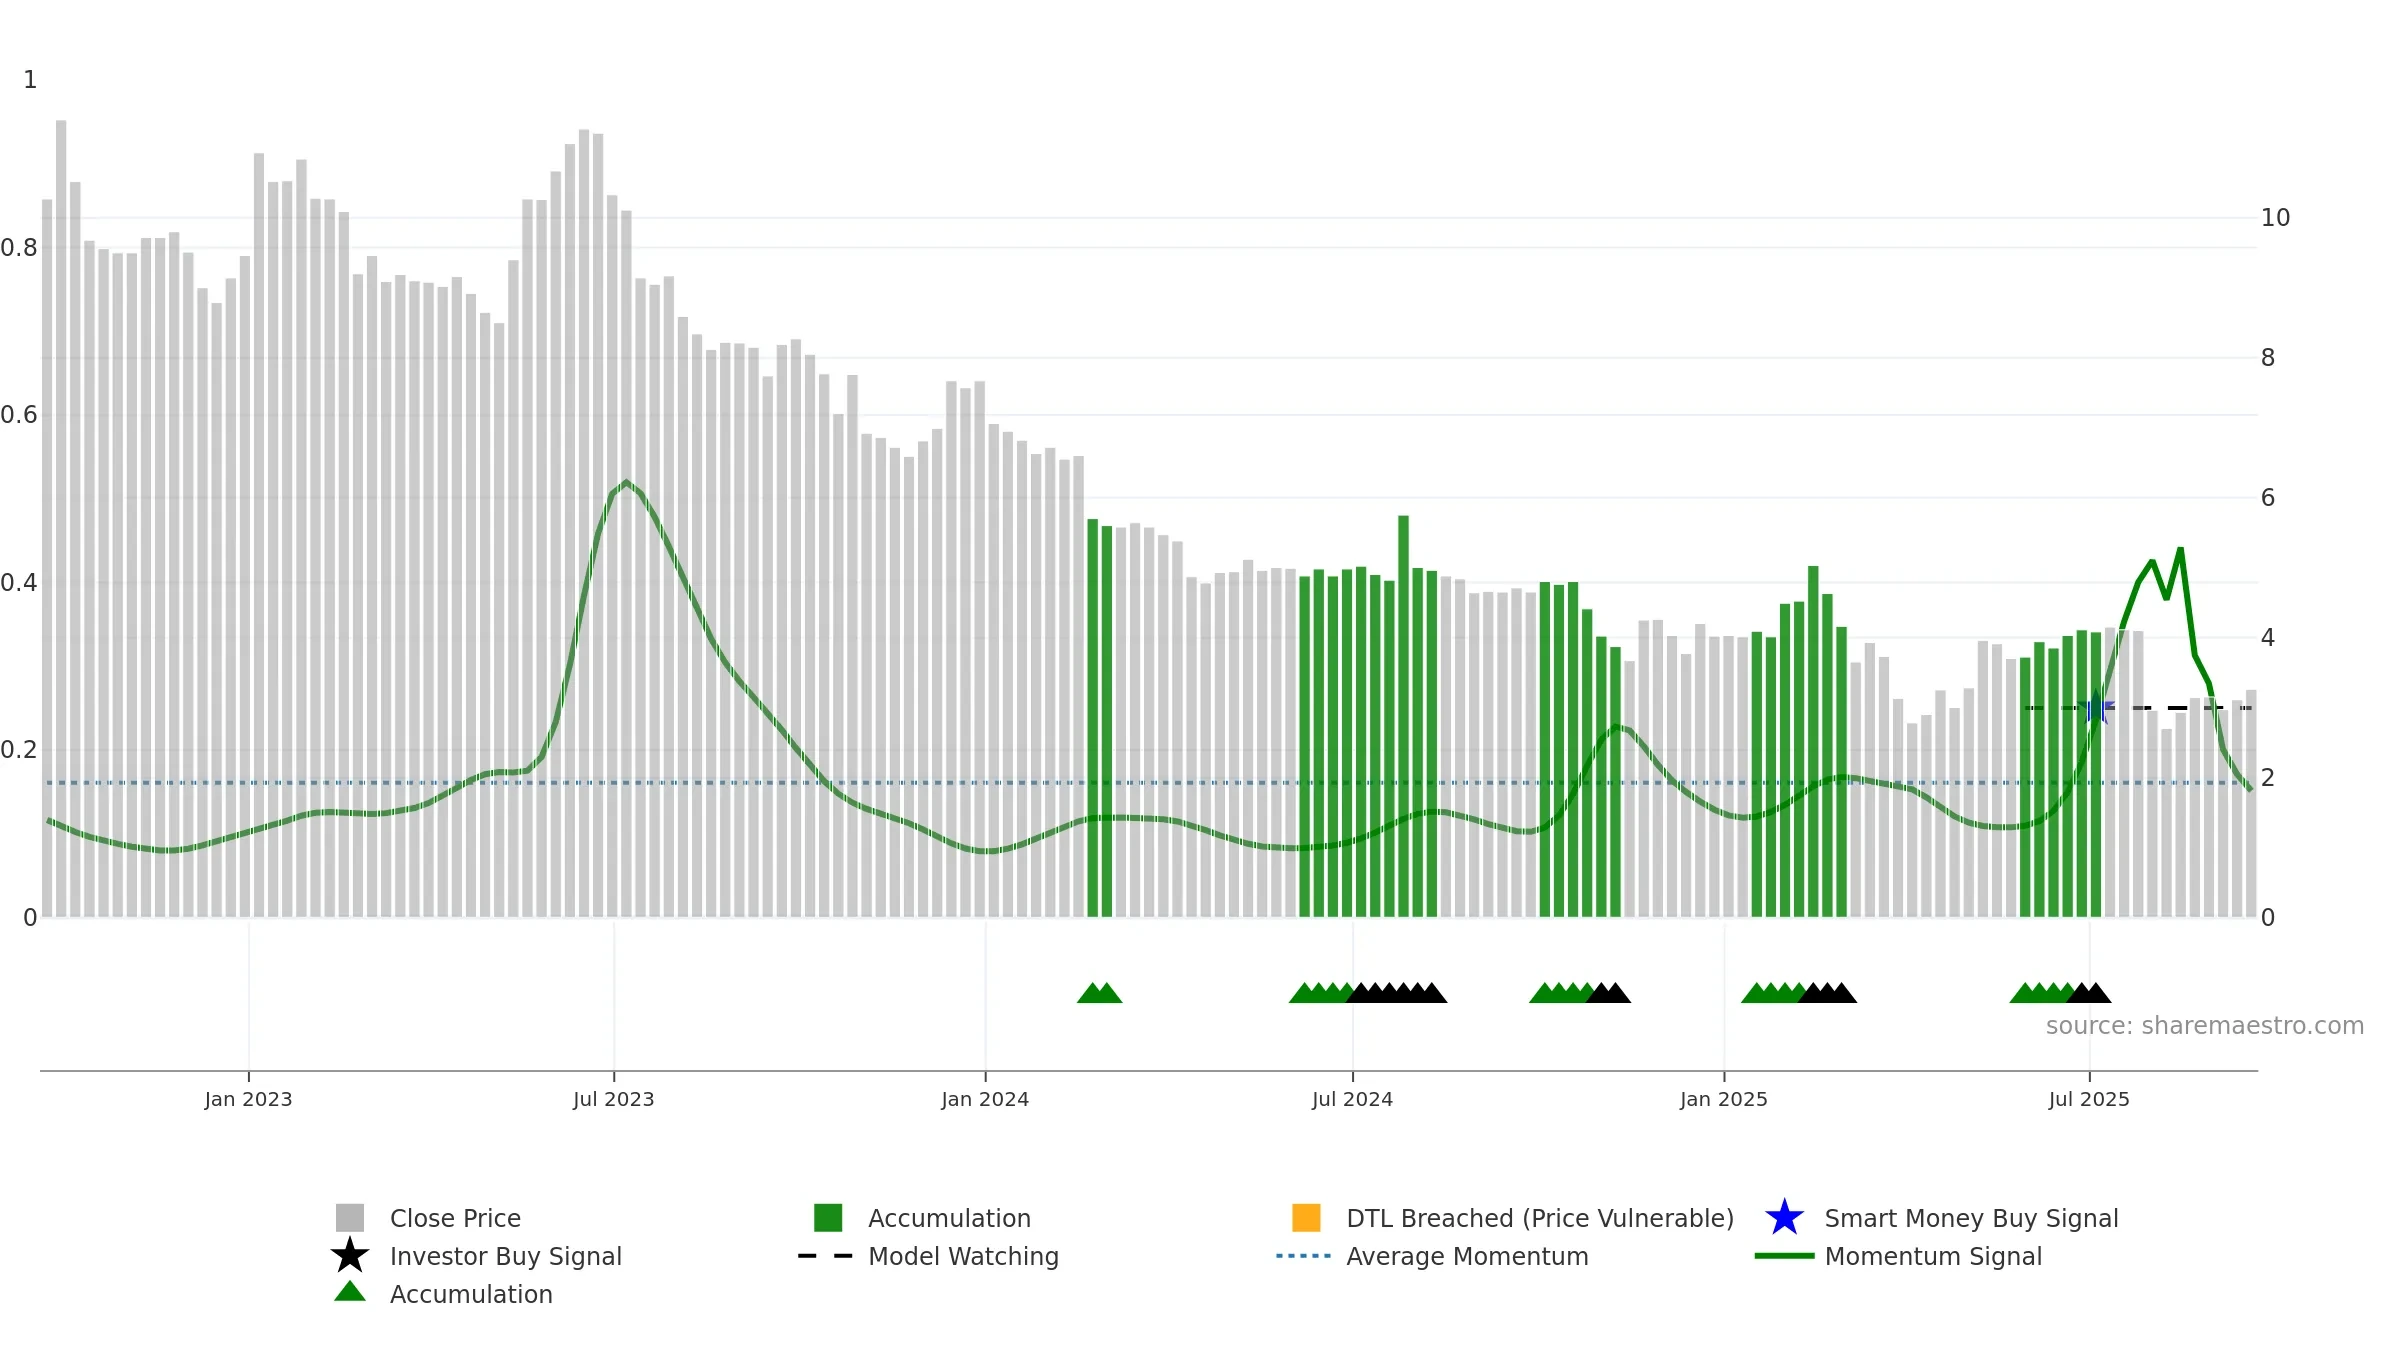
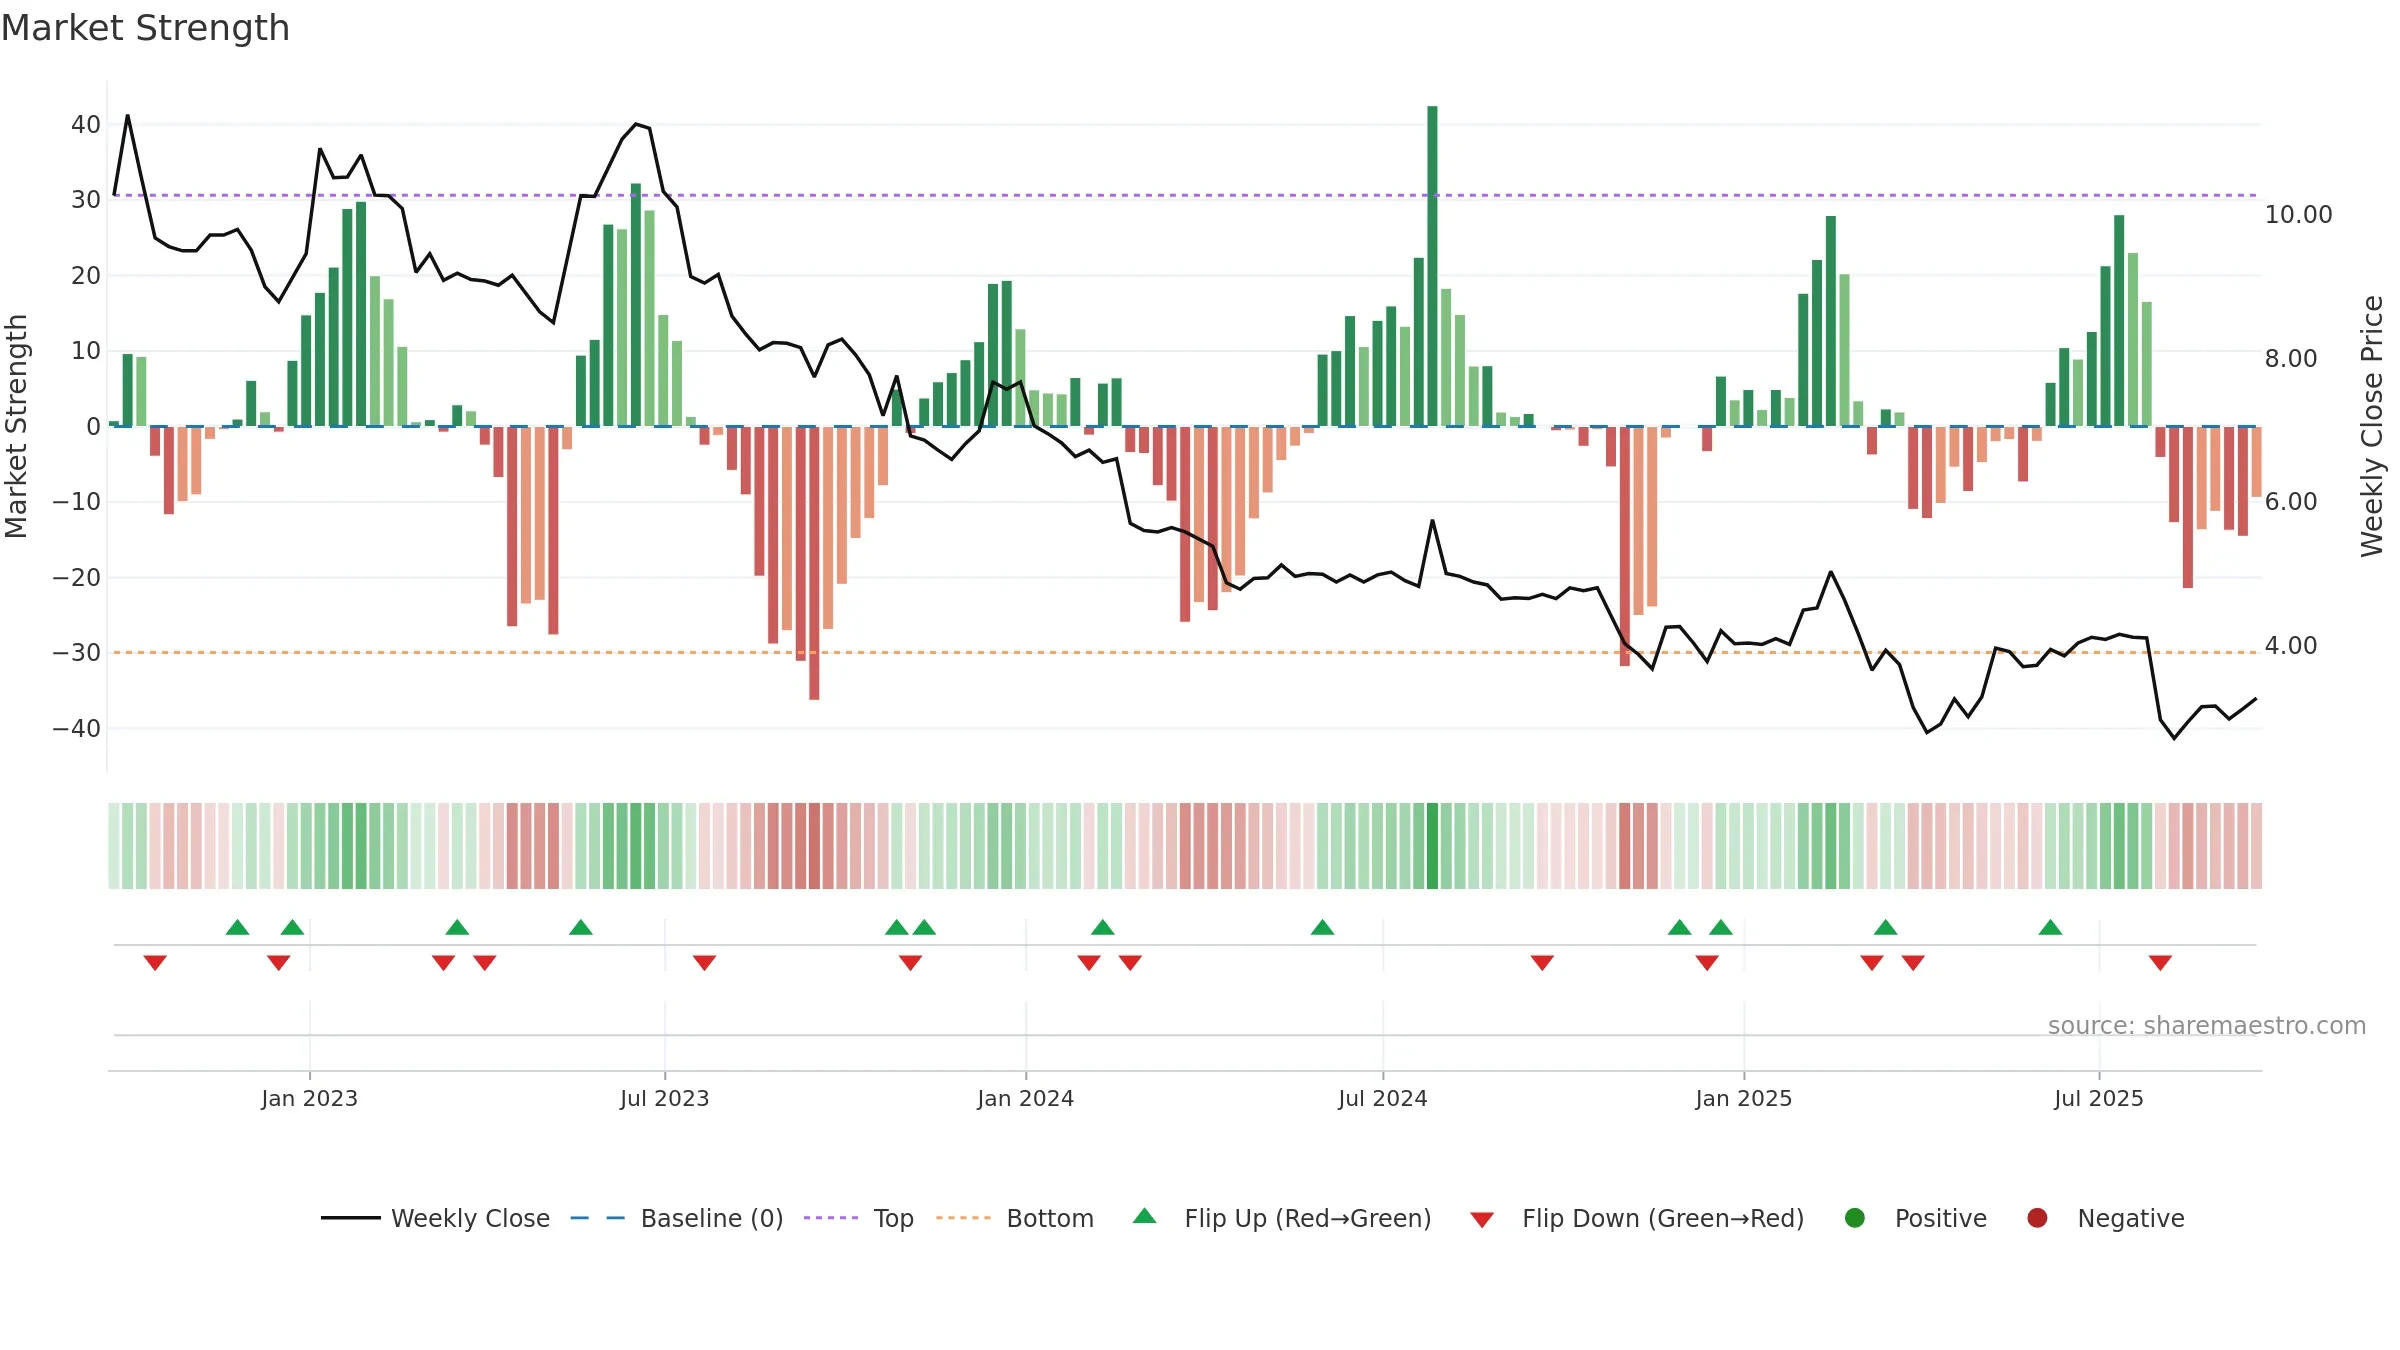
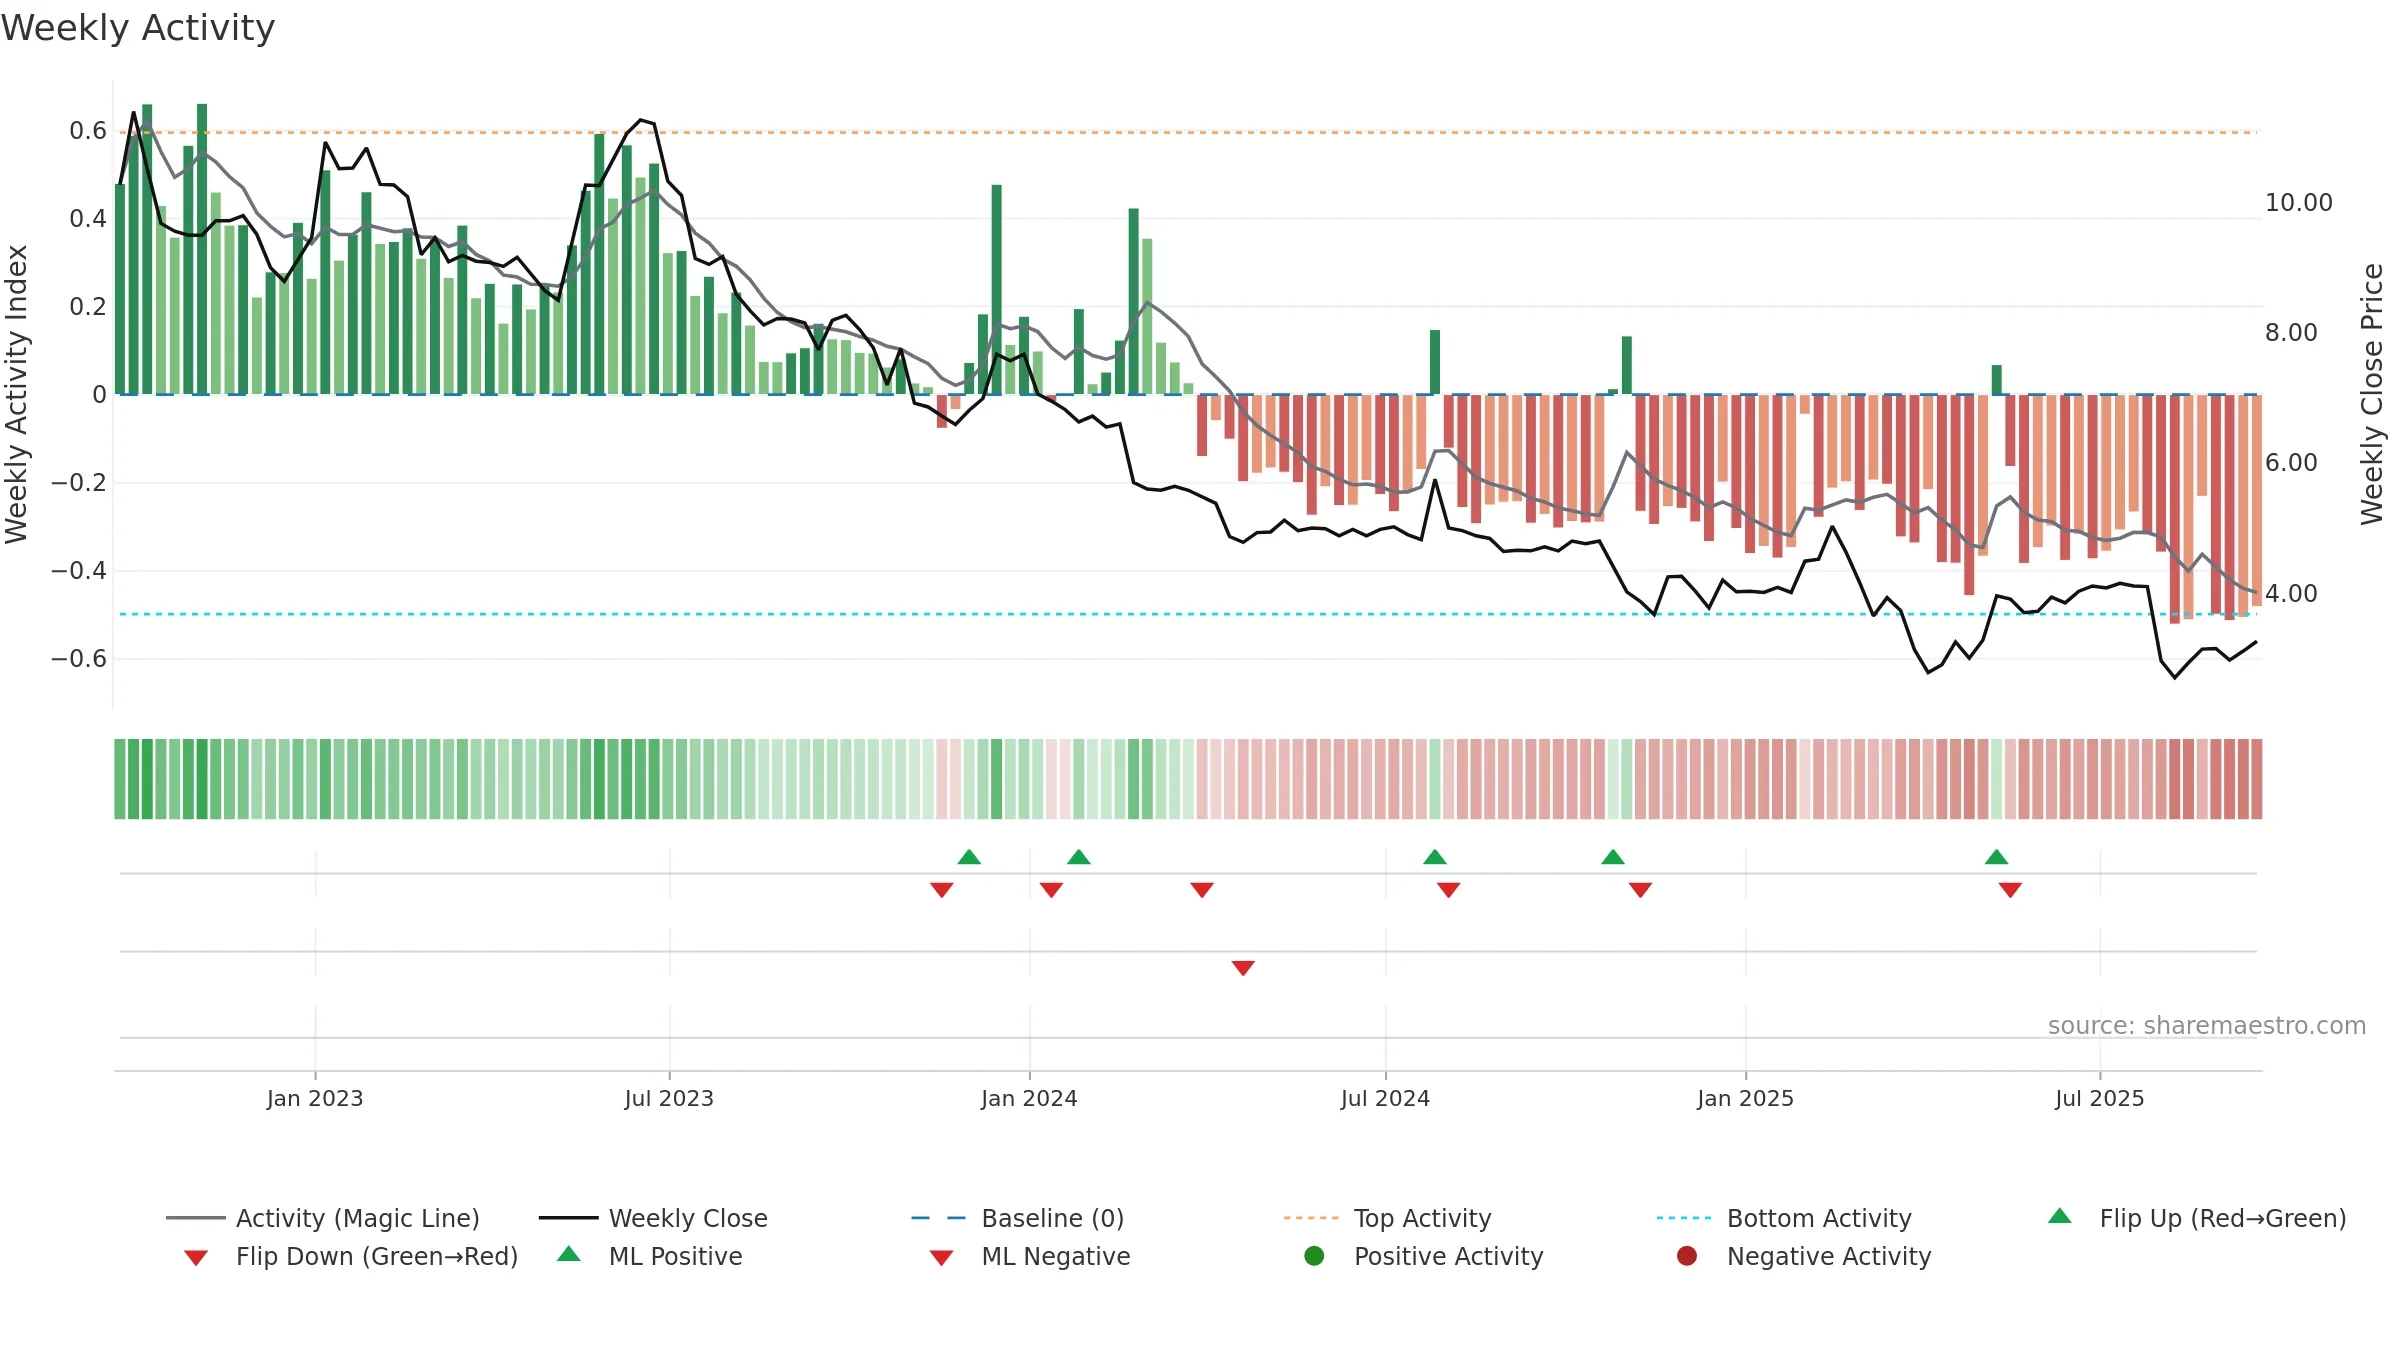
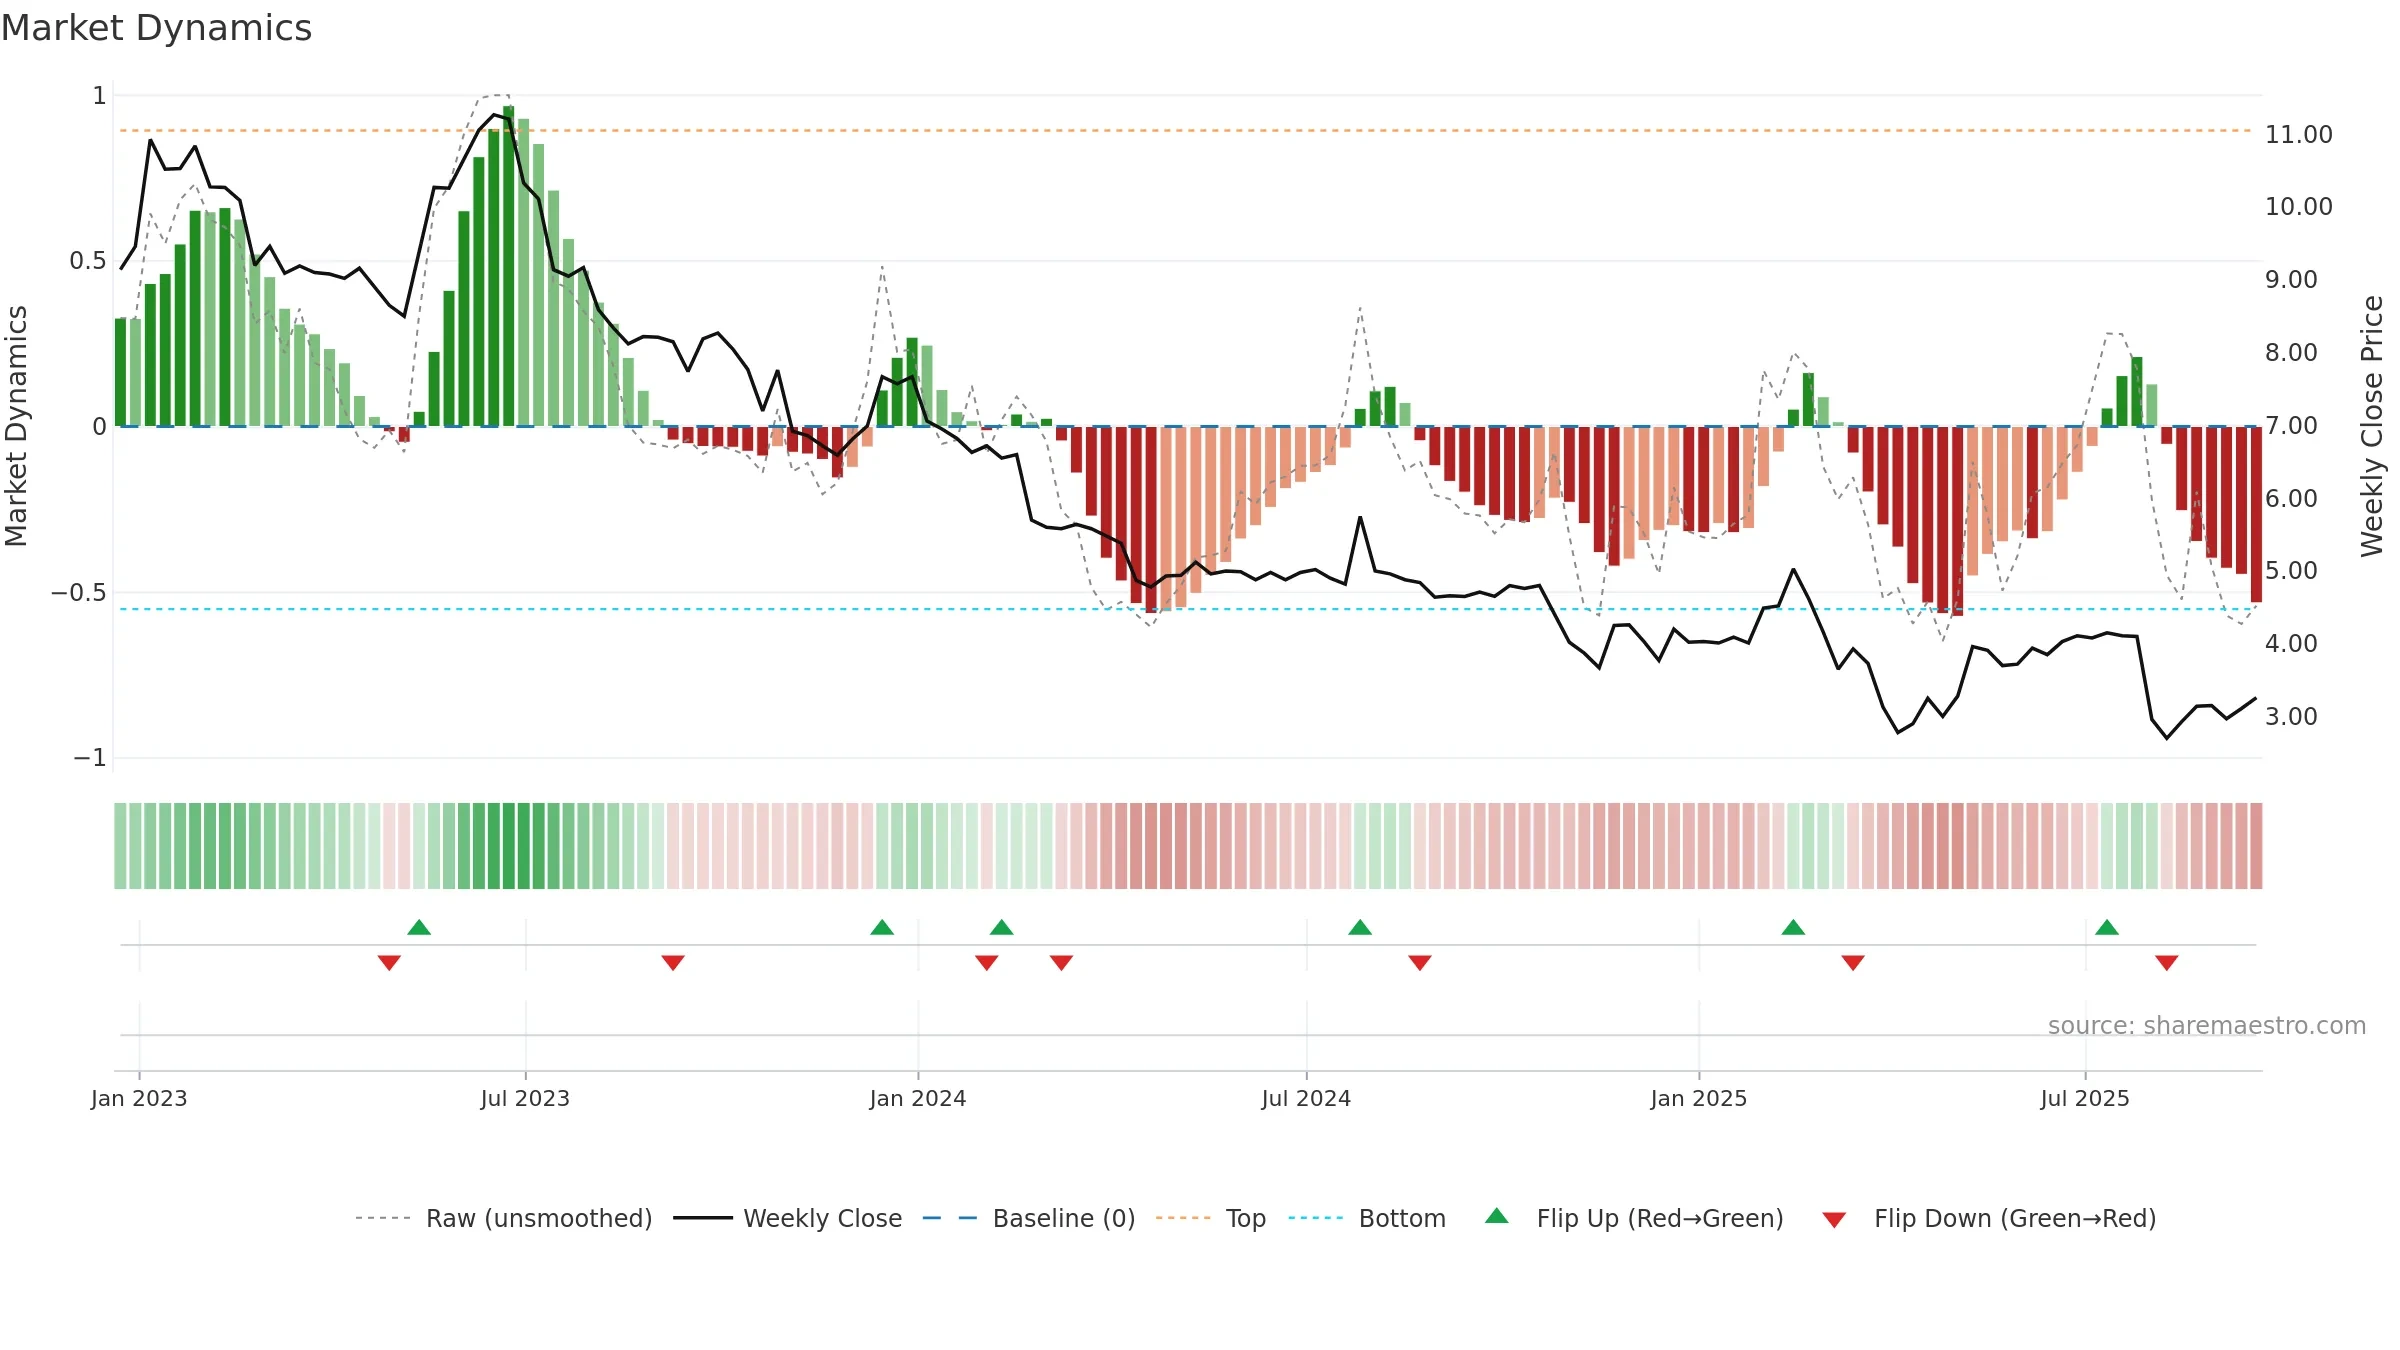
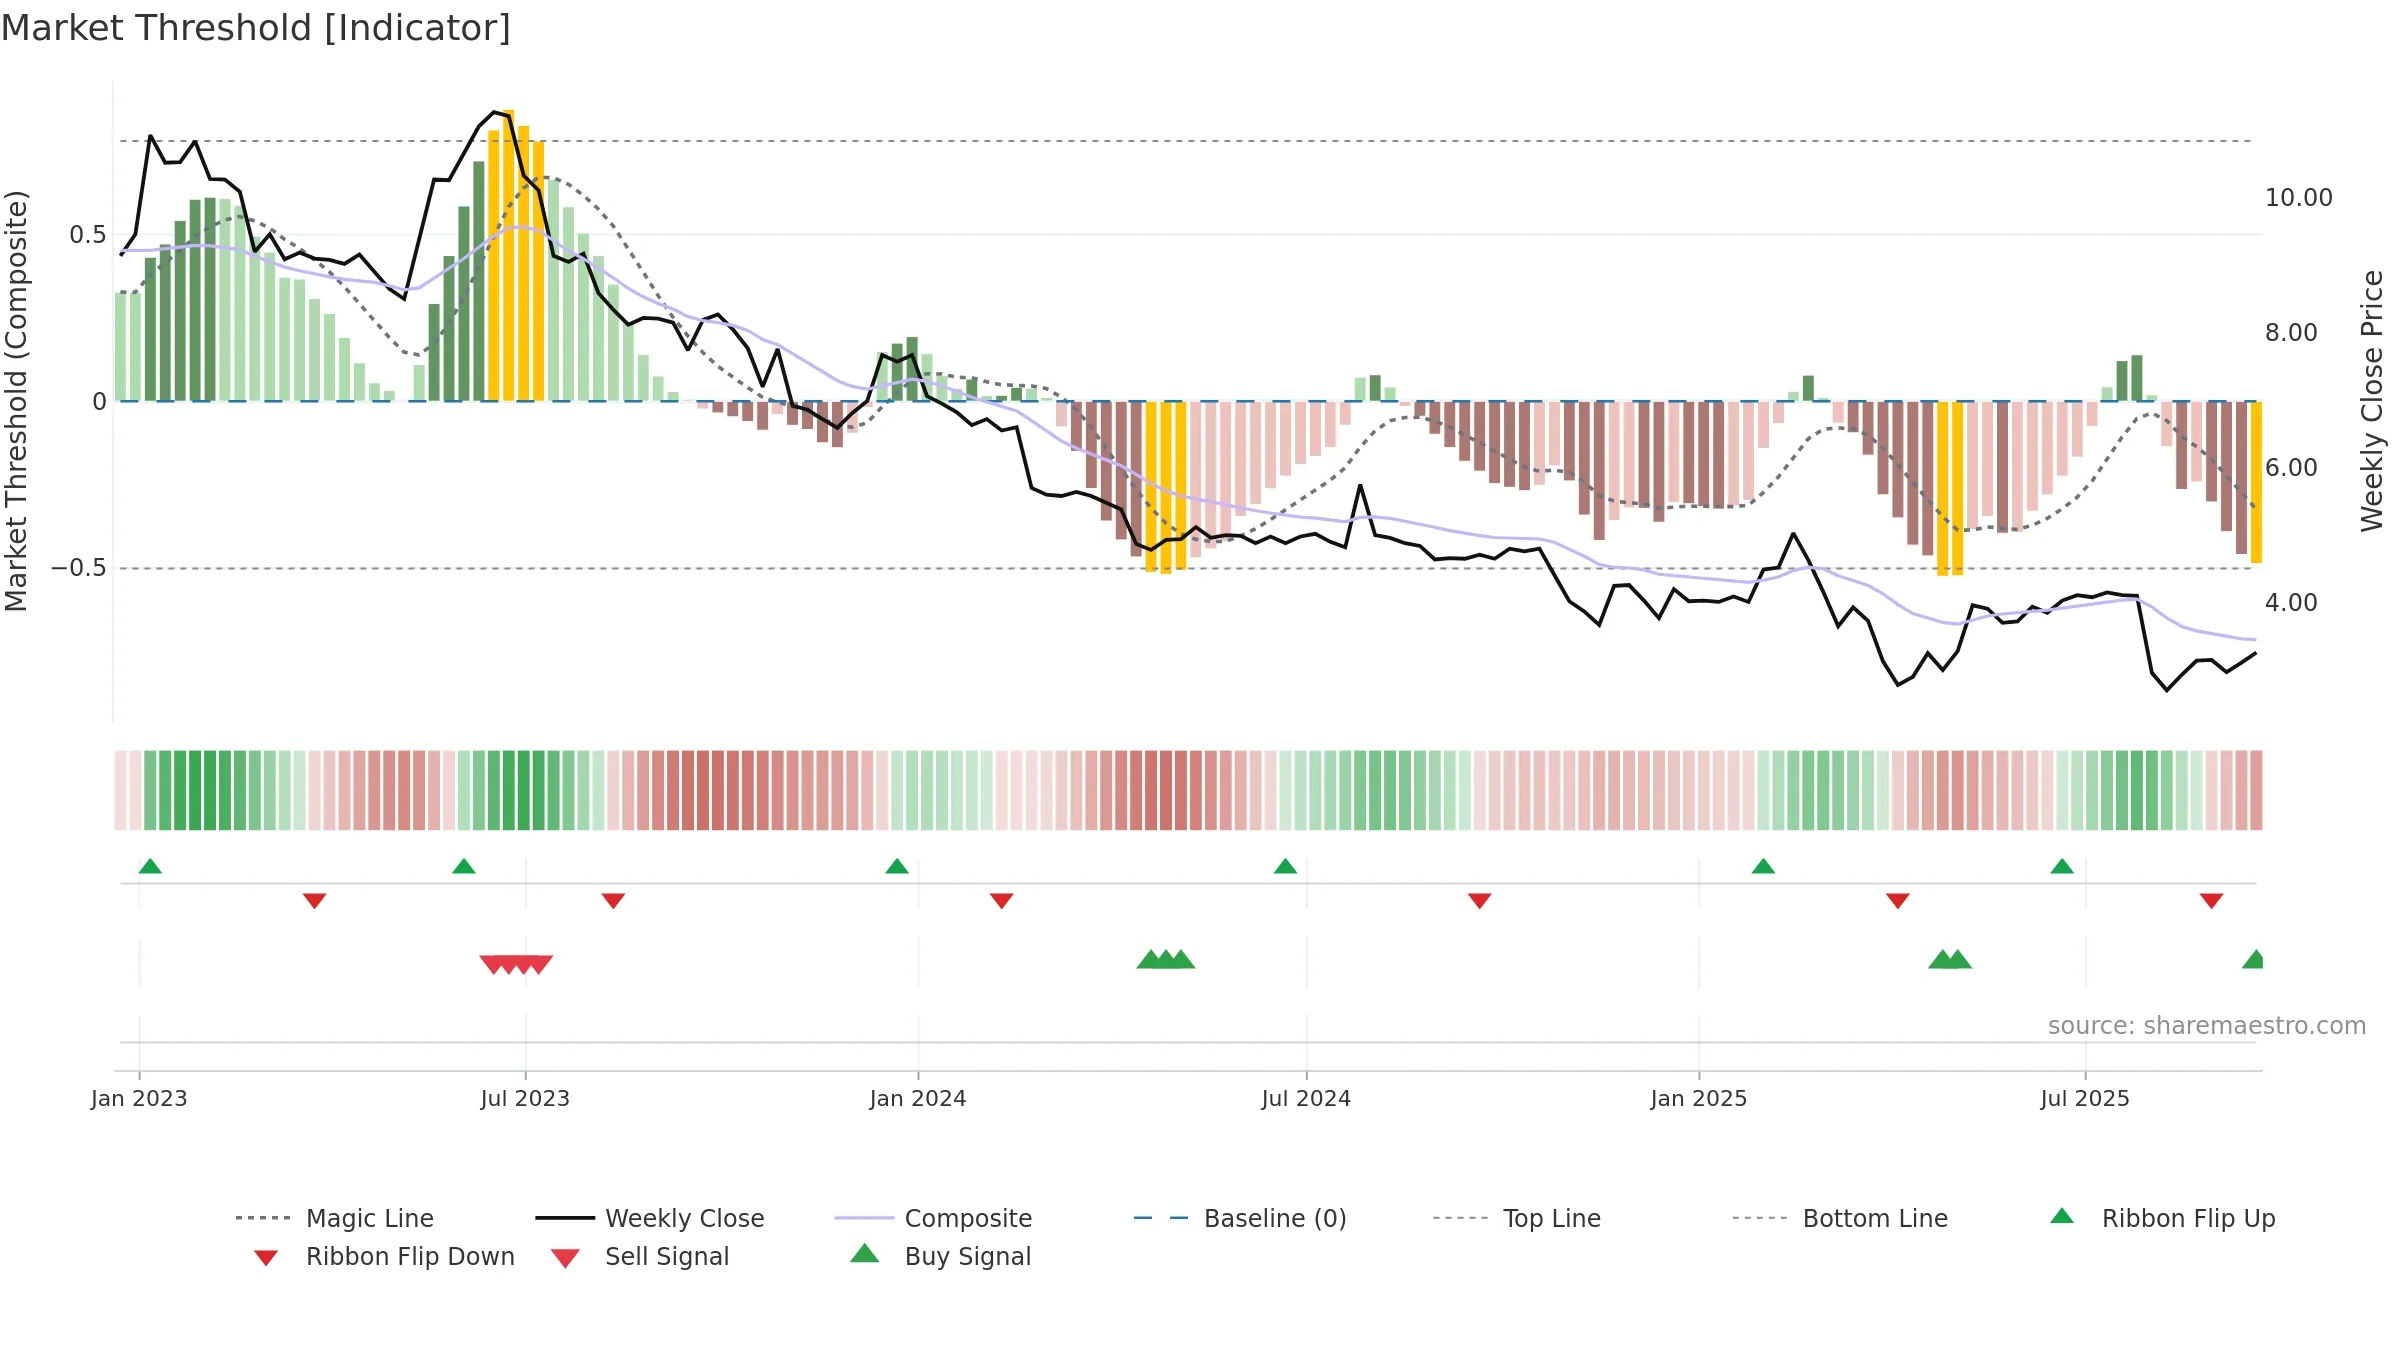
Weekly Summary
Magnachip Semiconductor Corporation closed at 3.2600 (-2.69% WoW) . Data window ends Fri, 19 Sep 2025.
How to read this — Price slope is upward, indicating persistent buying over the window. Elevated weekly volatility increases whipsaw risk. Volume trend diverges from price — watch for fatigue or rotation. Returns are positively correlated with volume — strength tends to arrive on higher activity. Fresh short-term crossover improves near-term tone.
Up-slope supports buying interest; pullbacks may be contained if activity stays firm. Because liquidity isn’t confirming, prefer evidence of fresh demand before chasing moves.
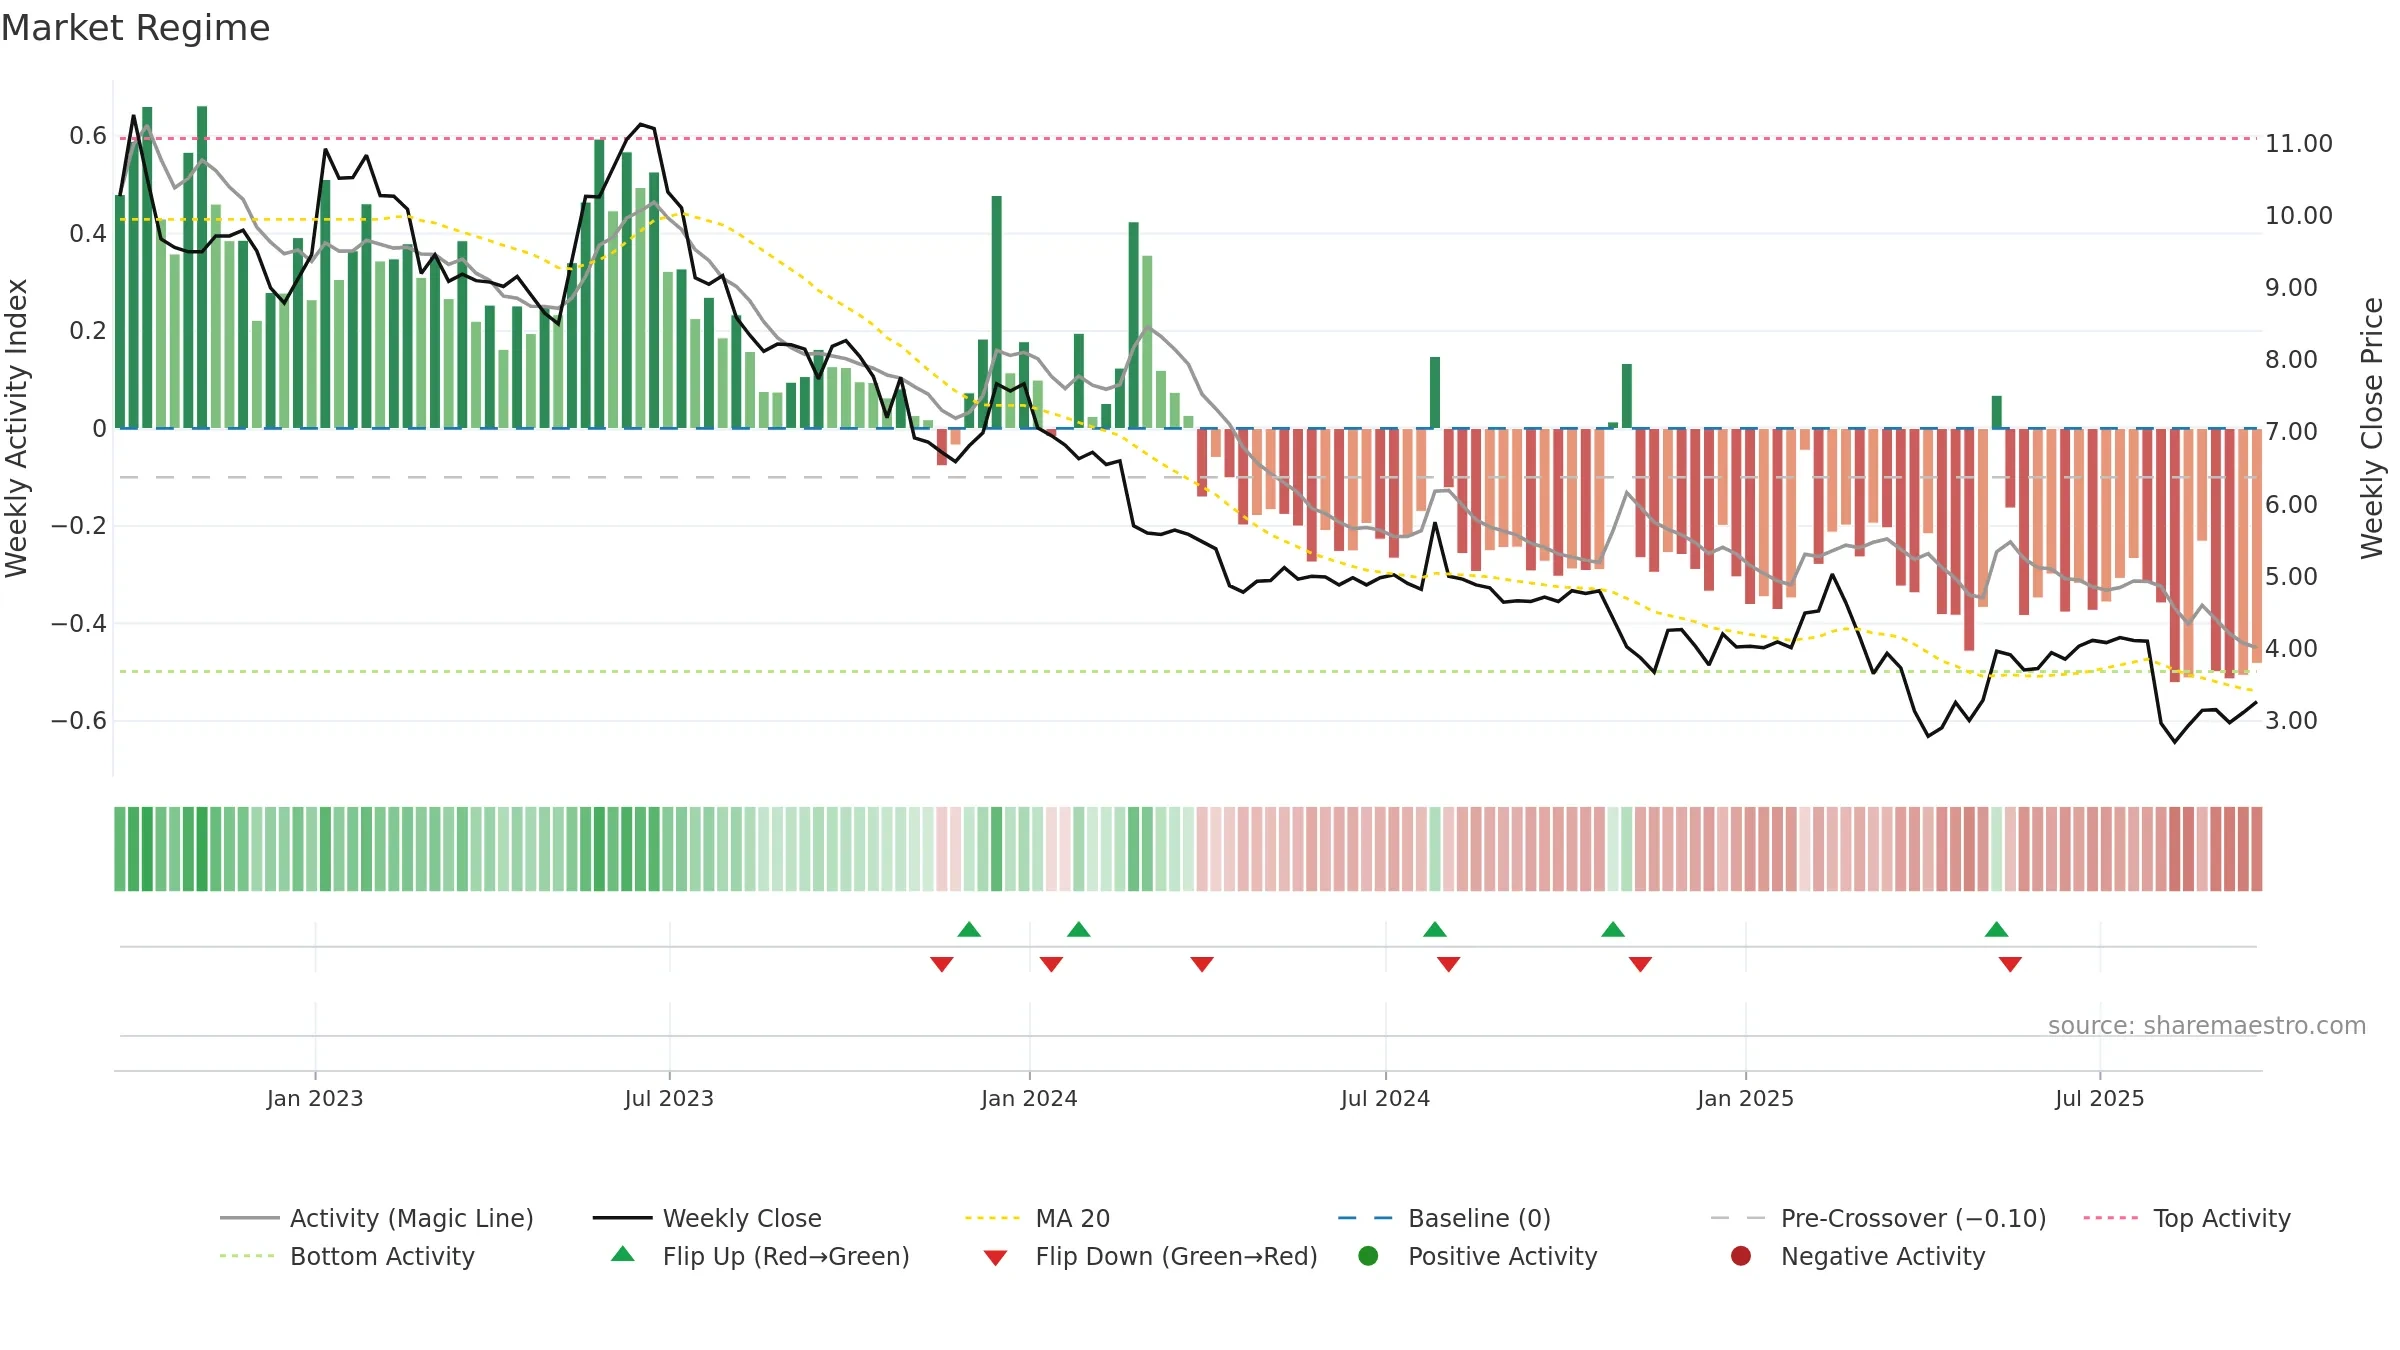
Gauge maps the trend signal to a 0–100 scale.
How to read this — Bearish zone with falling momentum — sellers in control.
Bias remains lower; rallies are suspect unless gauge reclaims 0.50/0.60.

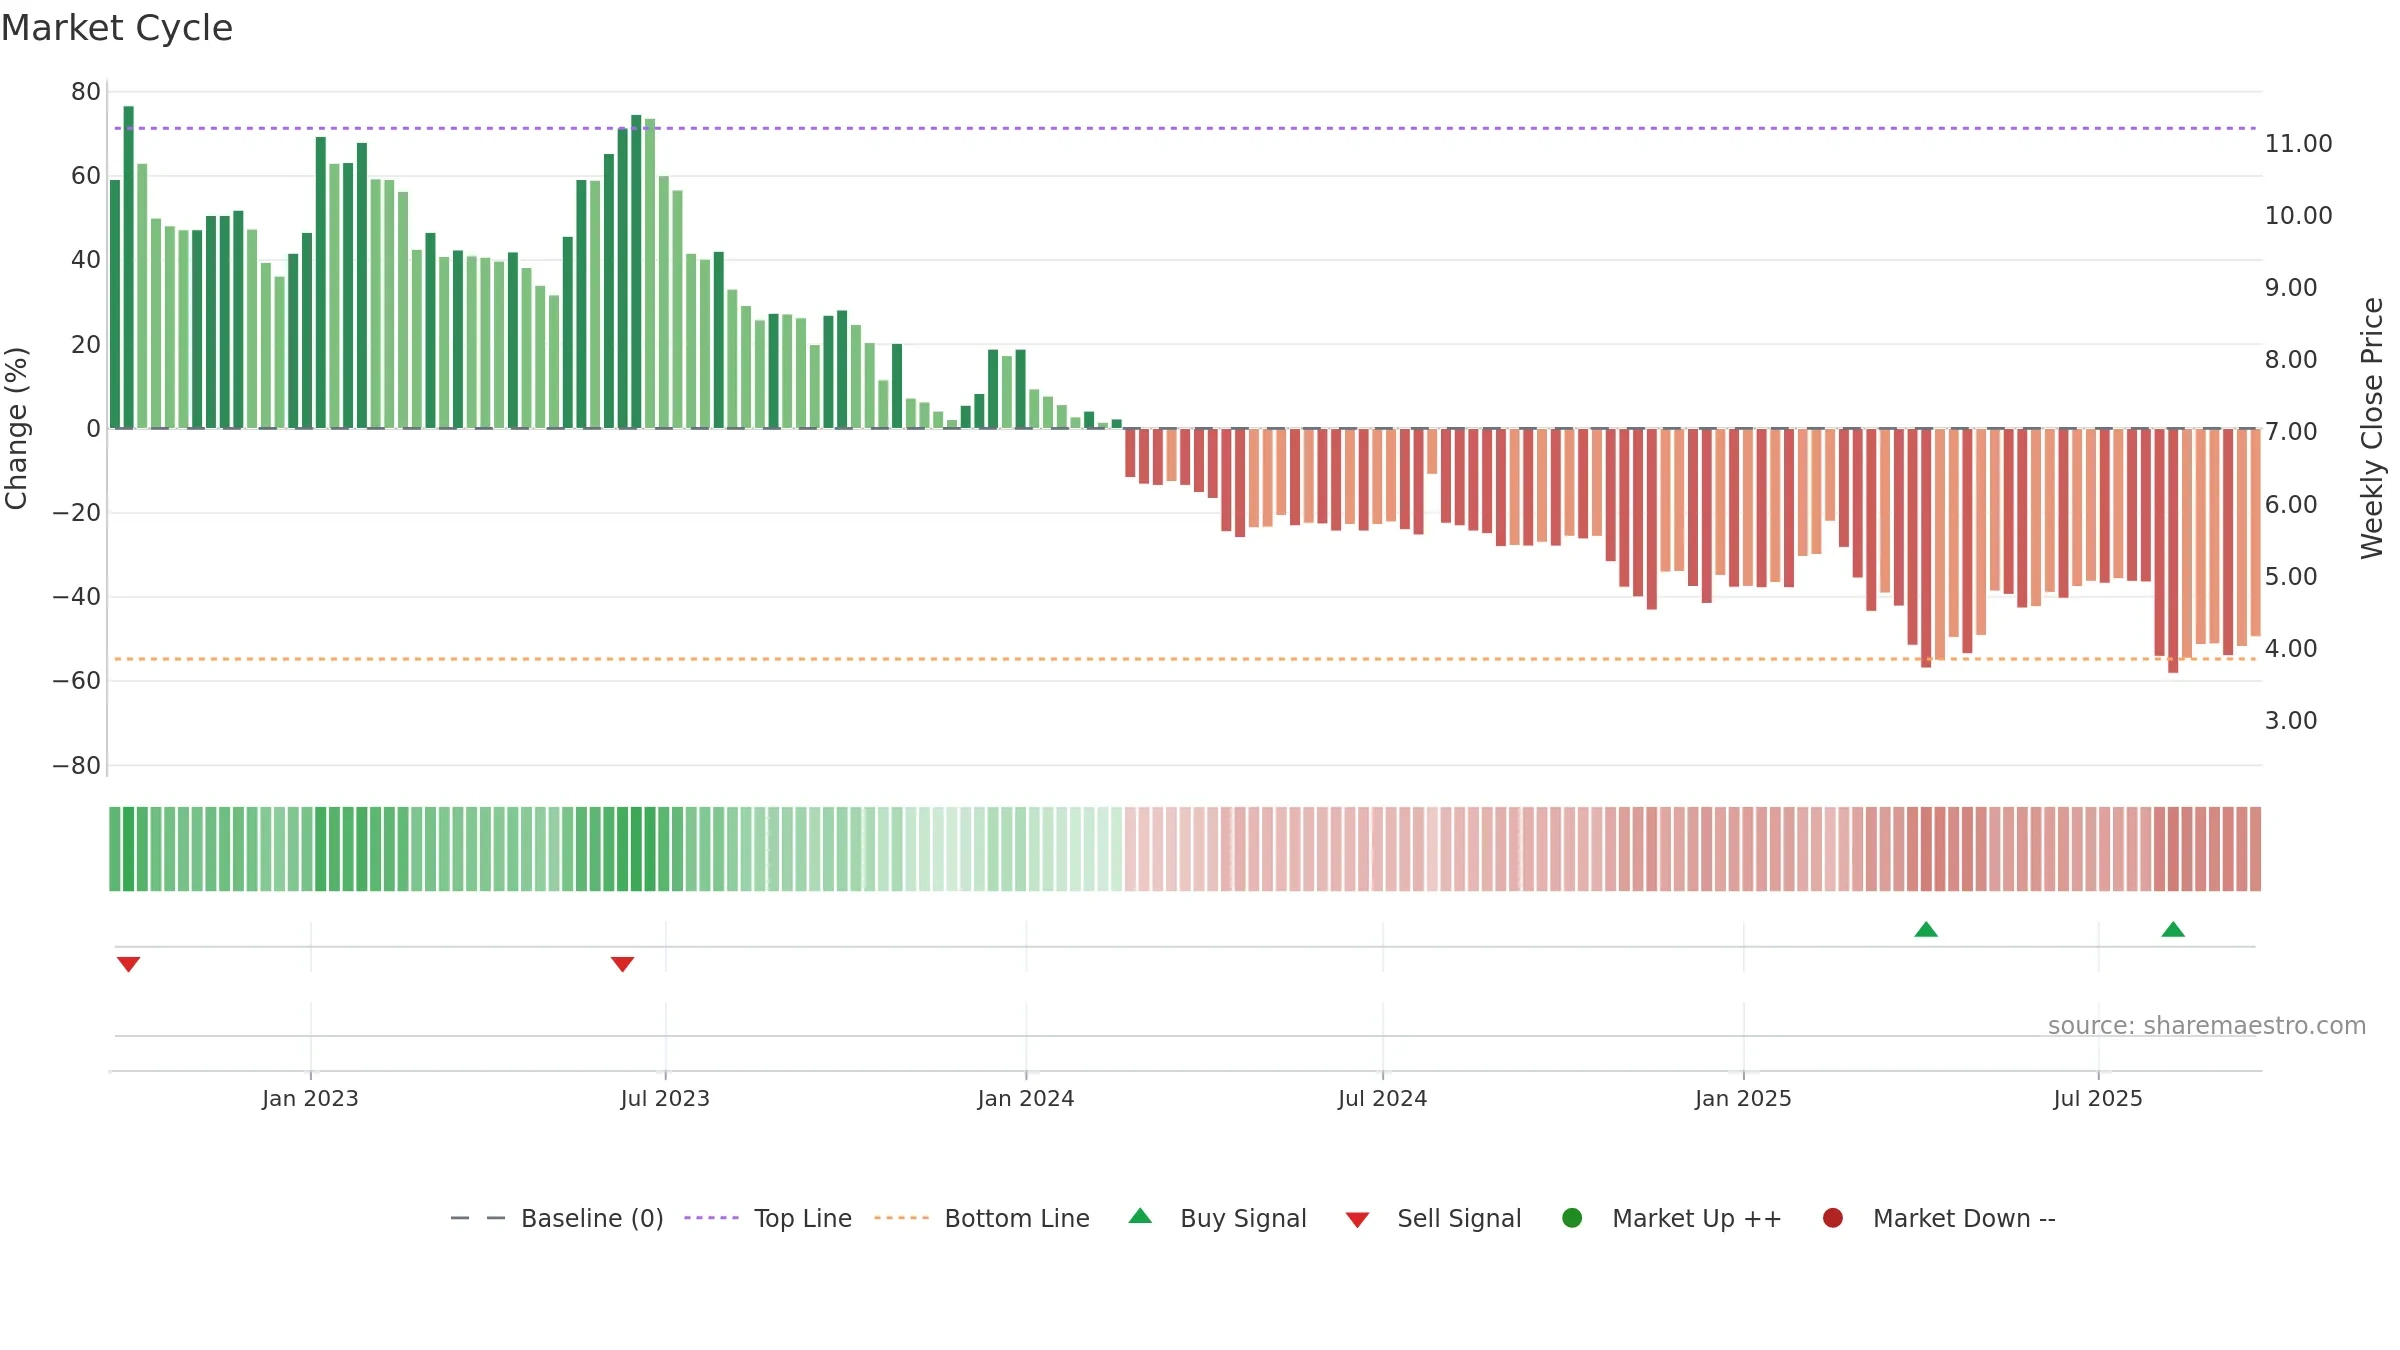
Relative strength is Negative
(< 0%, underperforming).
Latest MRS: -16.06% (week ending Fri, 19 Sep 2025).
Slope: Rising over 8w.
Notes:
- Below zero line indicates relative weakness vs benchmark.
- MRS slope rising over ~8 weeks.
Conclusion
Negative setup. ★☆☆☆☆ confidence. Trend: Downtrend Confirmed · 10.14% over window · vol 5.75% · liquidity divergence · posture mixed
- Solid multi-week performance
- Bearish control with falling momentum
- Momentum is weak/falling
- Price is not above key averages
- Liquidity diverges from price
Why: Price window 10.14% over w. Close is 3.49% above the prior-window high. Return volatility 5.75%. Volume trend falling. Liquidity divergence with price. Trend state downtrend confirmed. 4–8w crossover bullish. Momentum bearish and falling.
Tip: Most metrics include a hover tooltip where they appear in the report.