Rezolute, Inc.
RZLT NASDAQ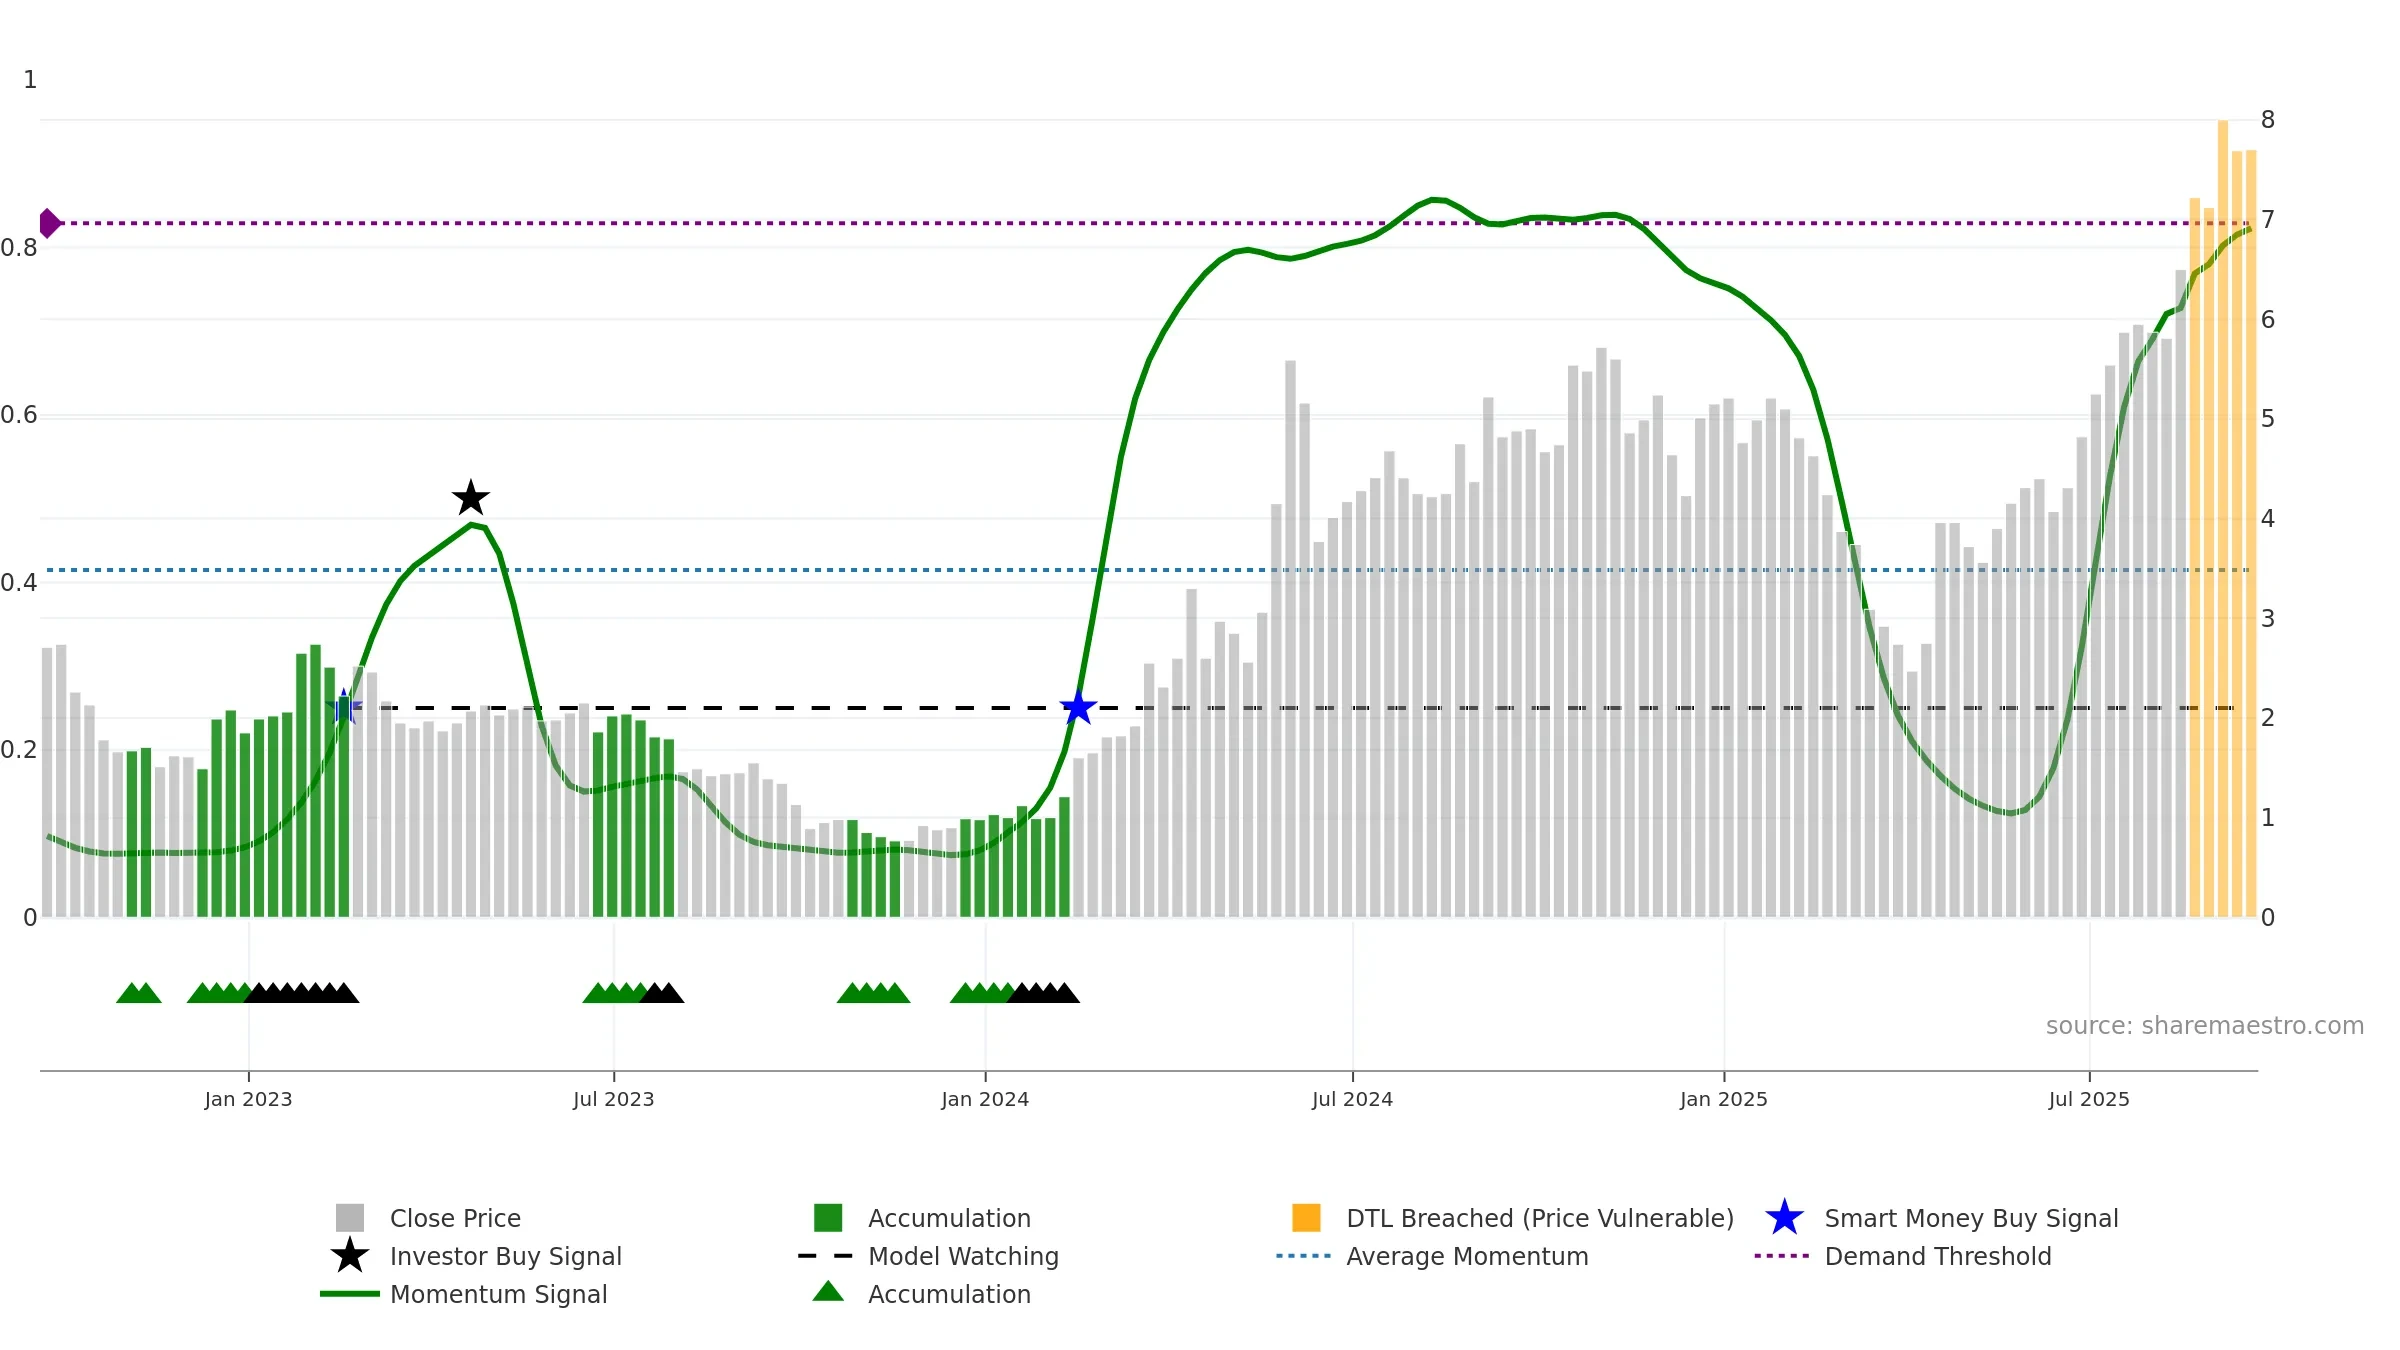
Weekly Report
Rezolute, Inc. closed at 7.7000 (-8.88% WoW) . Data window ends Fri, 19 Sep 2025.
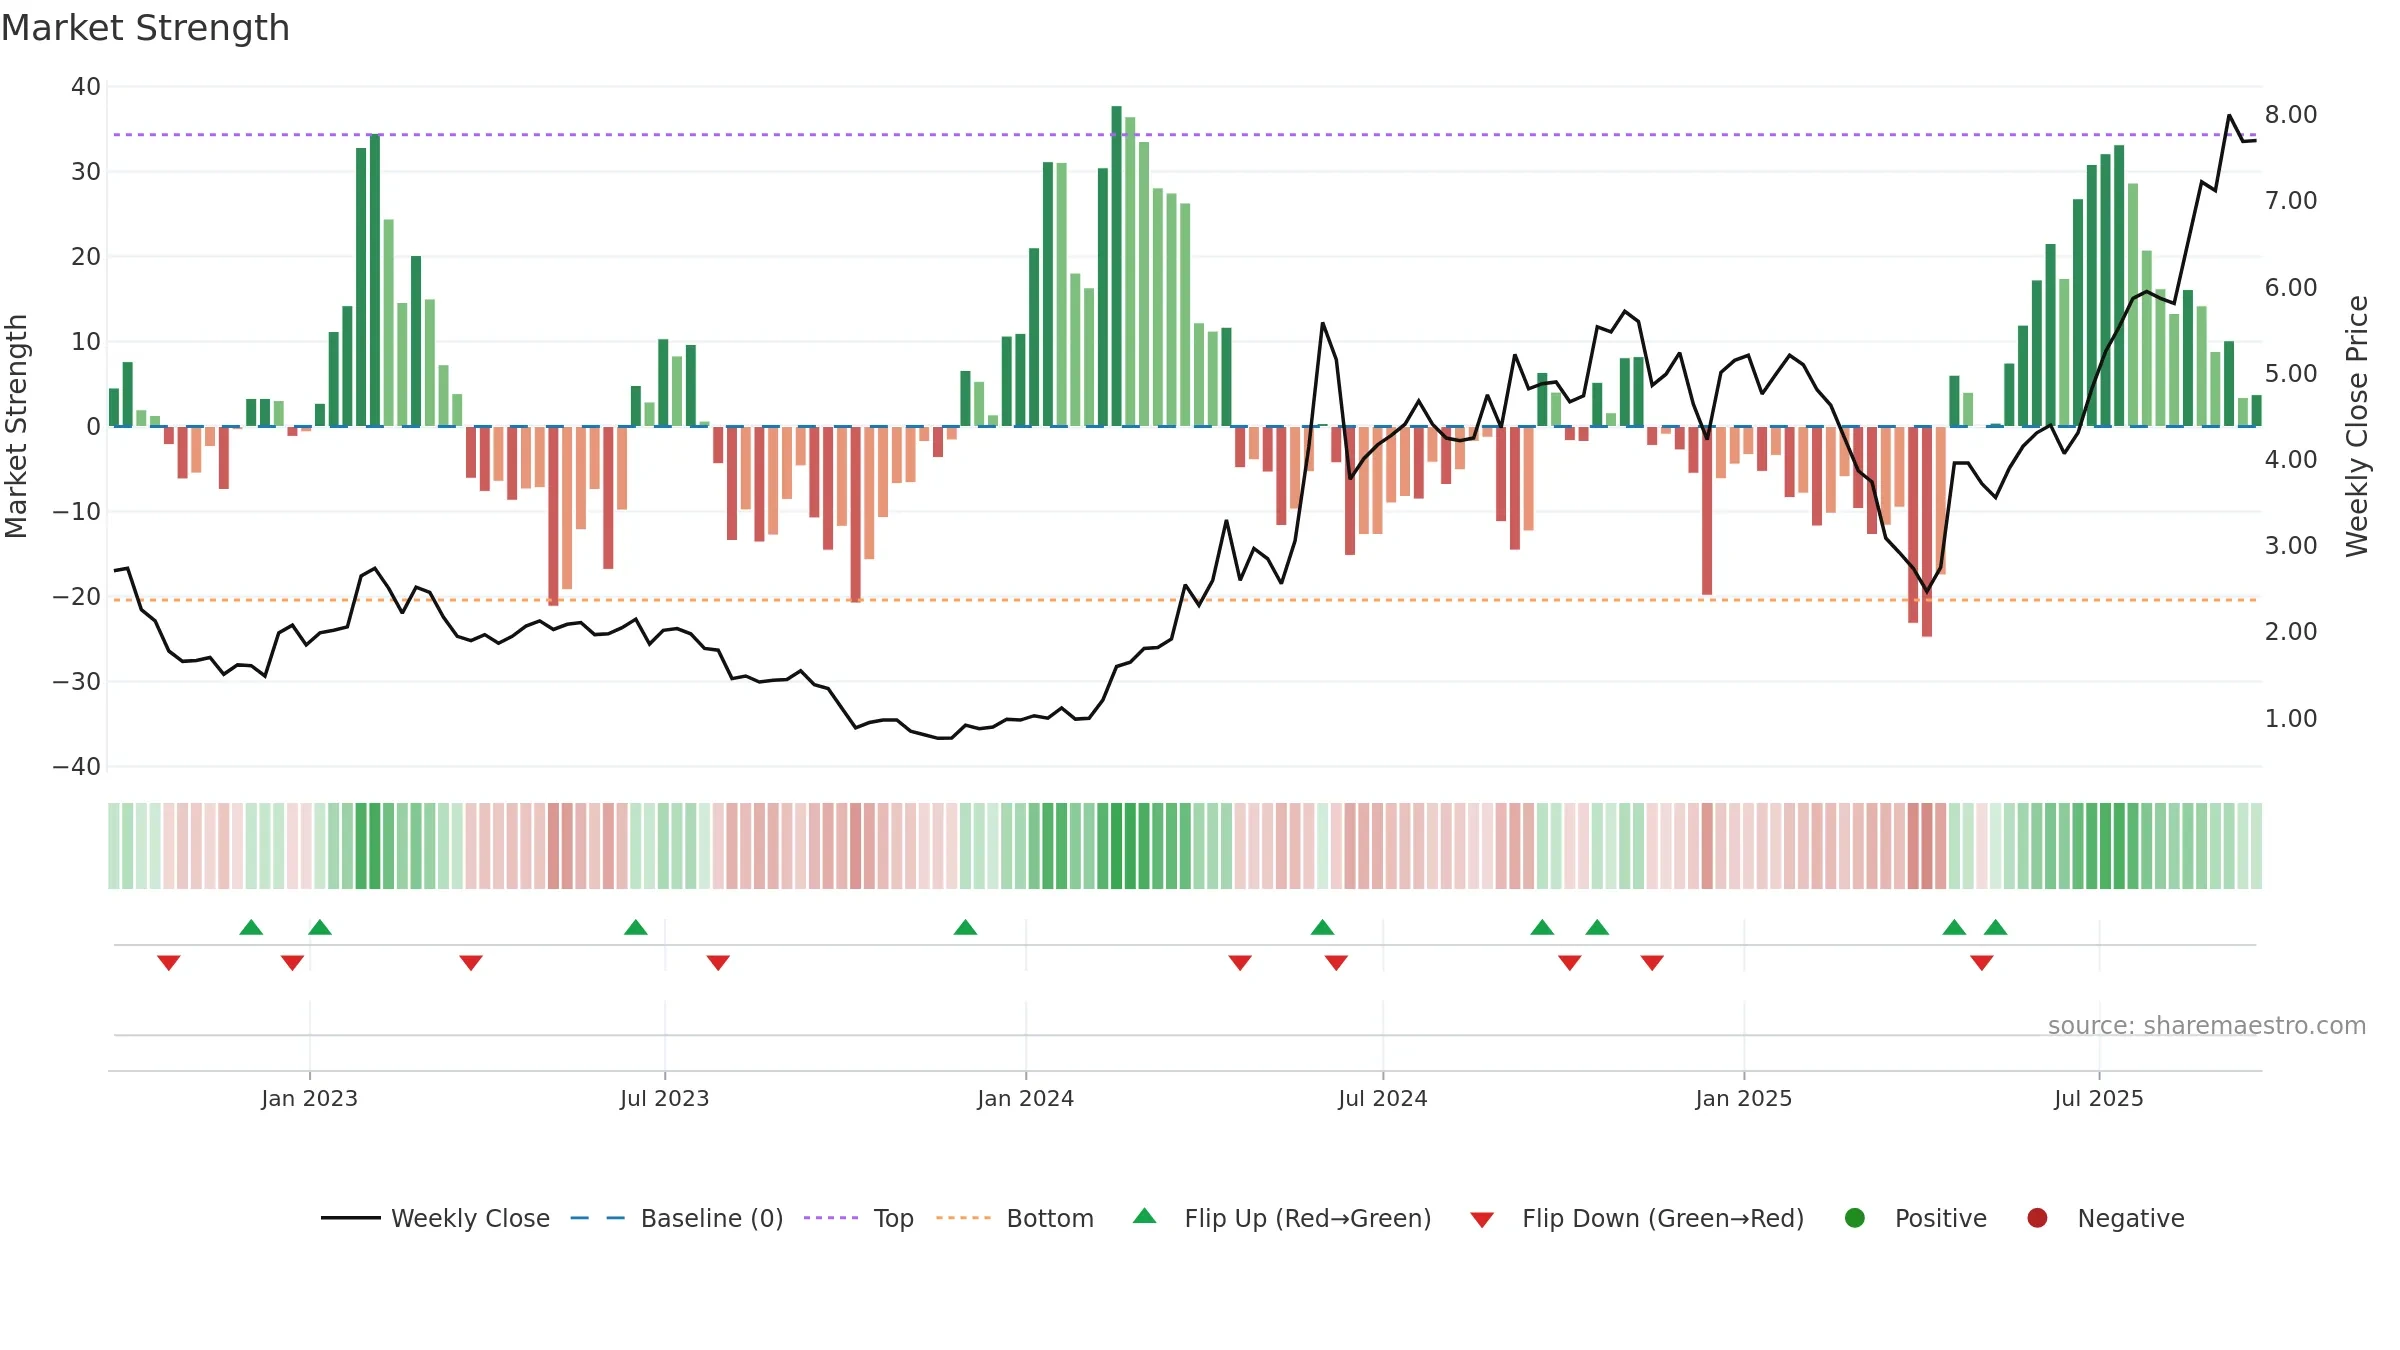
How to read this — Price slope is upward, indicating persistent buying over the window. Elevated weekly volatility increases whipsaw risk. Volume and price are moving in the same direction — a constructive confirmation. Constructive MA stack supports the up-drift; pullbacks may find support at the 8–13 week region. Price holds above key averages, indicating constructive participation.
Up-slope supports buying interest; pullbacks may be contained if activity stays firm.
Gauge maps the trend signal to a 0–100 scale.
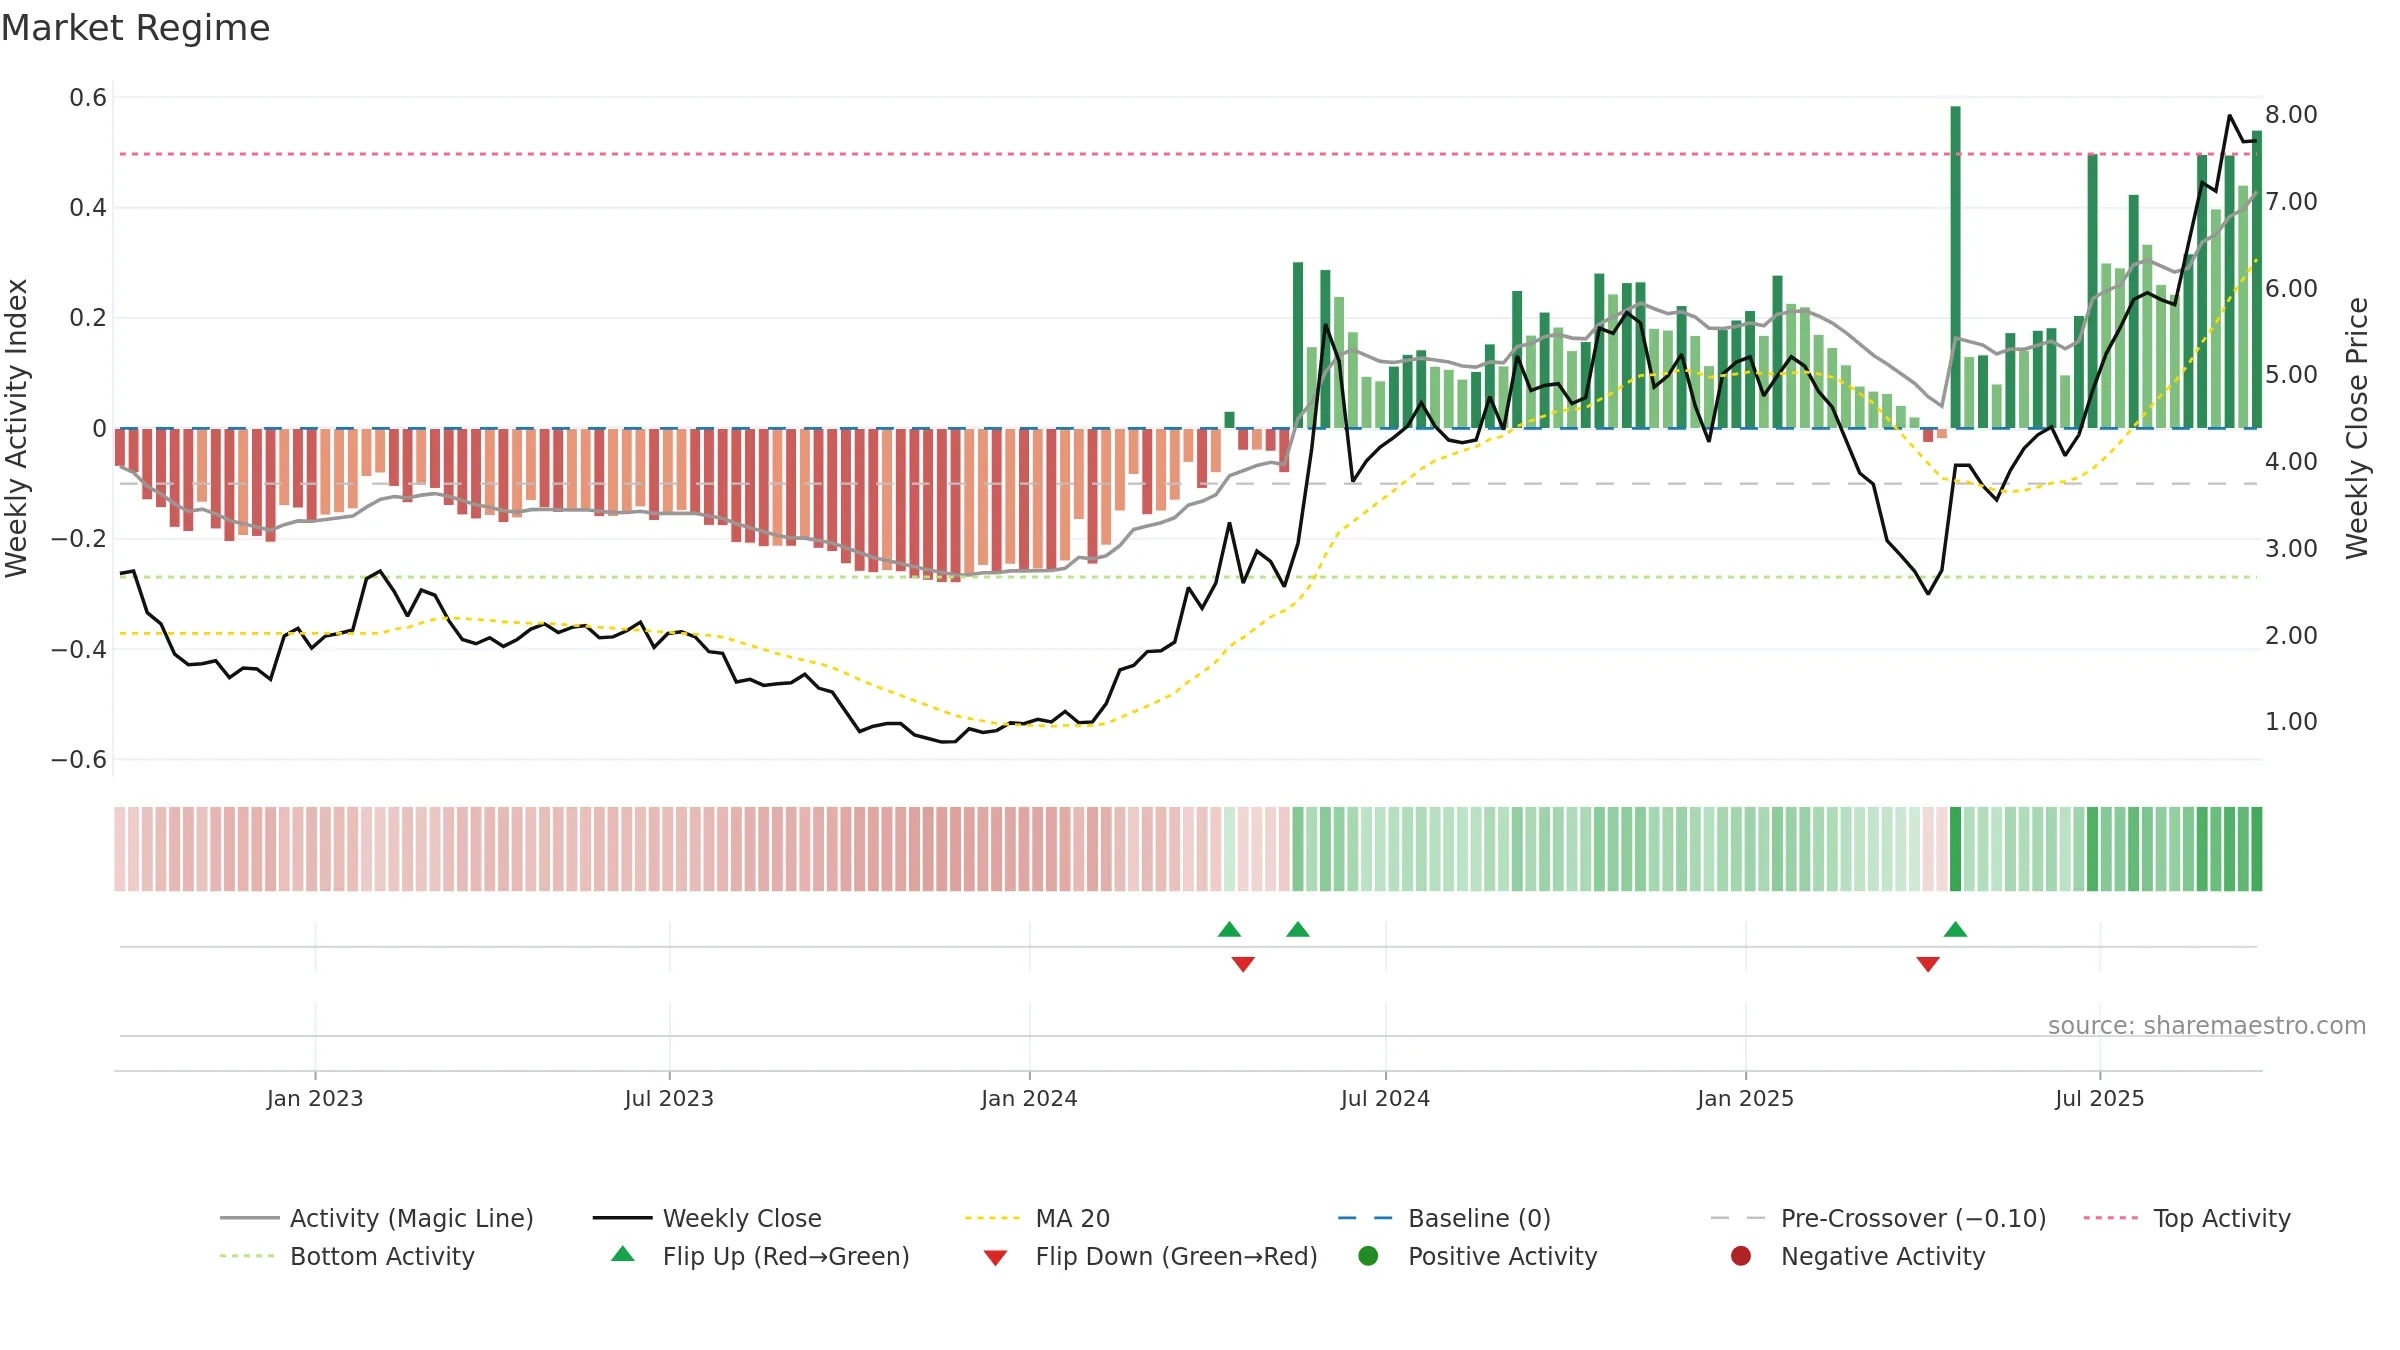
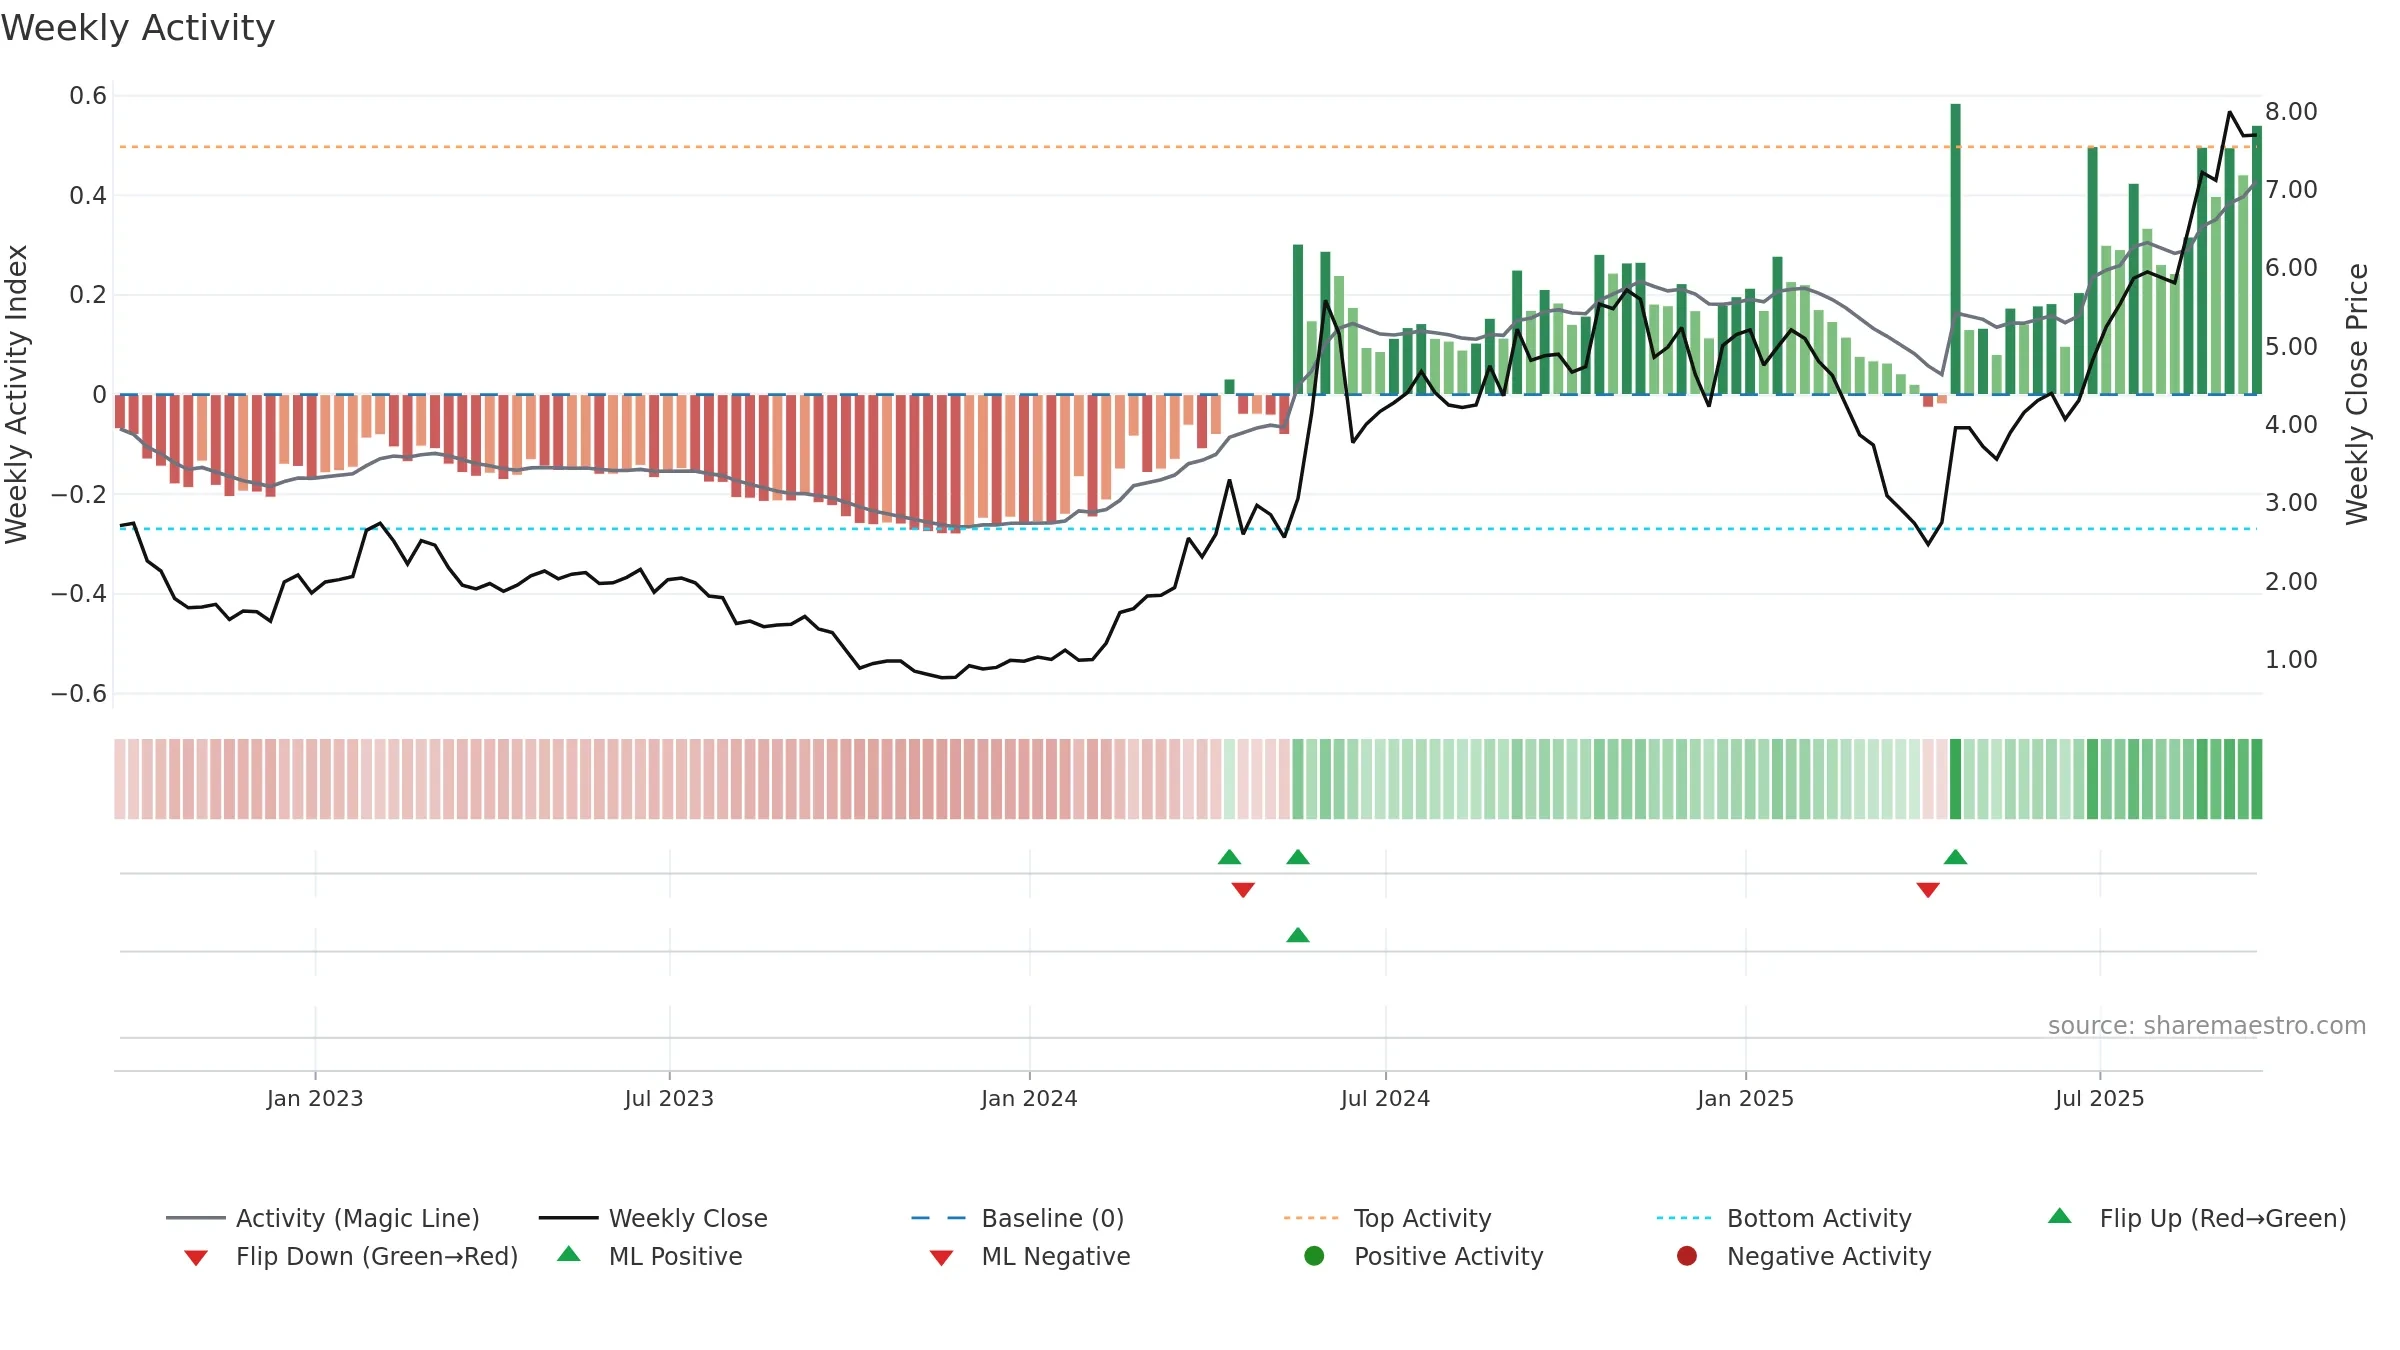
How to read this — Range-bound conditions; conviction is limited until a break or acceleration emerges.
Wait for a directional break or improving acceleration.
Conclusion
Positive setup. ★★★★☆ confidence. Price window: 31. Trend: Range / Neutral; gauge 82. In combination, liquidity confirms the move.
- Momentum is bullish and rising
- Price holds above 8w & 26w averages
- Constructive moving-average stack
- Liquidity confirms the price trend
- High return volatility raises whipsaw risk
Why: Price window 31.18% over 8w. Close is -3.75% below the prior-window high. Return volatility 4.77%. Volume trend rising. Liquidity convergence with price. Trend state range / neutral. High-regime (0.80–1.00) downticks 0/2 (0.0%) • Accumulating. MA stack constructive. Baseline deviation 1.44% (widening). Momentum bullish and rising.
Tip: Most metrics include a hover tooltip where they appear in the report.