Motilal Oswal Financial Services Limited
MOTILALOFS NSE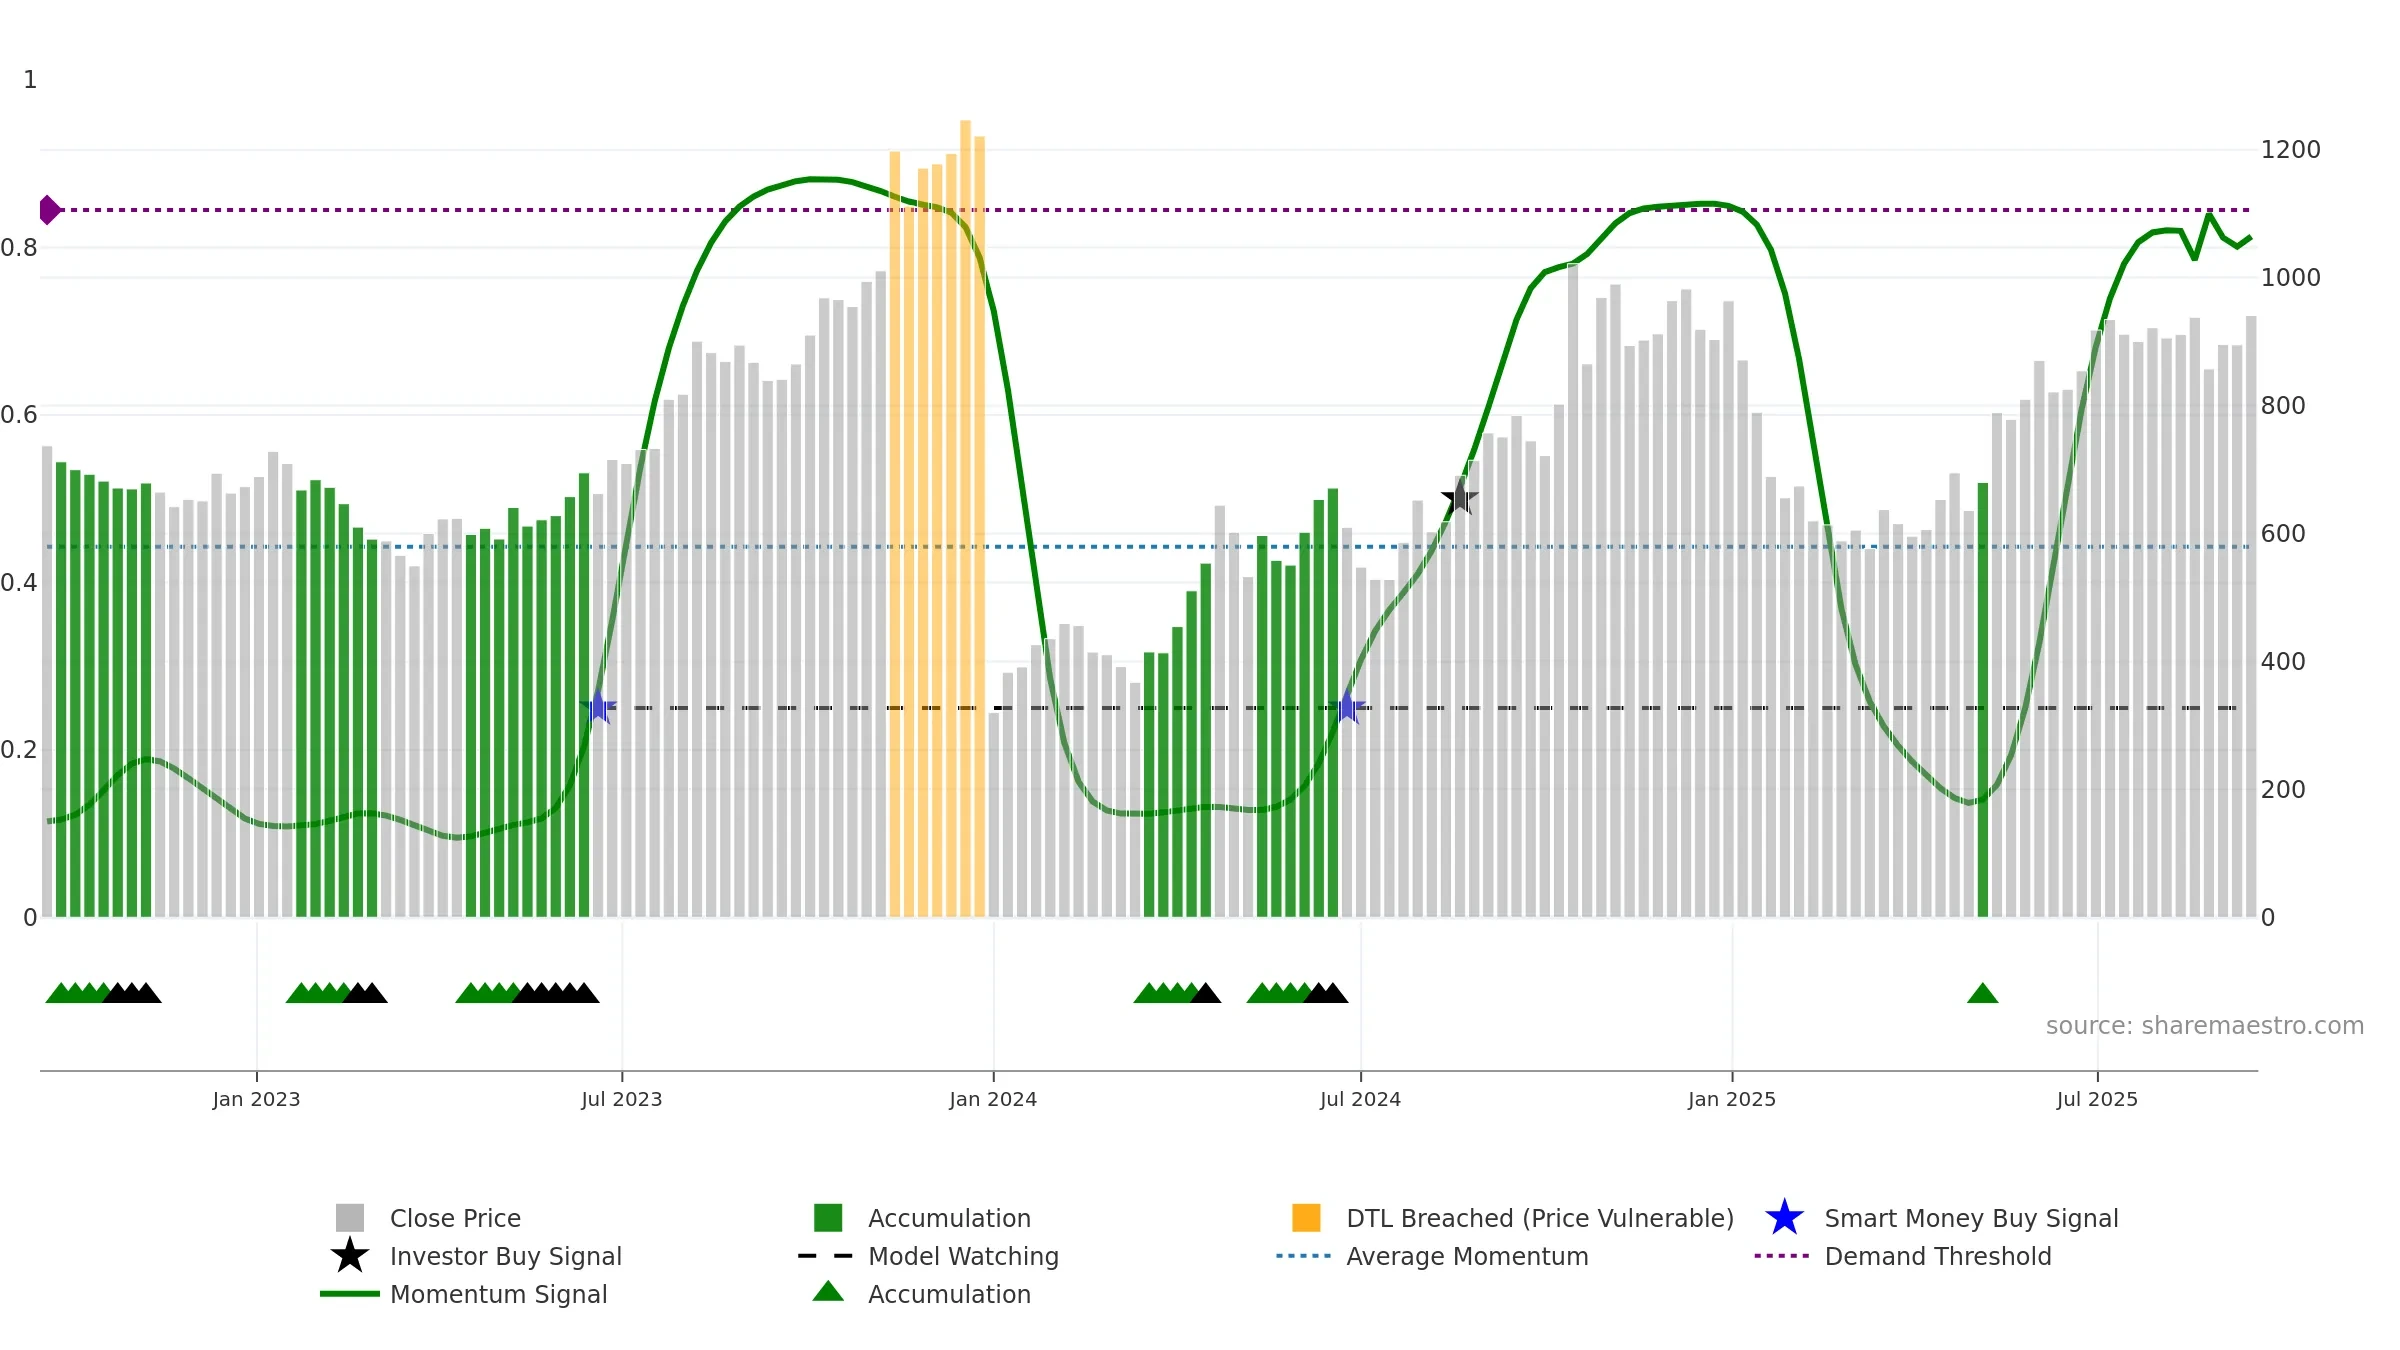
Weekly Report
Motilal Oswal Financial Services Limited closed at 940.7500 (2.04% WoW) . Data window ends Mon, 15 Sep 2025.
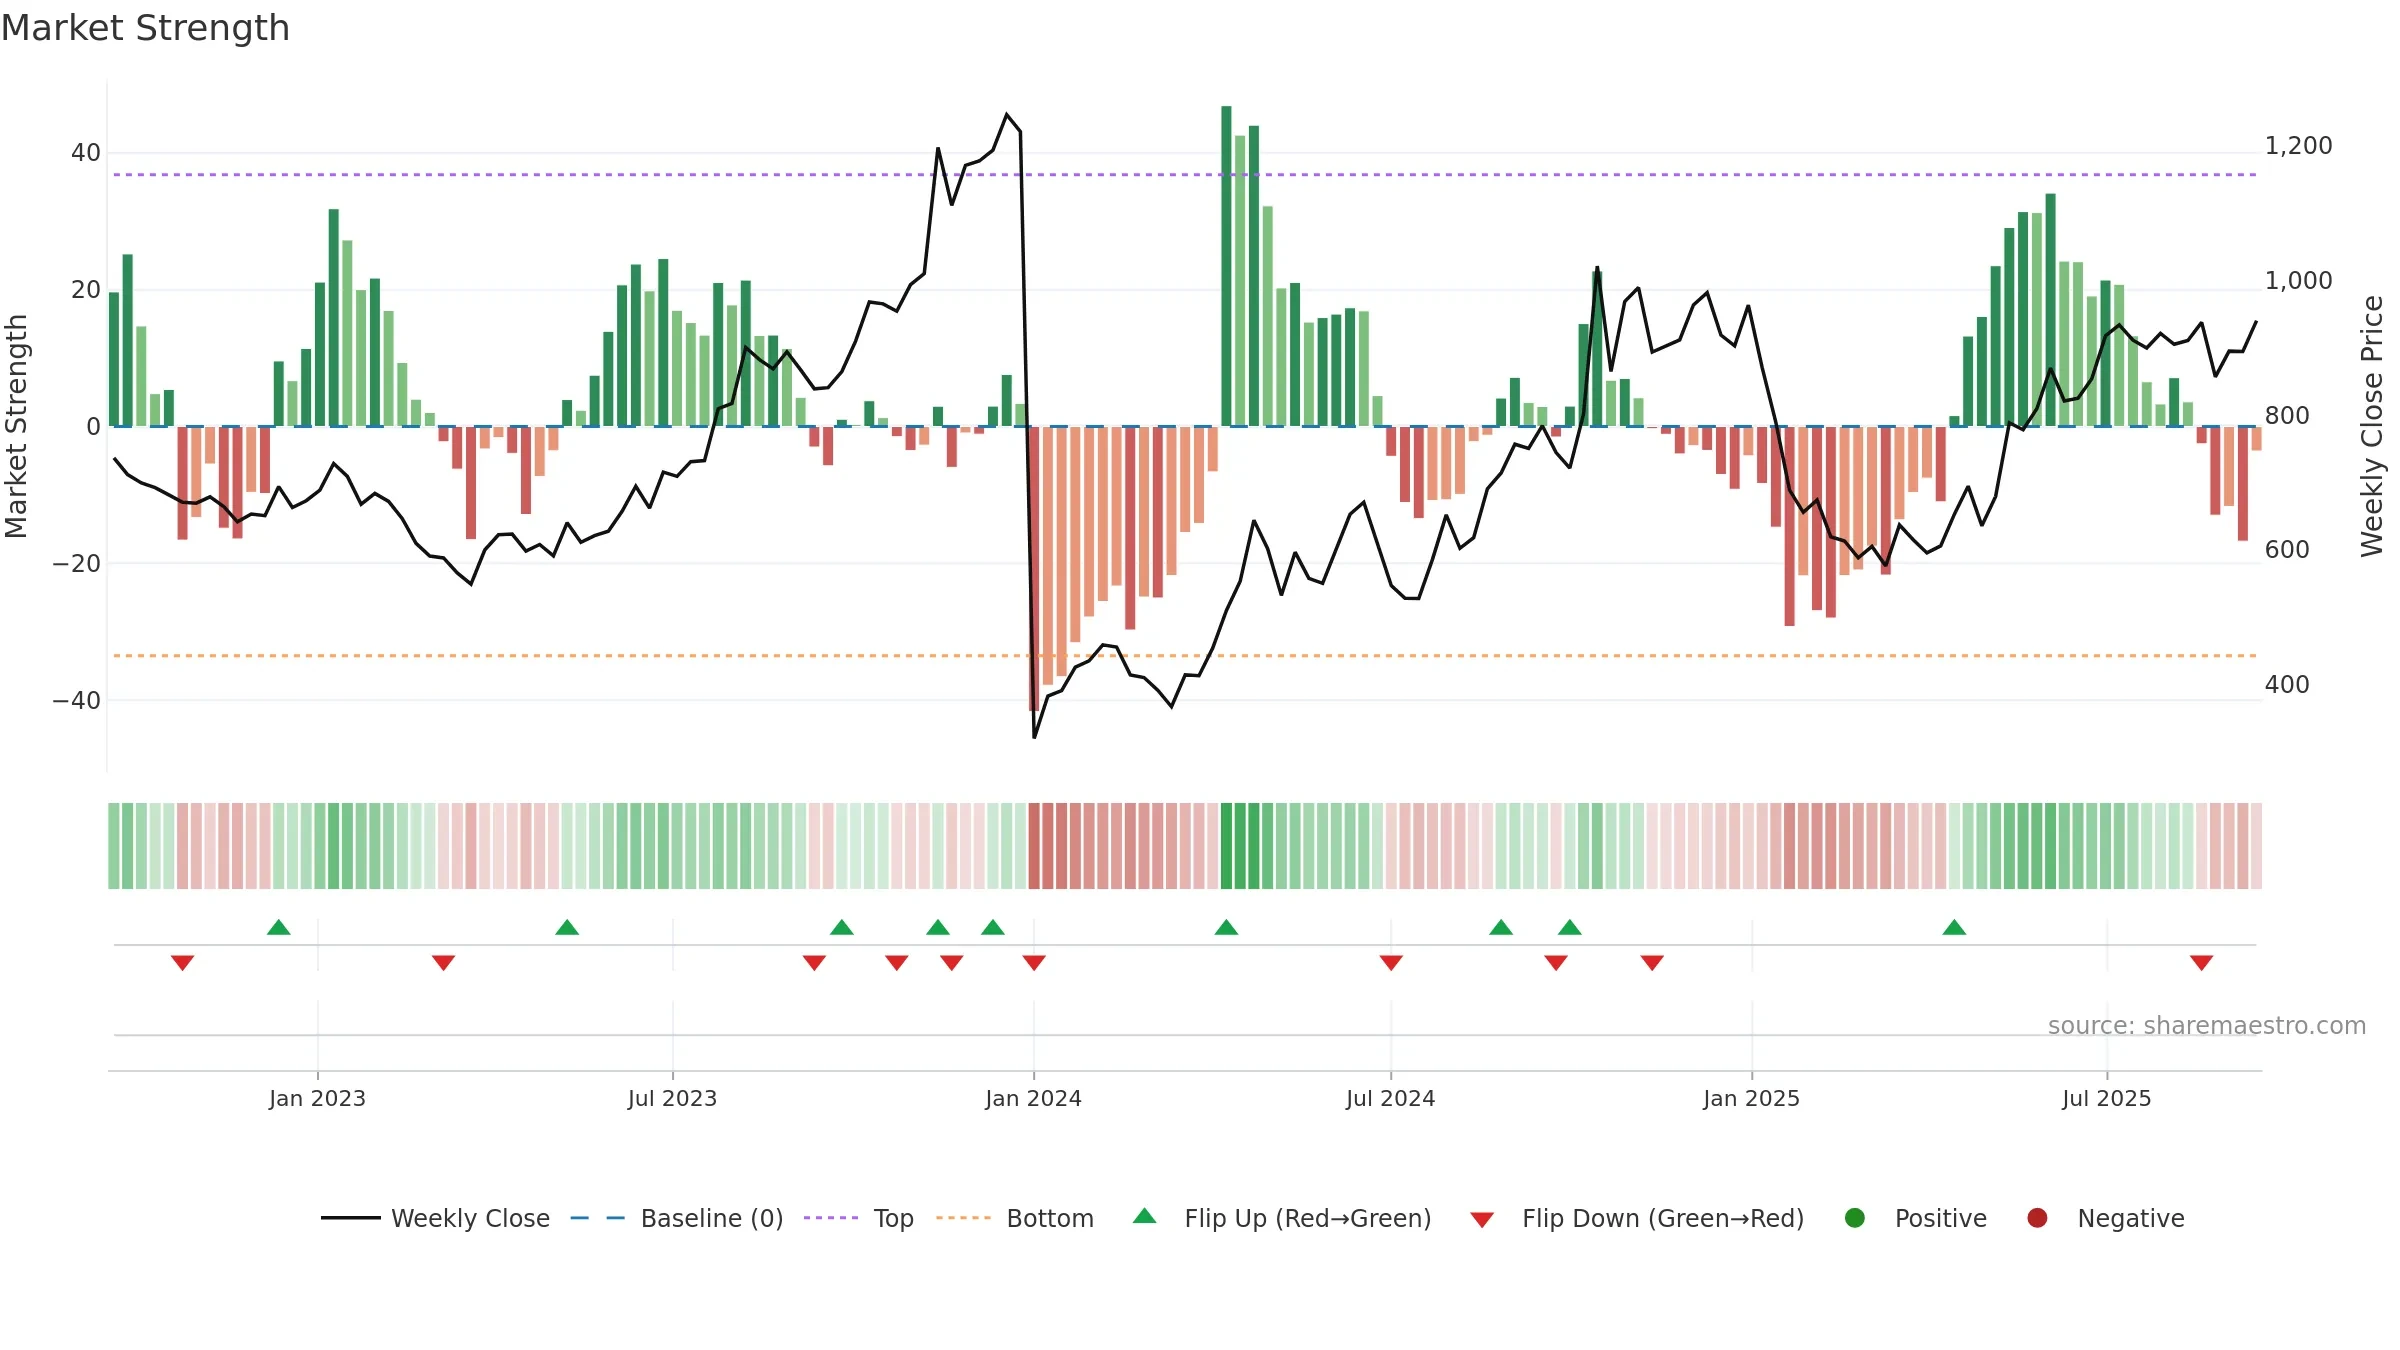
How to read this — Price slope is downward, indicating persistent supply pressure. Volume and price are moving in the same direction — a constructive confirmation. Returns are negatively correlated with volume — strength may come on lighter activity. Price is stretched above its baseline; consolidation risk rises if activity fades. Price holds above key averages, indicating constructive participation.
Down-slope argues for patience; rallies can fade sooner unless participation improves.
Gauge maps the trend signal to a 0–100 scale.
How to read this — Gauge is elevated but momentum is rolling over; topping risk is rising.
Stay alert: protect gains or seek confirmation before adding risk.
Price is below fair value; potential upside if momentum constructive.
Conclusion
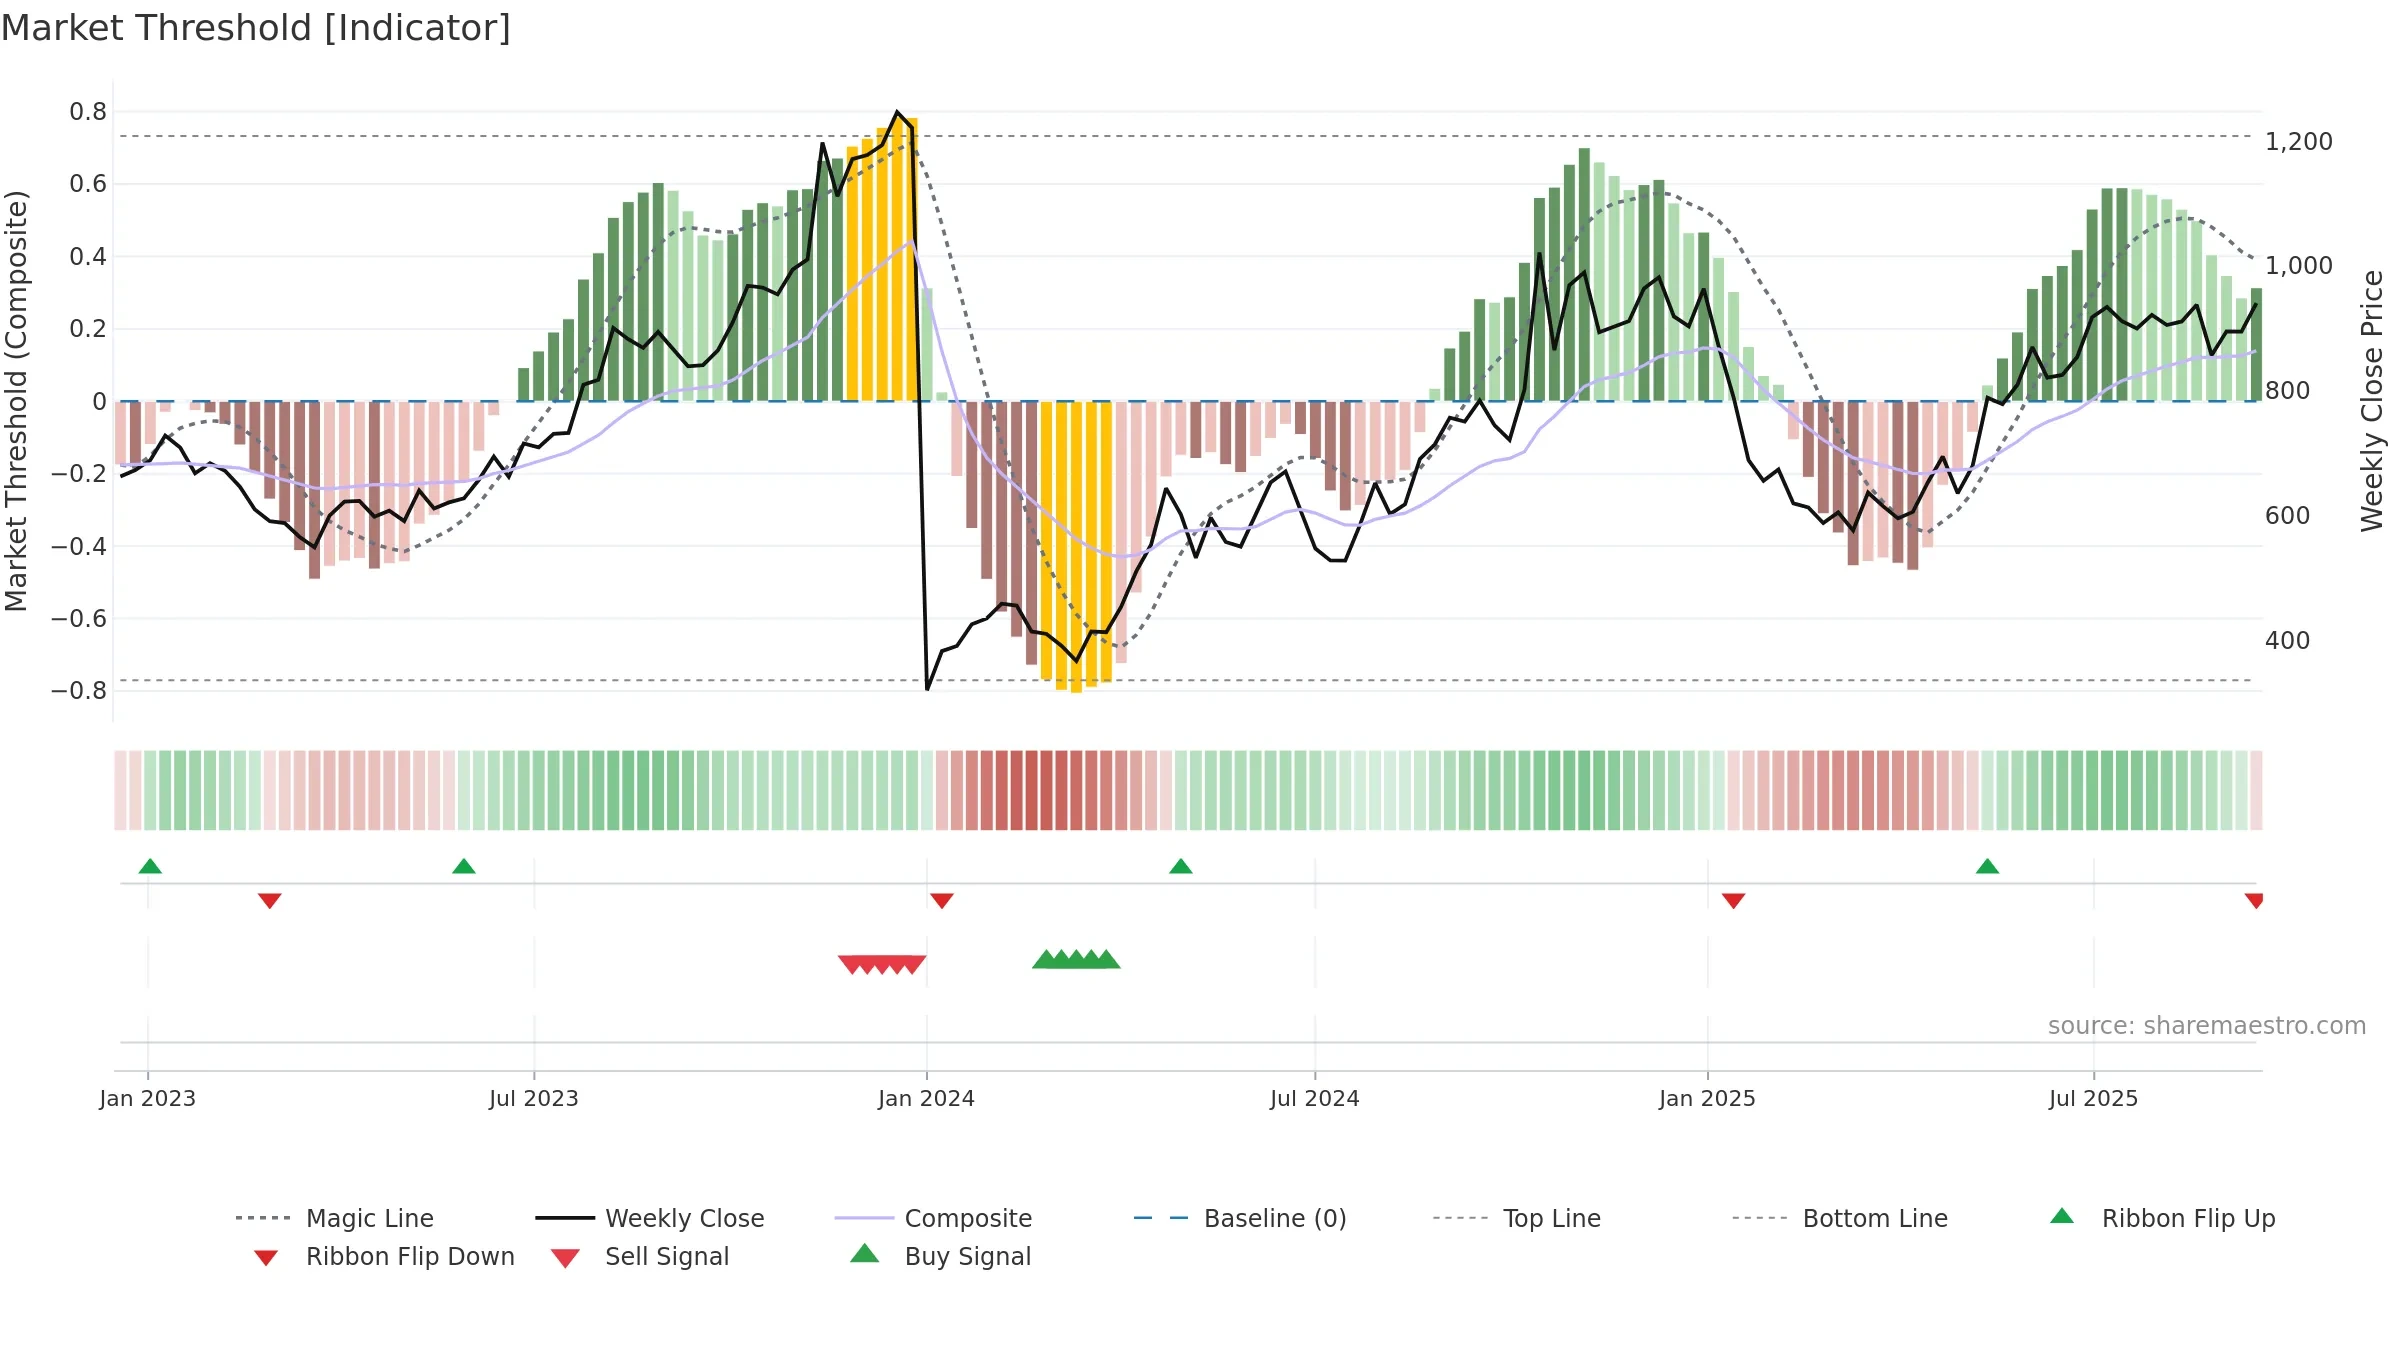
Negative setup. ★★☆☆☆ confidence. Price window: 2. Trend: Uptrend at Risk; gauge 81. In combination, liquidity confirms the move.
- Price holds above 8w & 26w averages
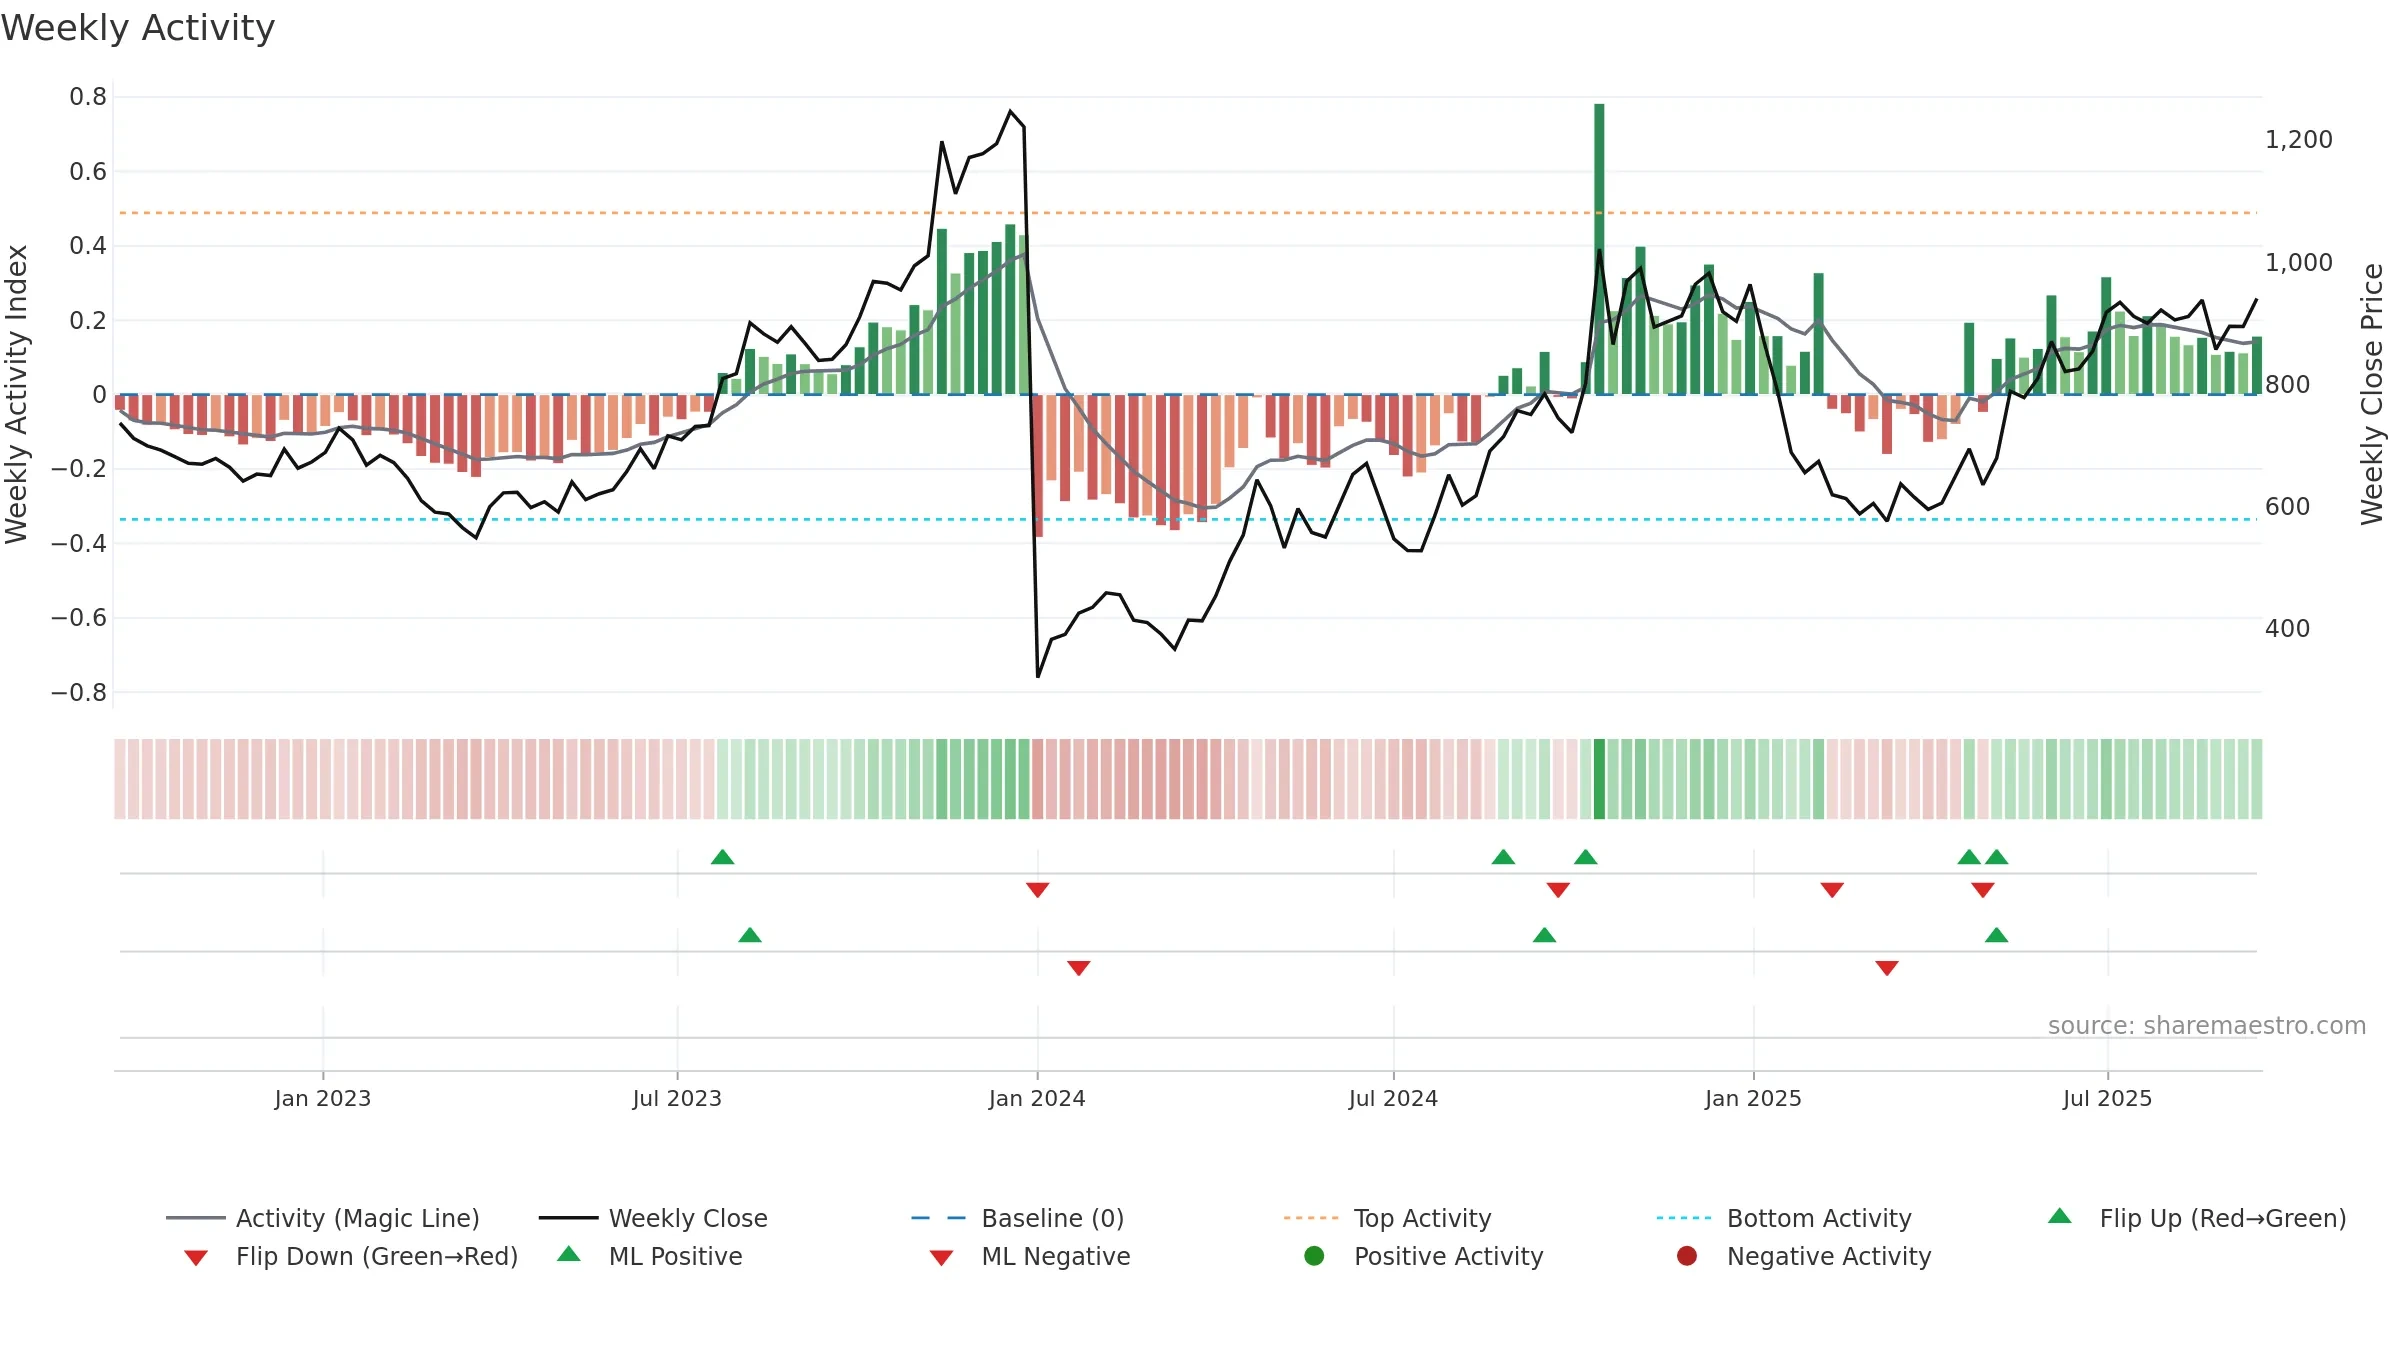
- Liquidity confirms the price trend
- High-level but rolling over (topping risk)
- Momentum is weak/falling
- Sellers active at elevated levels (distribution)
Why: Price window 2.07% over 8w. Volume trend falling. Liquidity convergence with price. Trend state uptrend at risk. High-regime (0.80–1.00) downticks 4/6 (67.0%) • Distributing. Momentum neutral and falling. Valuation supportive skew.
Tip: Most metrics include a hover tooltip where they appear in the report.