Gerresheimer AG
GXI SWX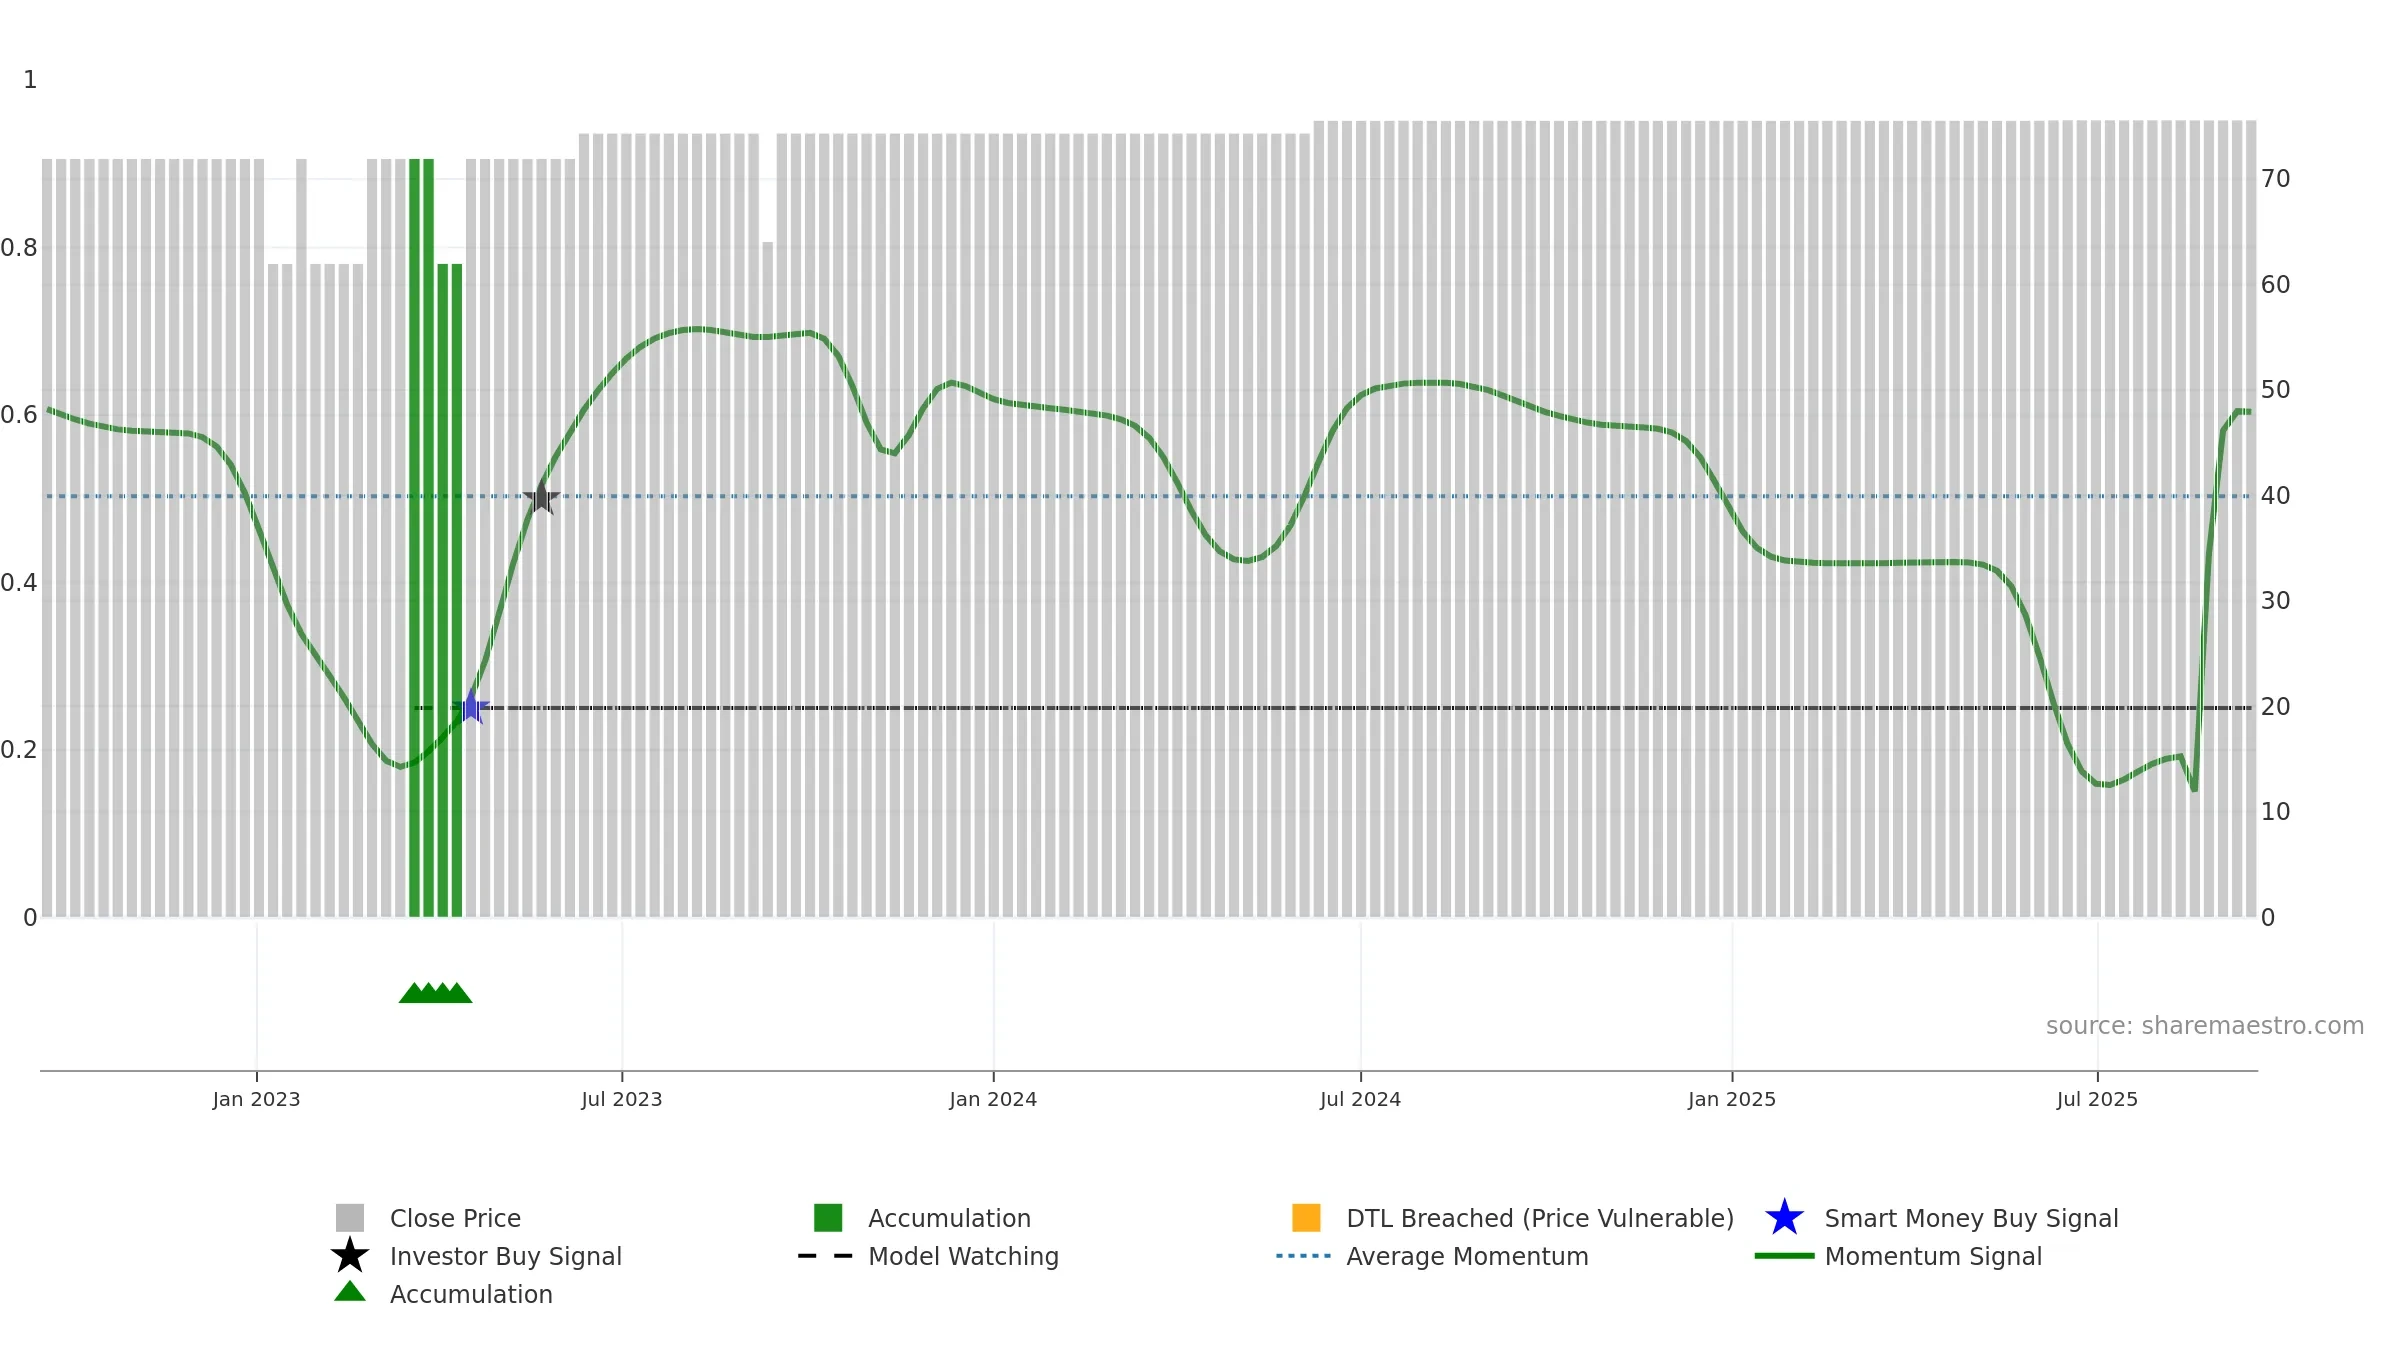

Weekly Report
Gerresheimer AG closed at 75.6000 (0.00% WoW) . Data window ends Mon, 15 Sep 2025.
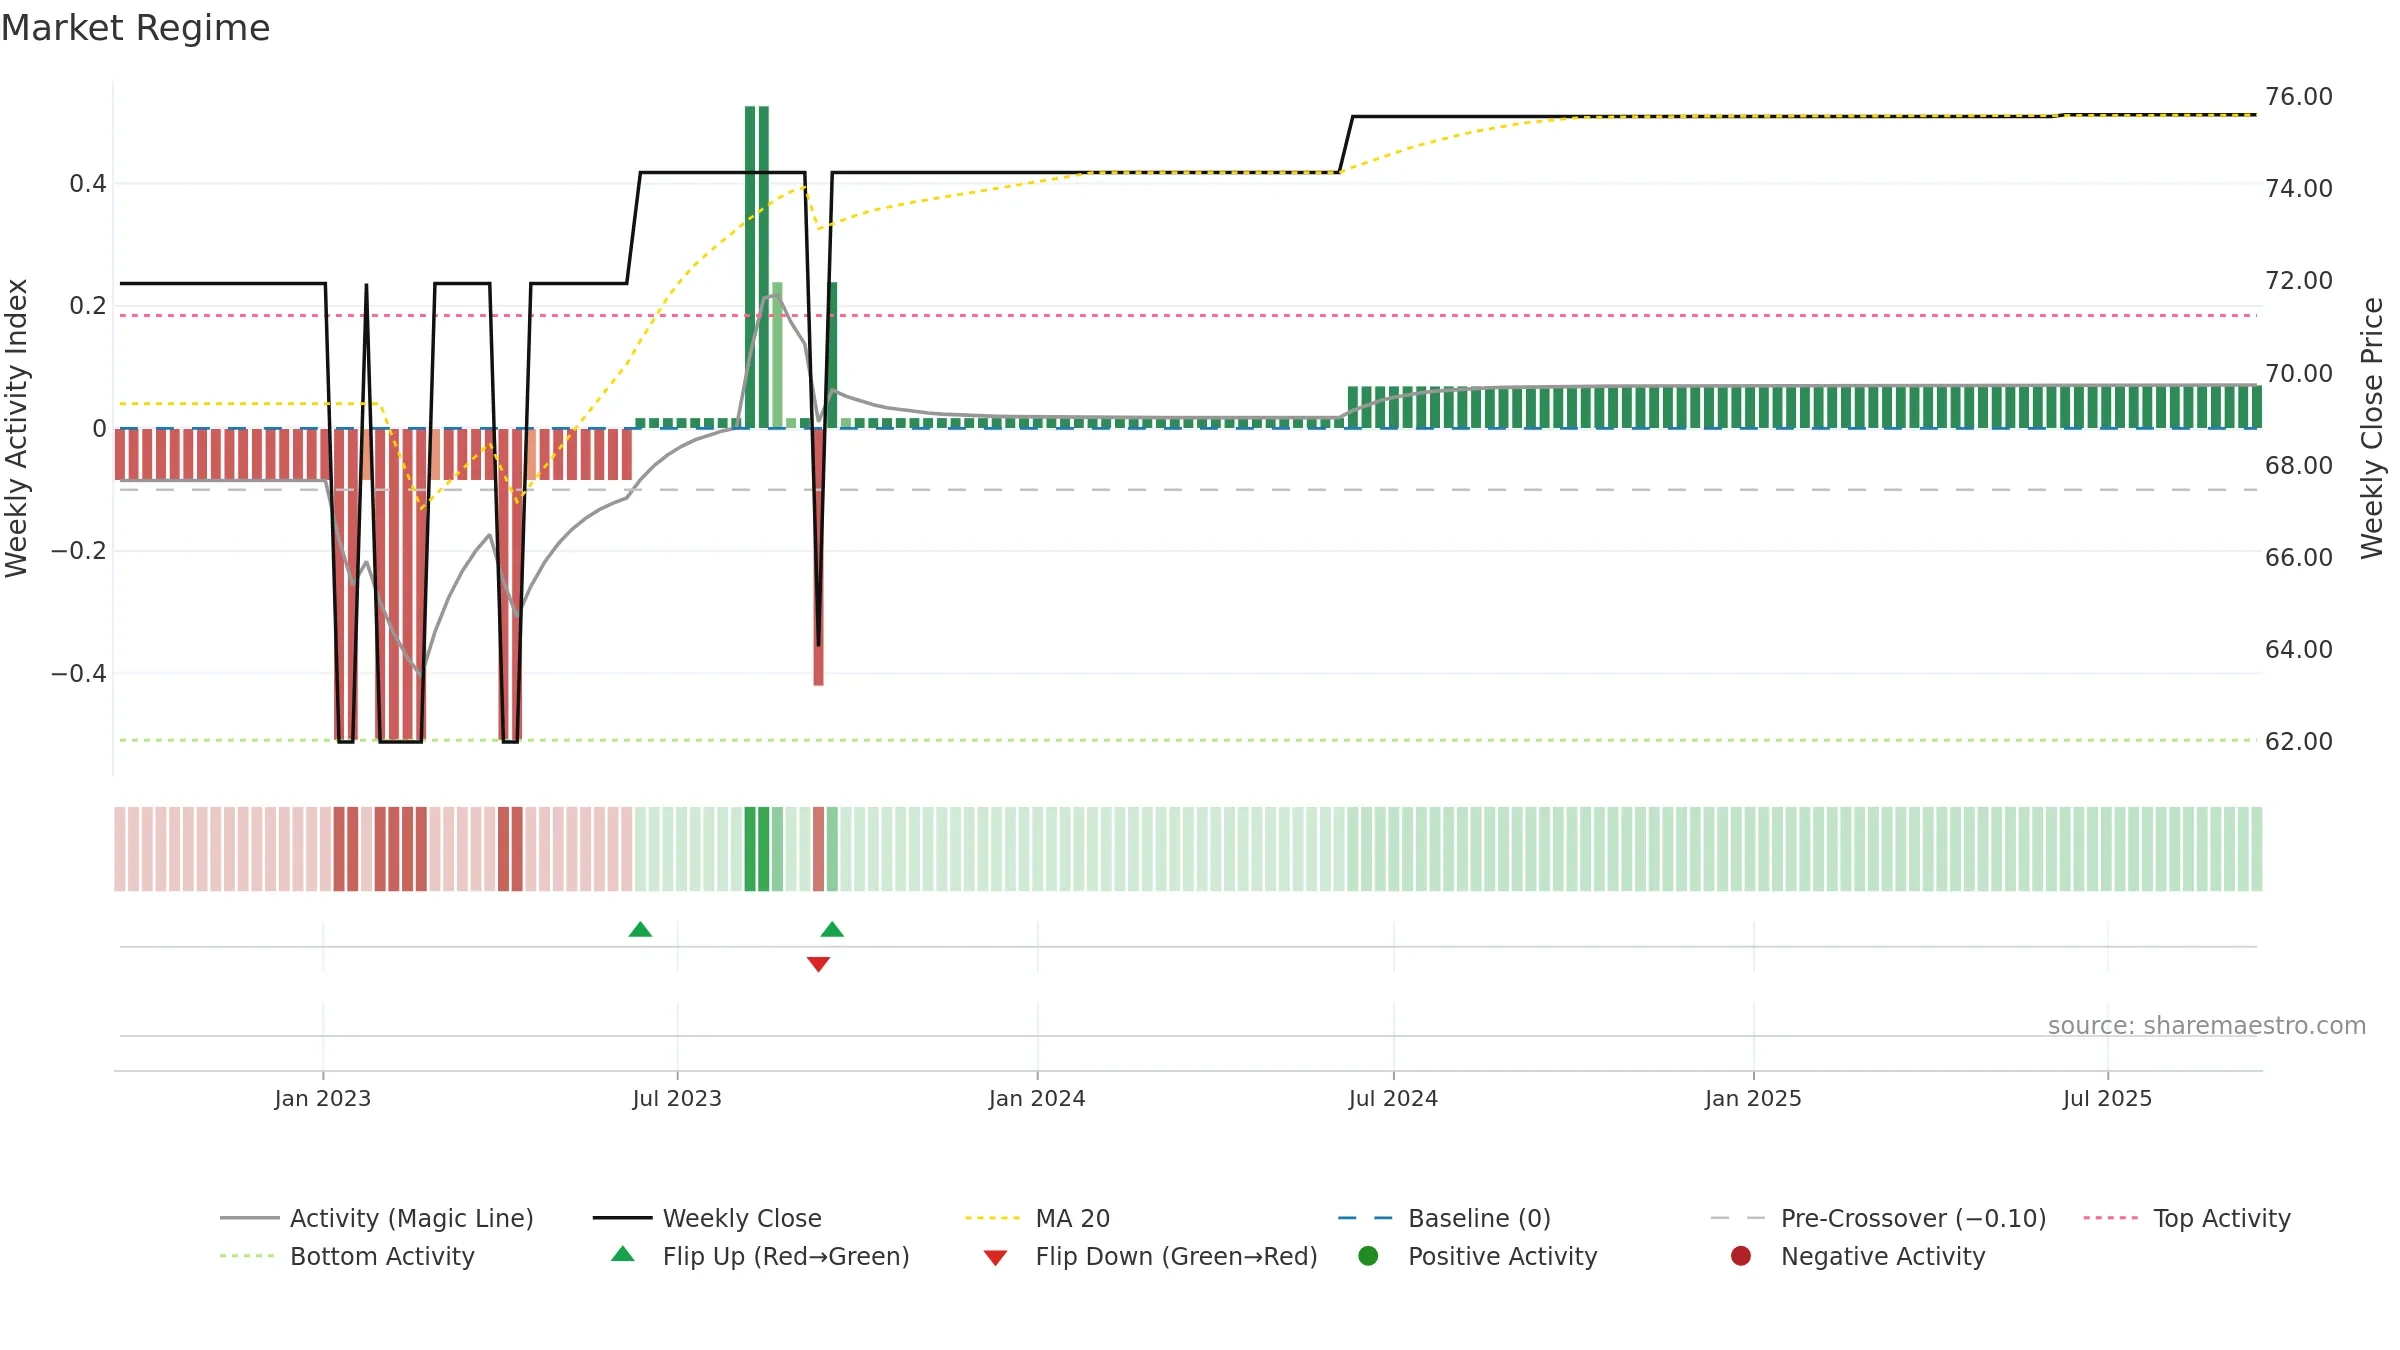
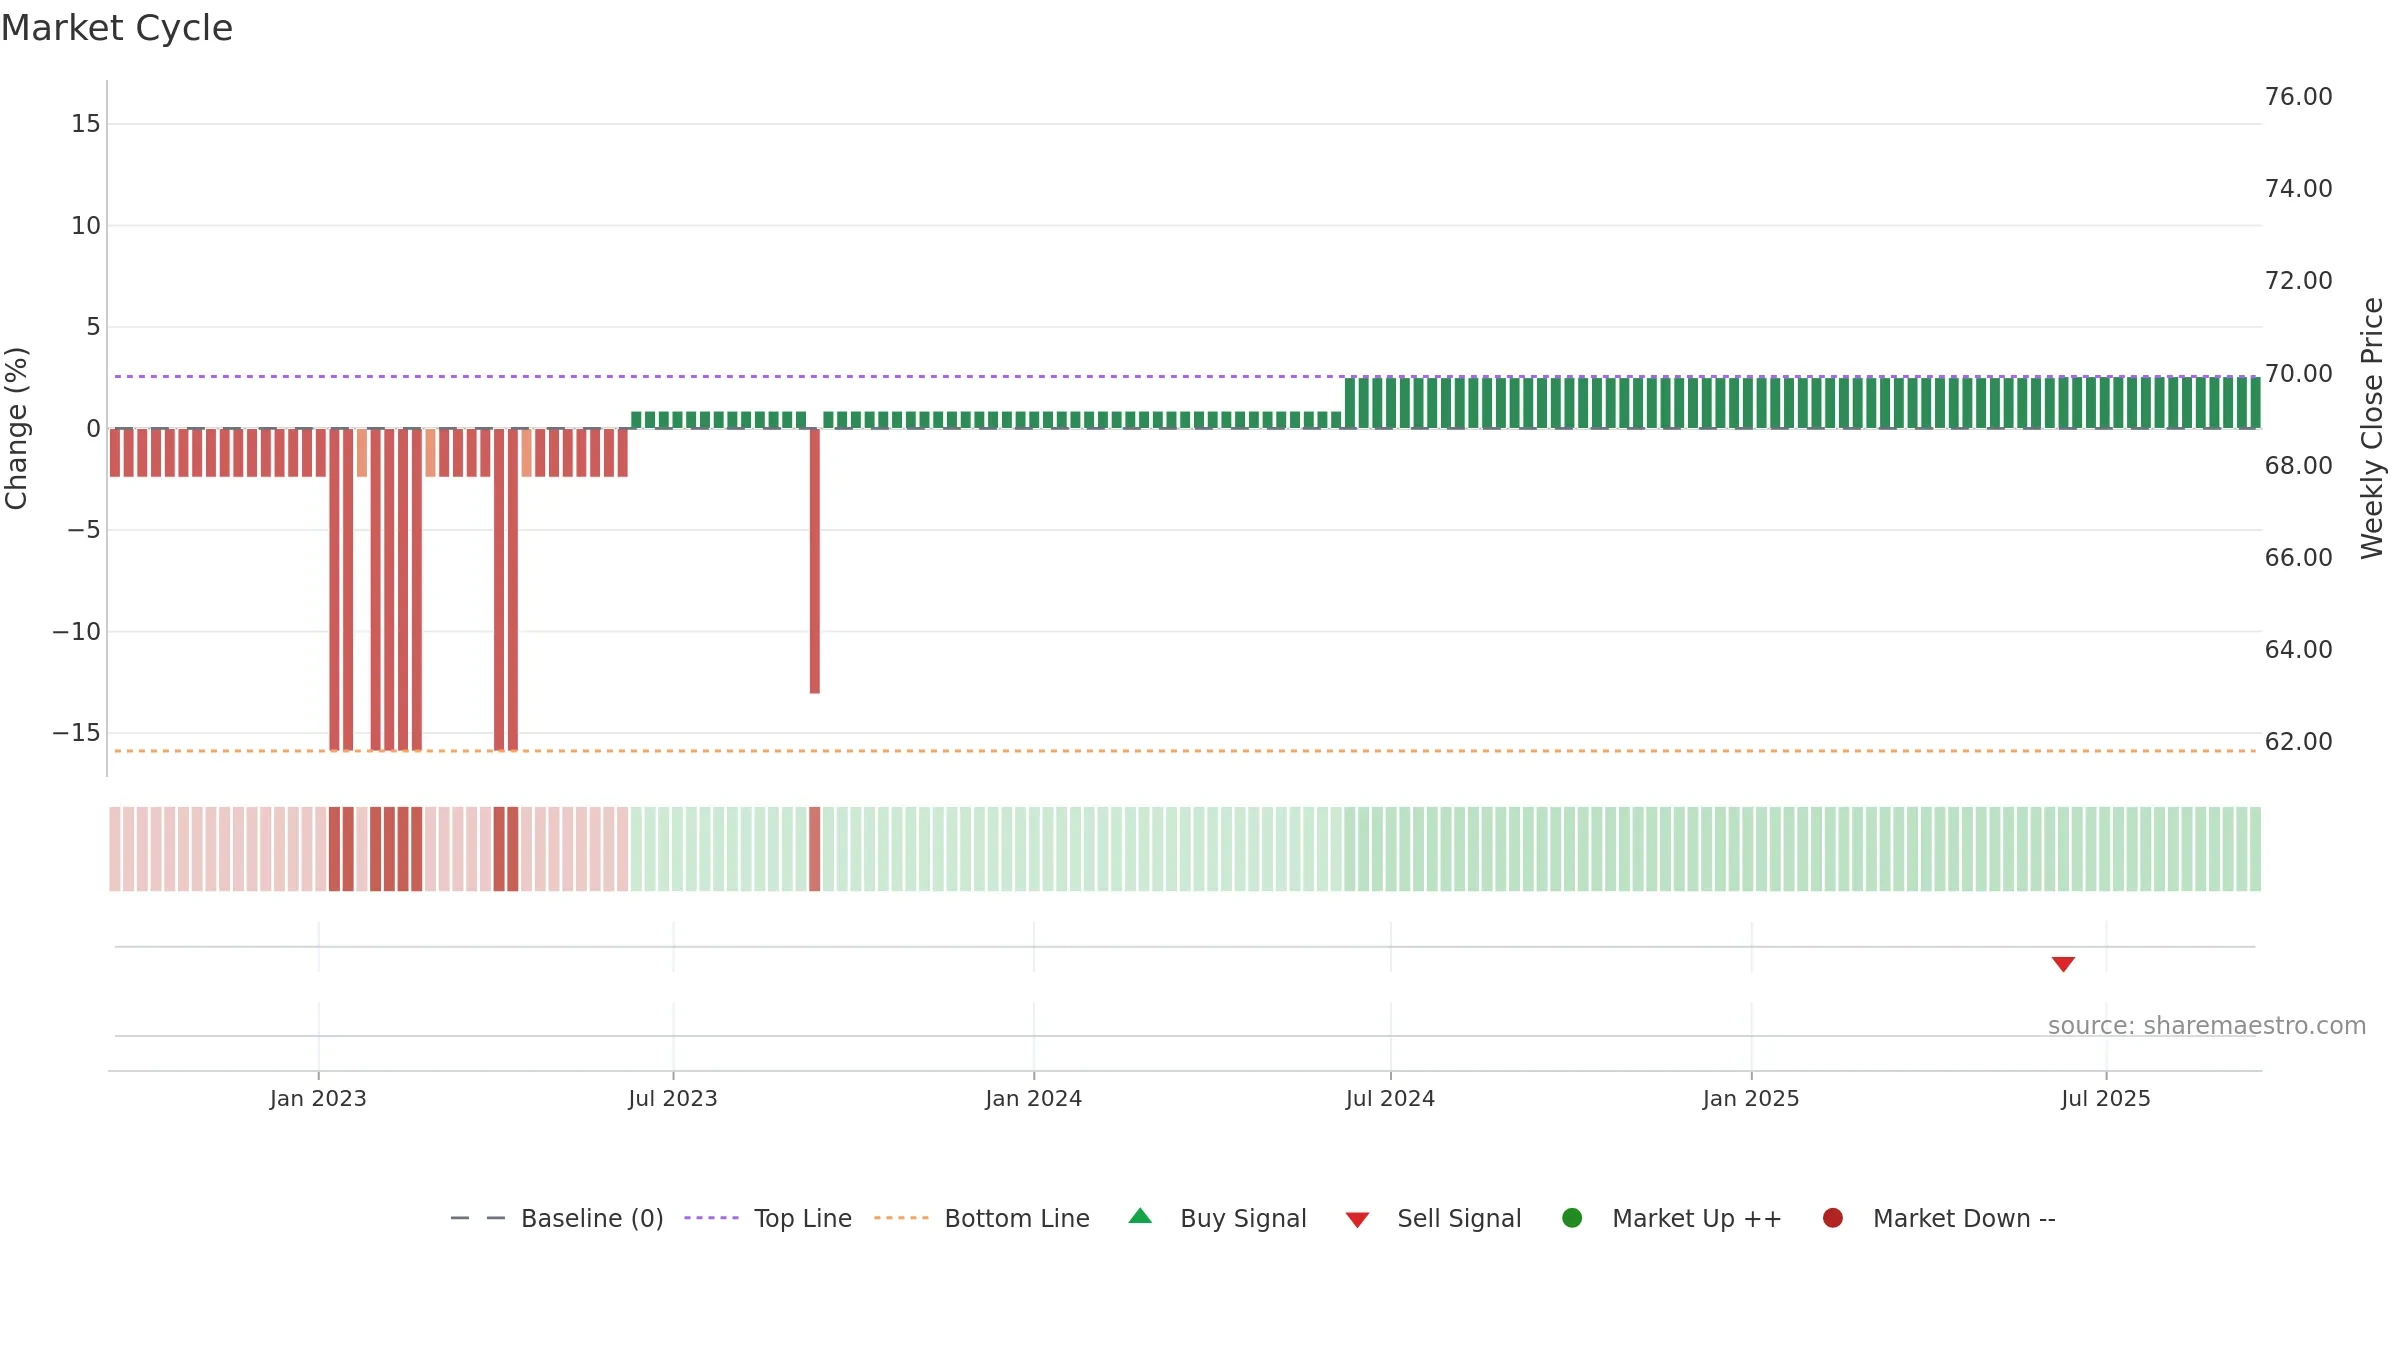
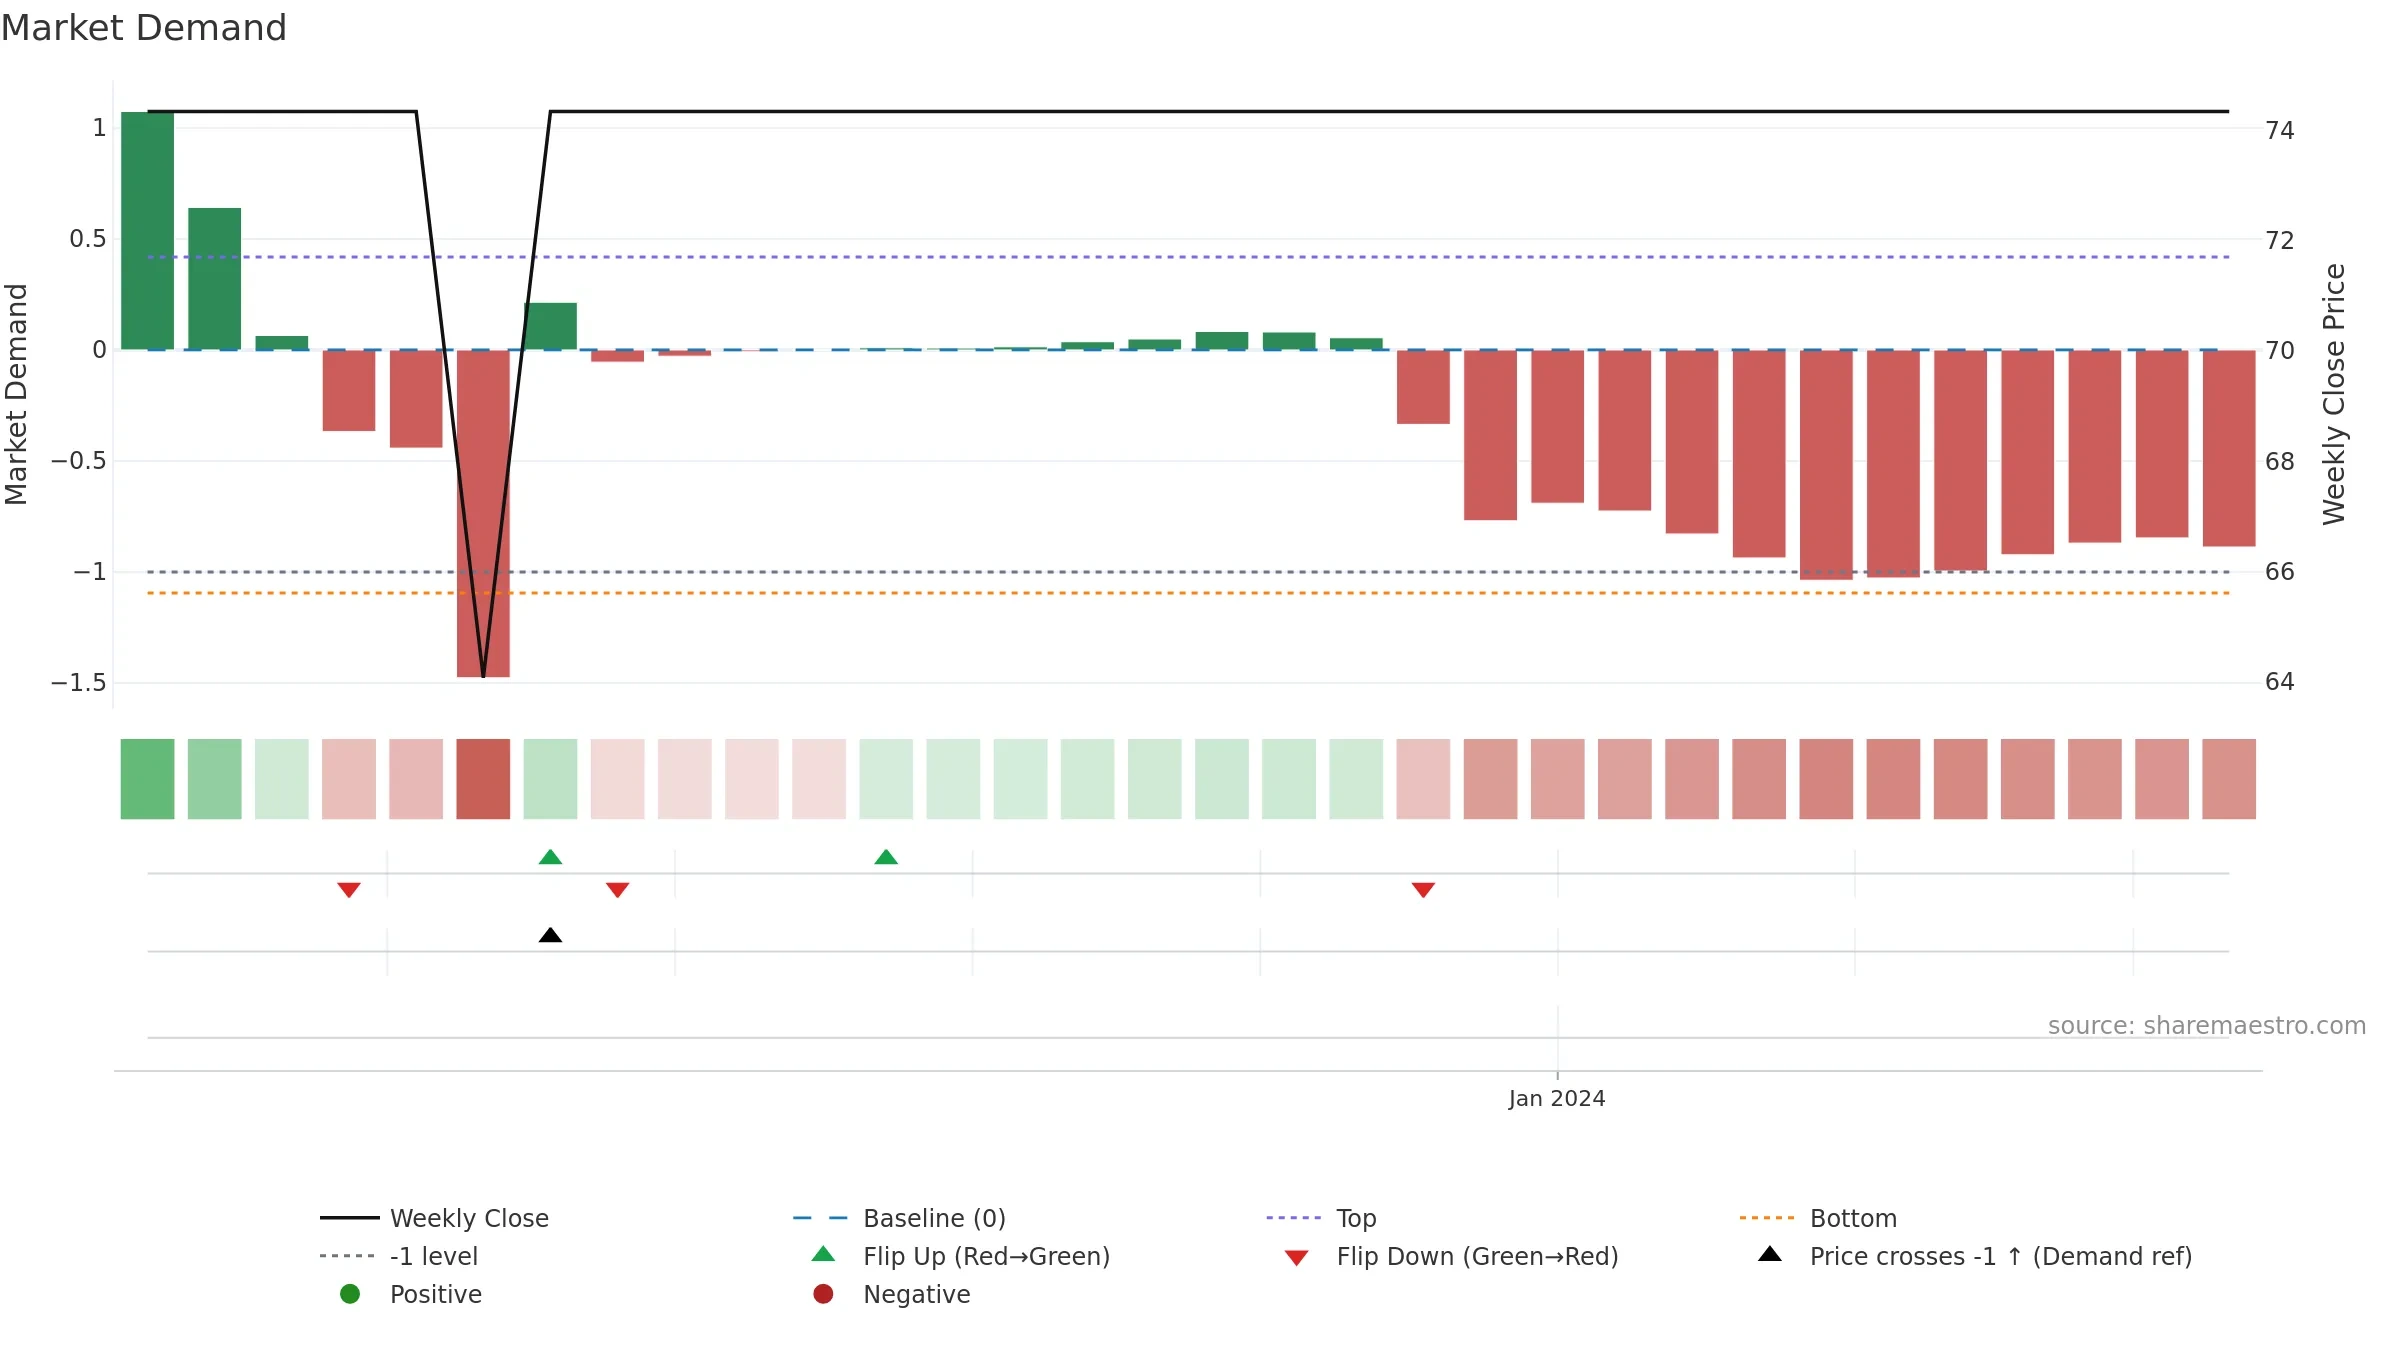
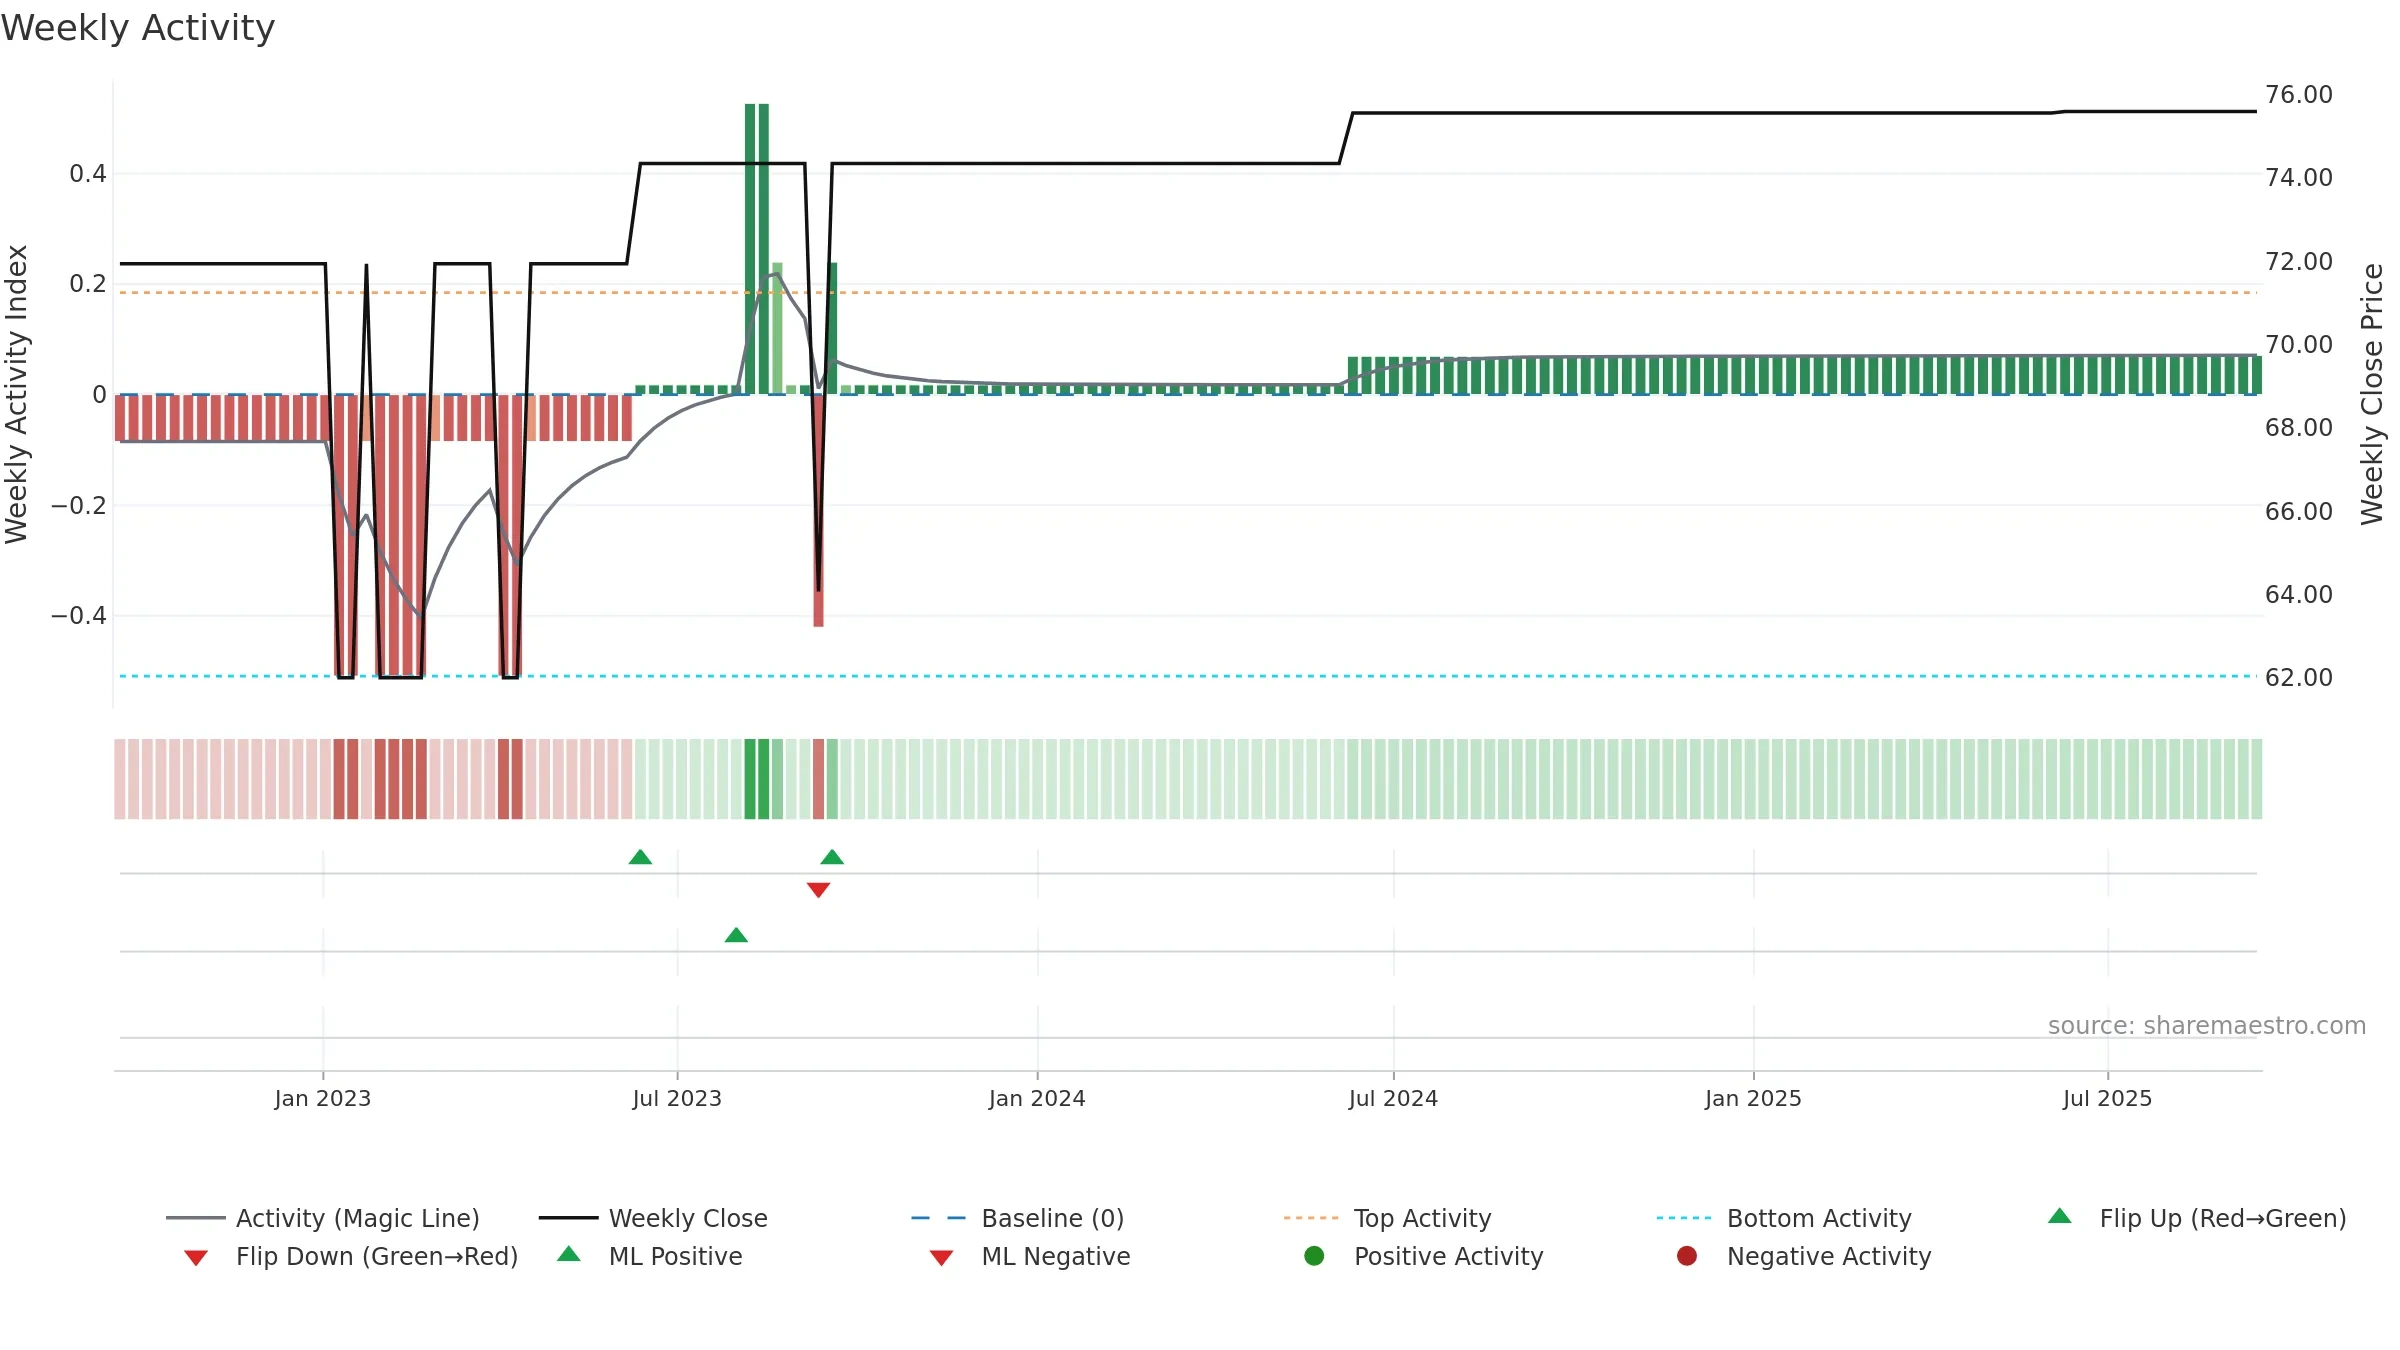
How to read this — Price slope is flat, suggesting balance between buyers and sellers. Low weekly volatility favours steadier follow-through. Volume or price is flat; confirmation from liquidity is limited. Distance to baseline is narrowing — reverting closer to its fair-value track.
Flat slope suggests a wait-and-see approach until the balance shifts.
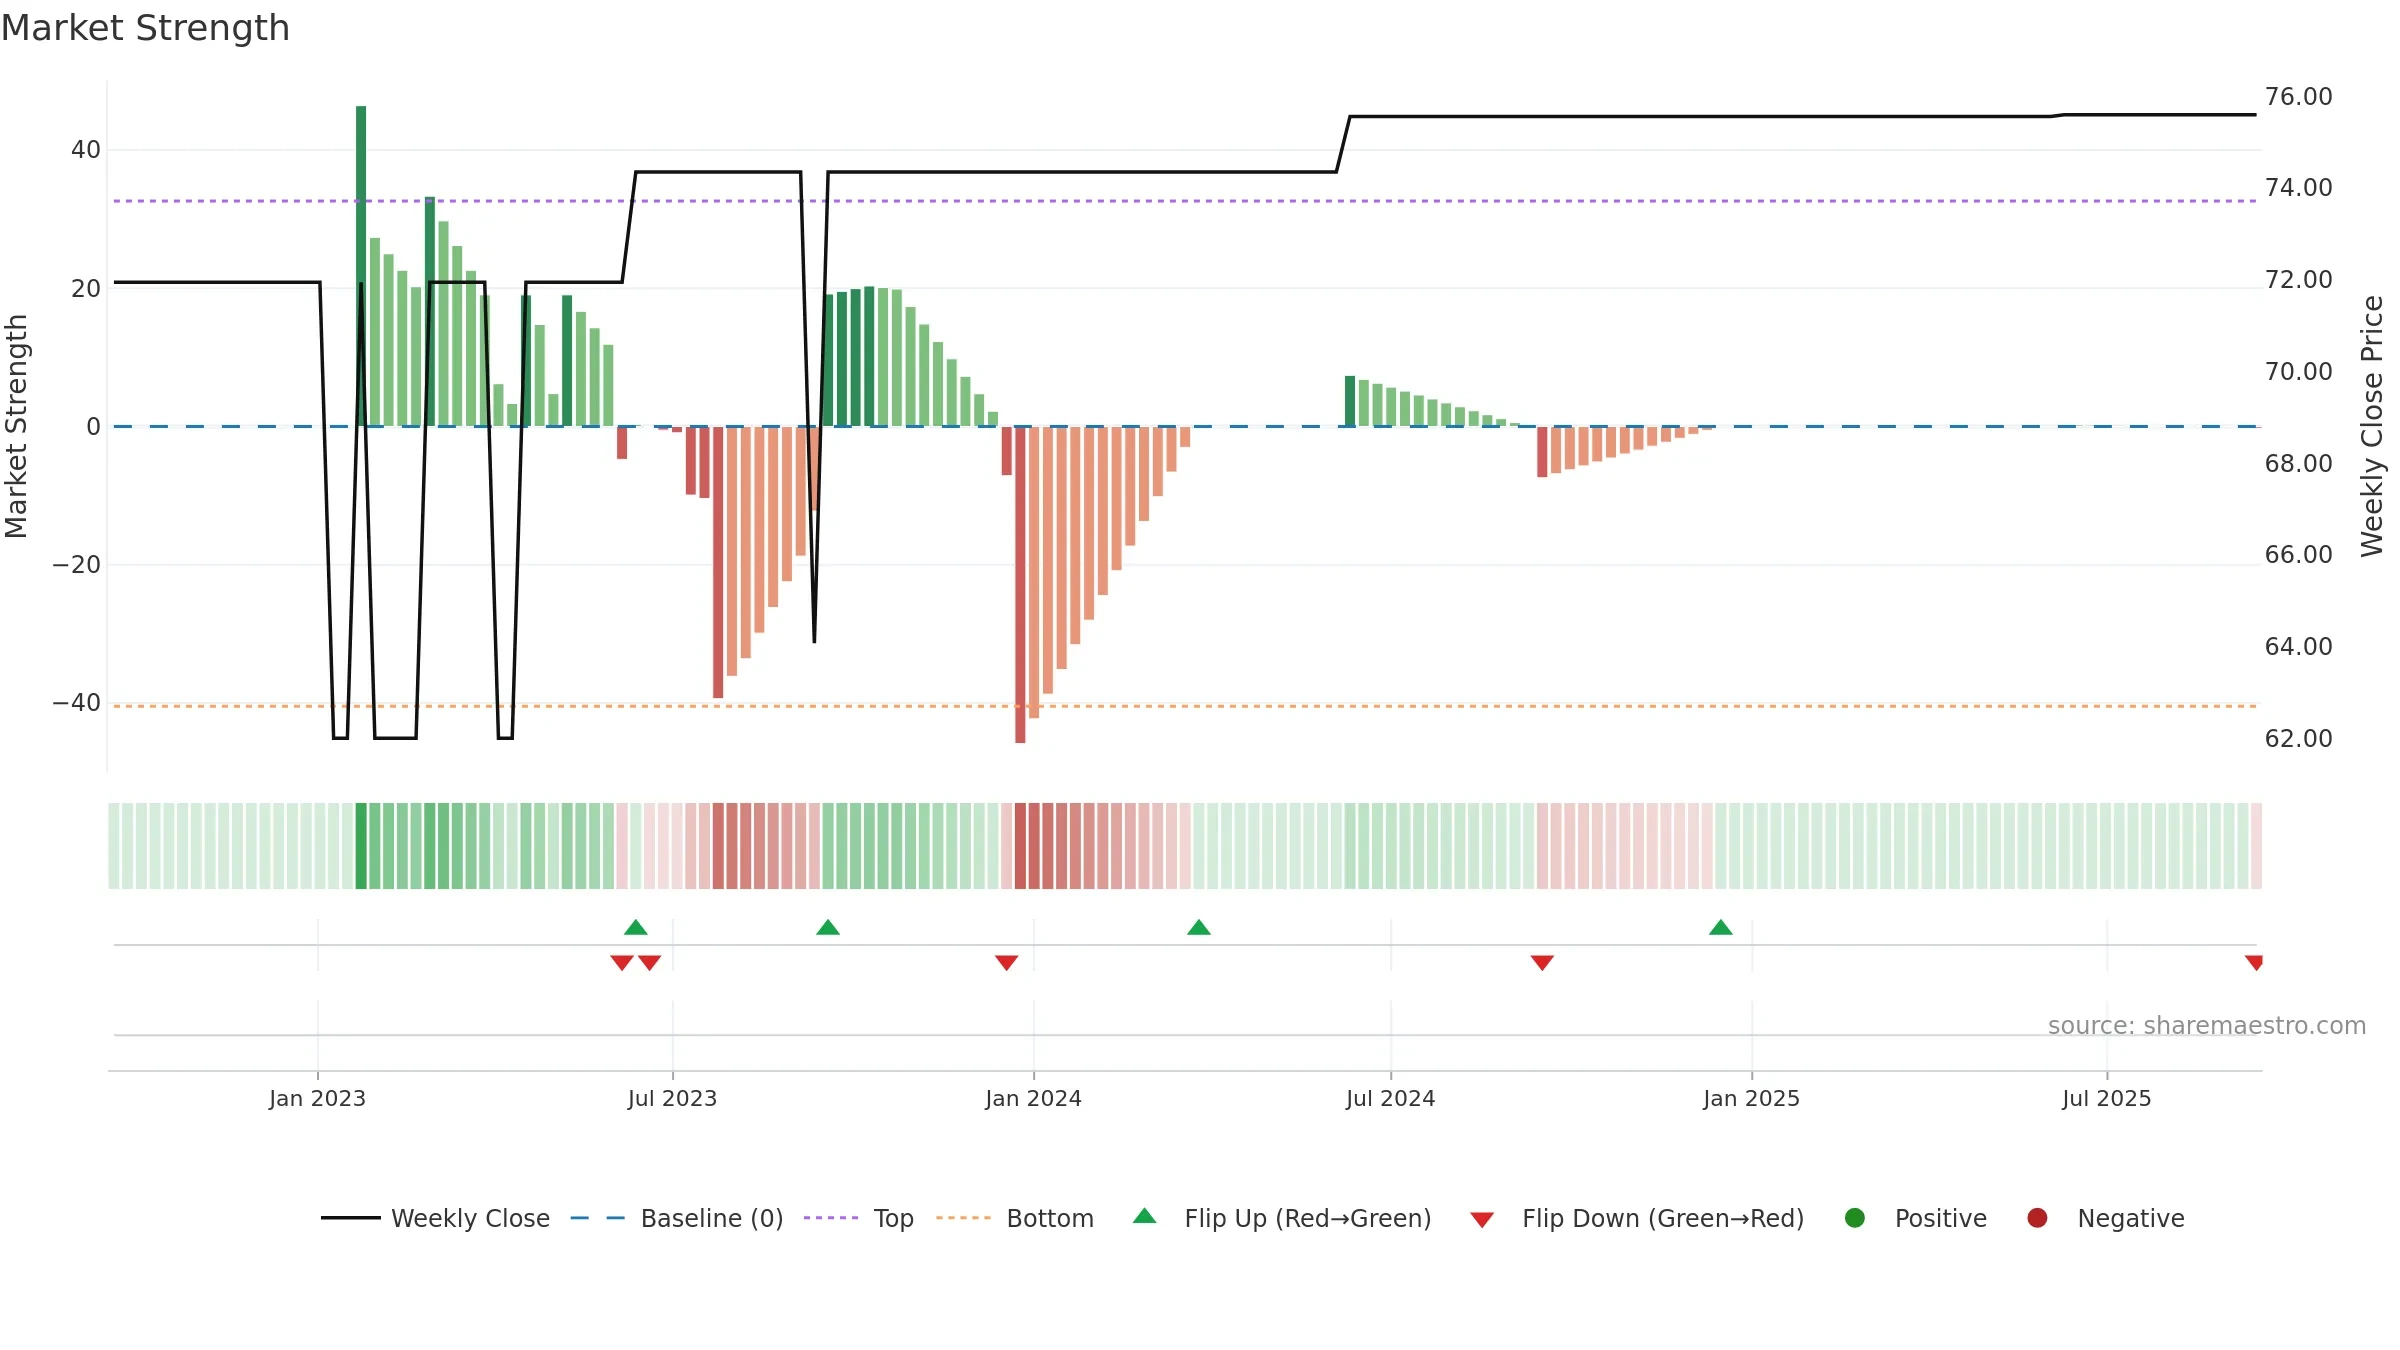
Gauge maps the trend signal to a 0–100 scale.
How to read this — High gauge and rising momentum — buyers in control.
Bias remains higher; pullbacks could be buyable if participation holds.
Price is above fair value; upside may be capped without catalysts.
Conclusion
Positive setup. ★★★★☆ confidence. Price window: 0. Trend: Strong Uptrend; gauge 60. In combination, liquidity confirmation is mixed.
- High gauge with rising momentum (strong uptrend)
- Momentum is bullish and rising
- Low return volatility supports durability
- Buyers step in at depressed levels (accumulation)
- Price is not above key averages
Why: Return volatility 0.00%. Liquidity flat with price. Trend state strong uptrend. Low-regime (≤0.25) upticks 3/4 (75.0%) • Accumulating. Momentum bullish and rising. Valuation limited upside without catalysts.
Tip: Most metrics include a hover tooltip where they appear in the report.