Wall to Wall Group AB
WTW-A STO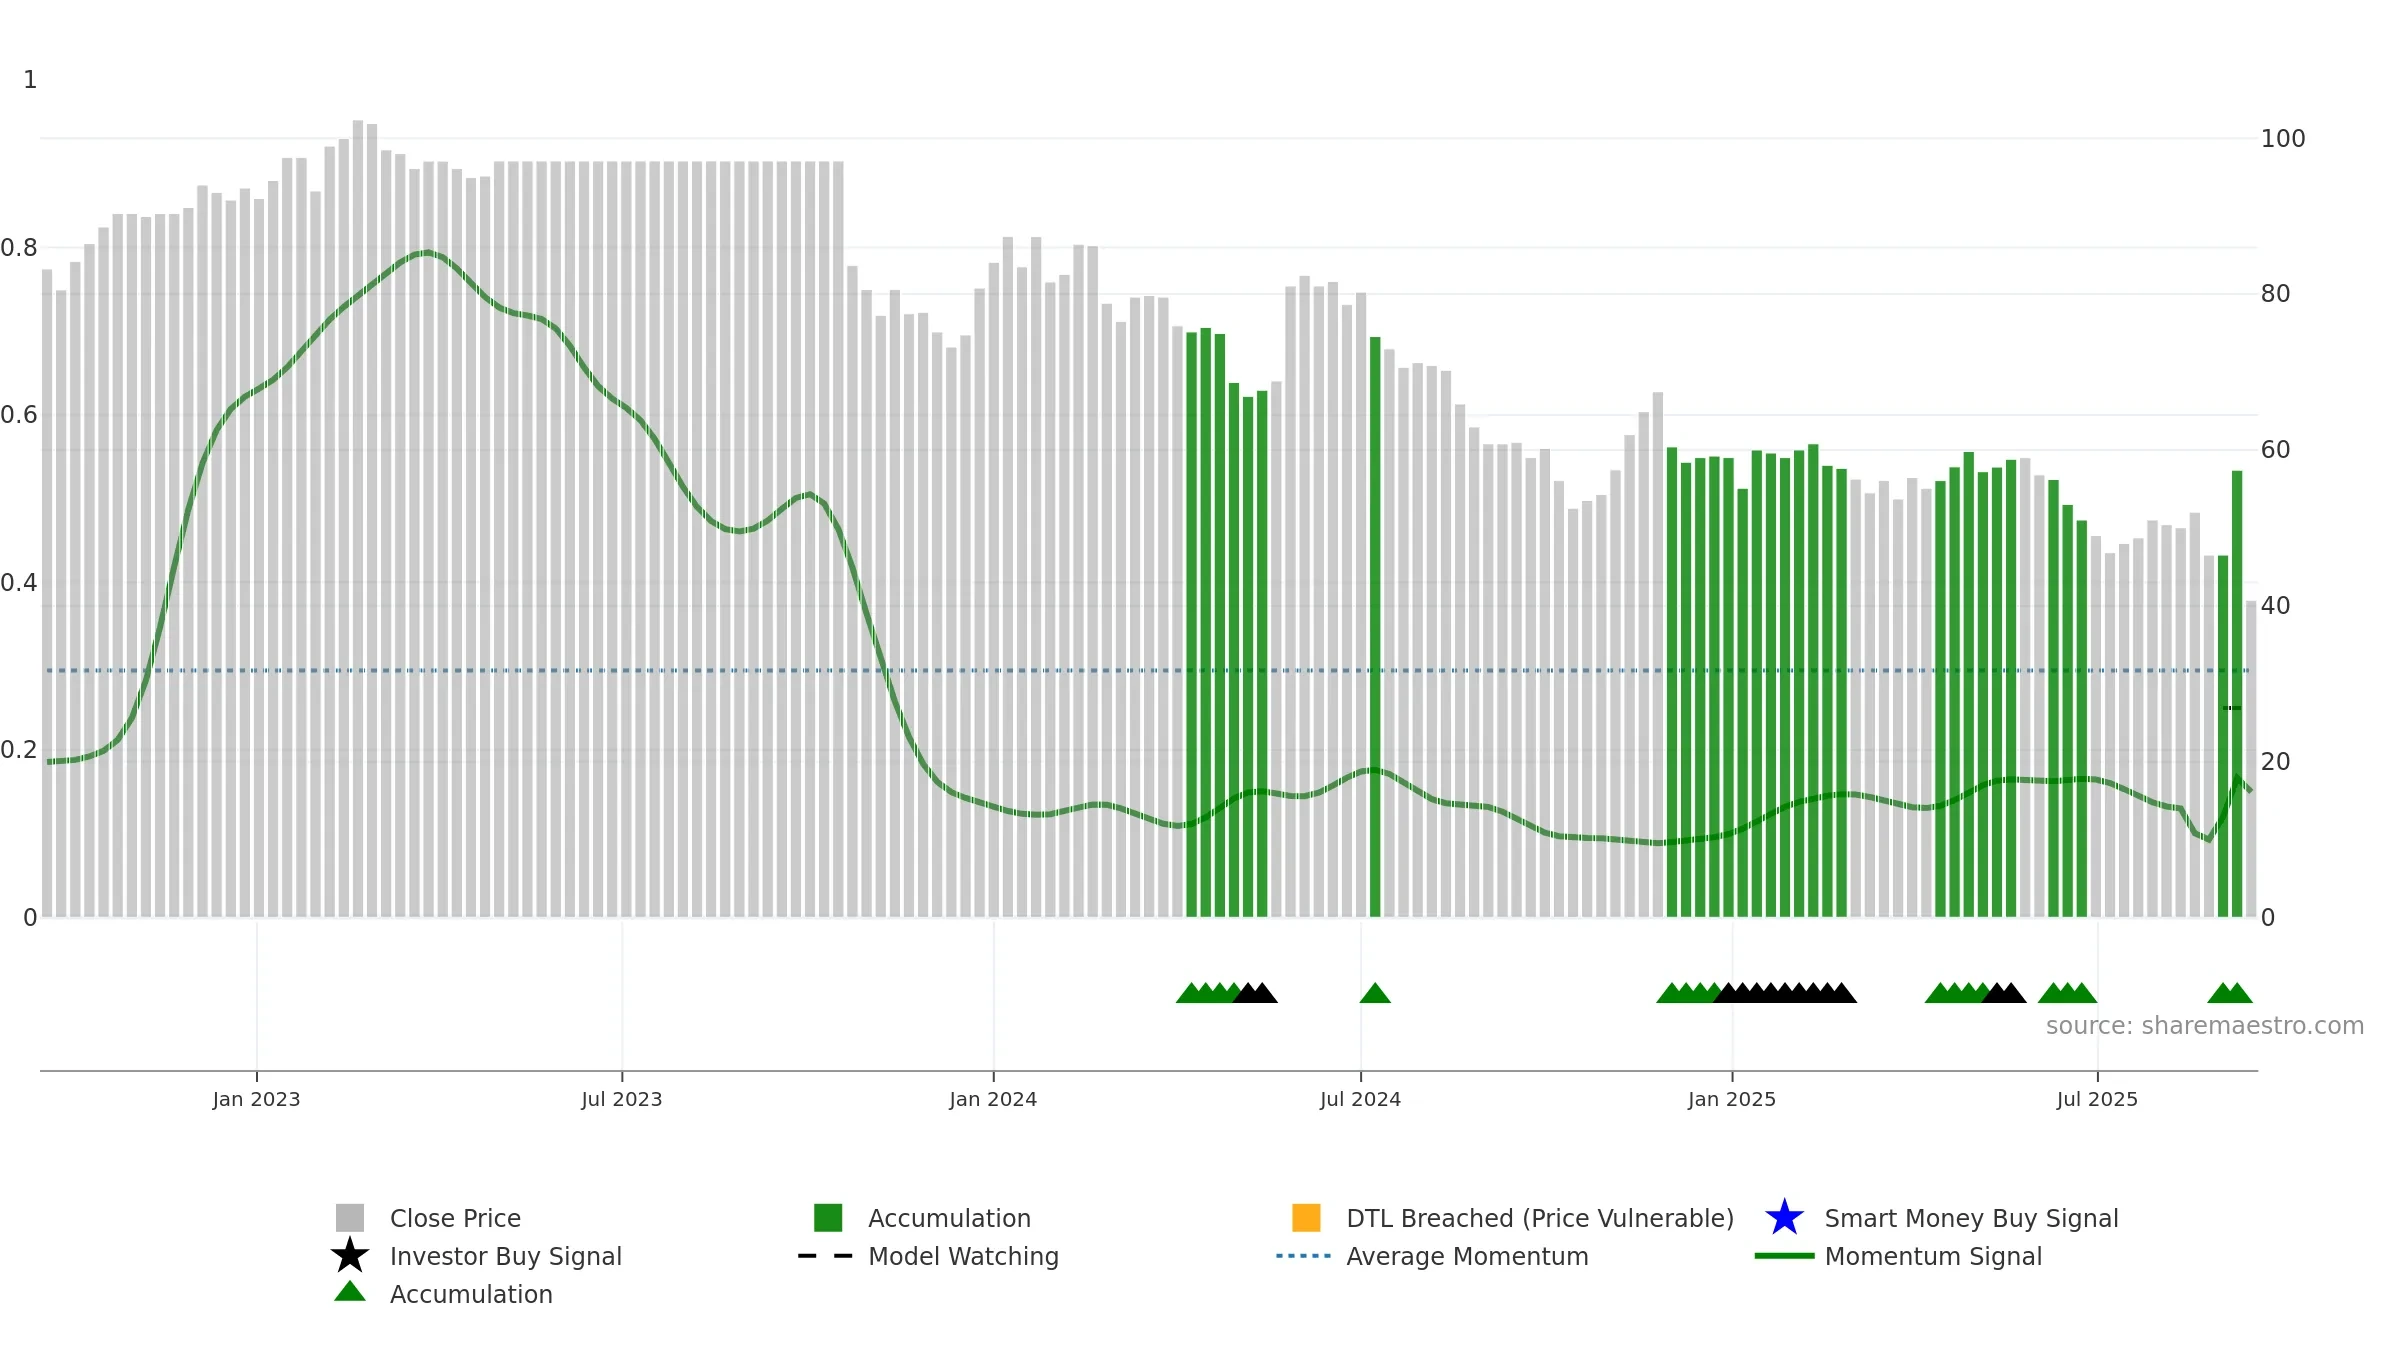
Weekly Report
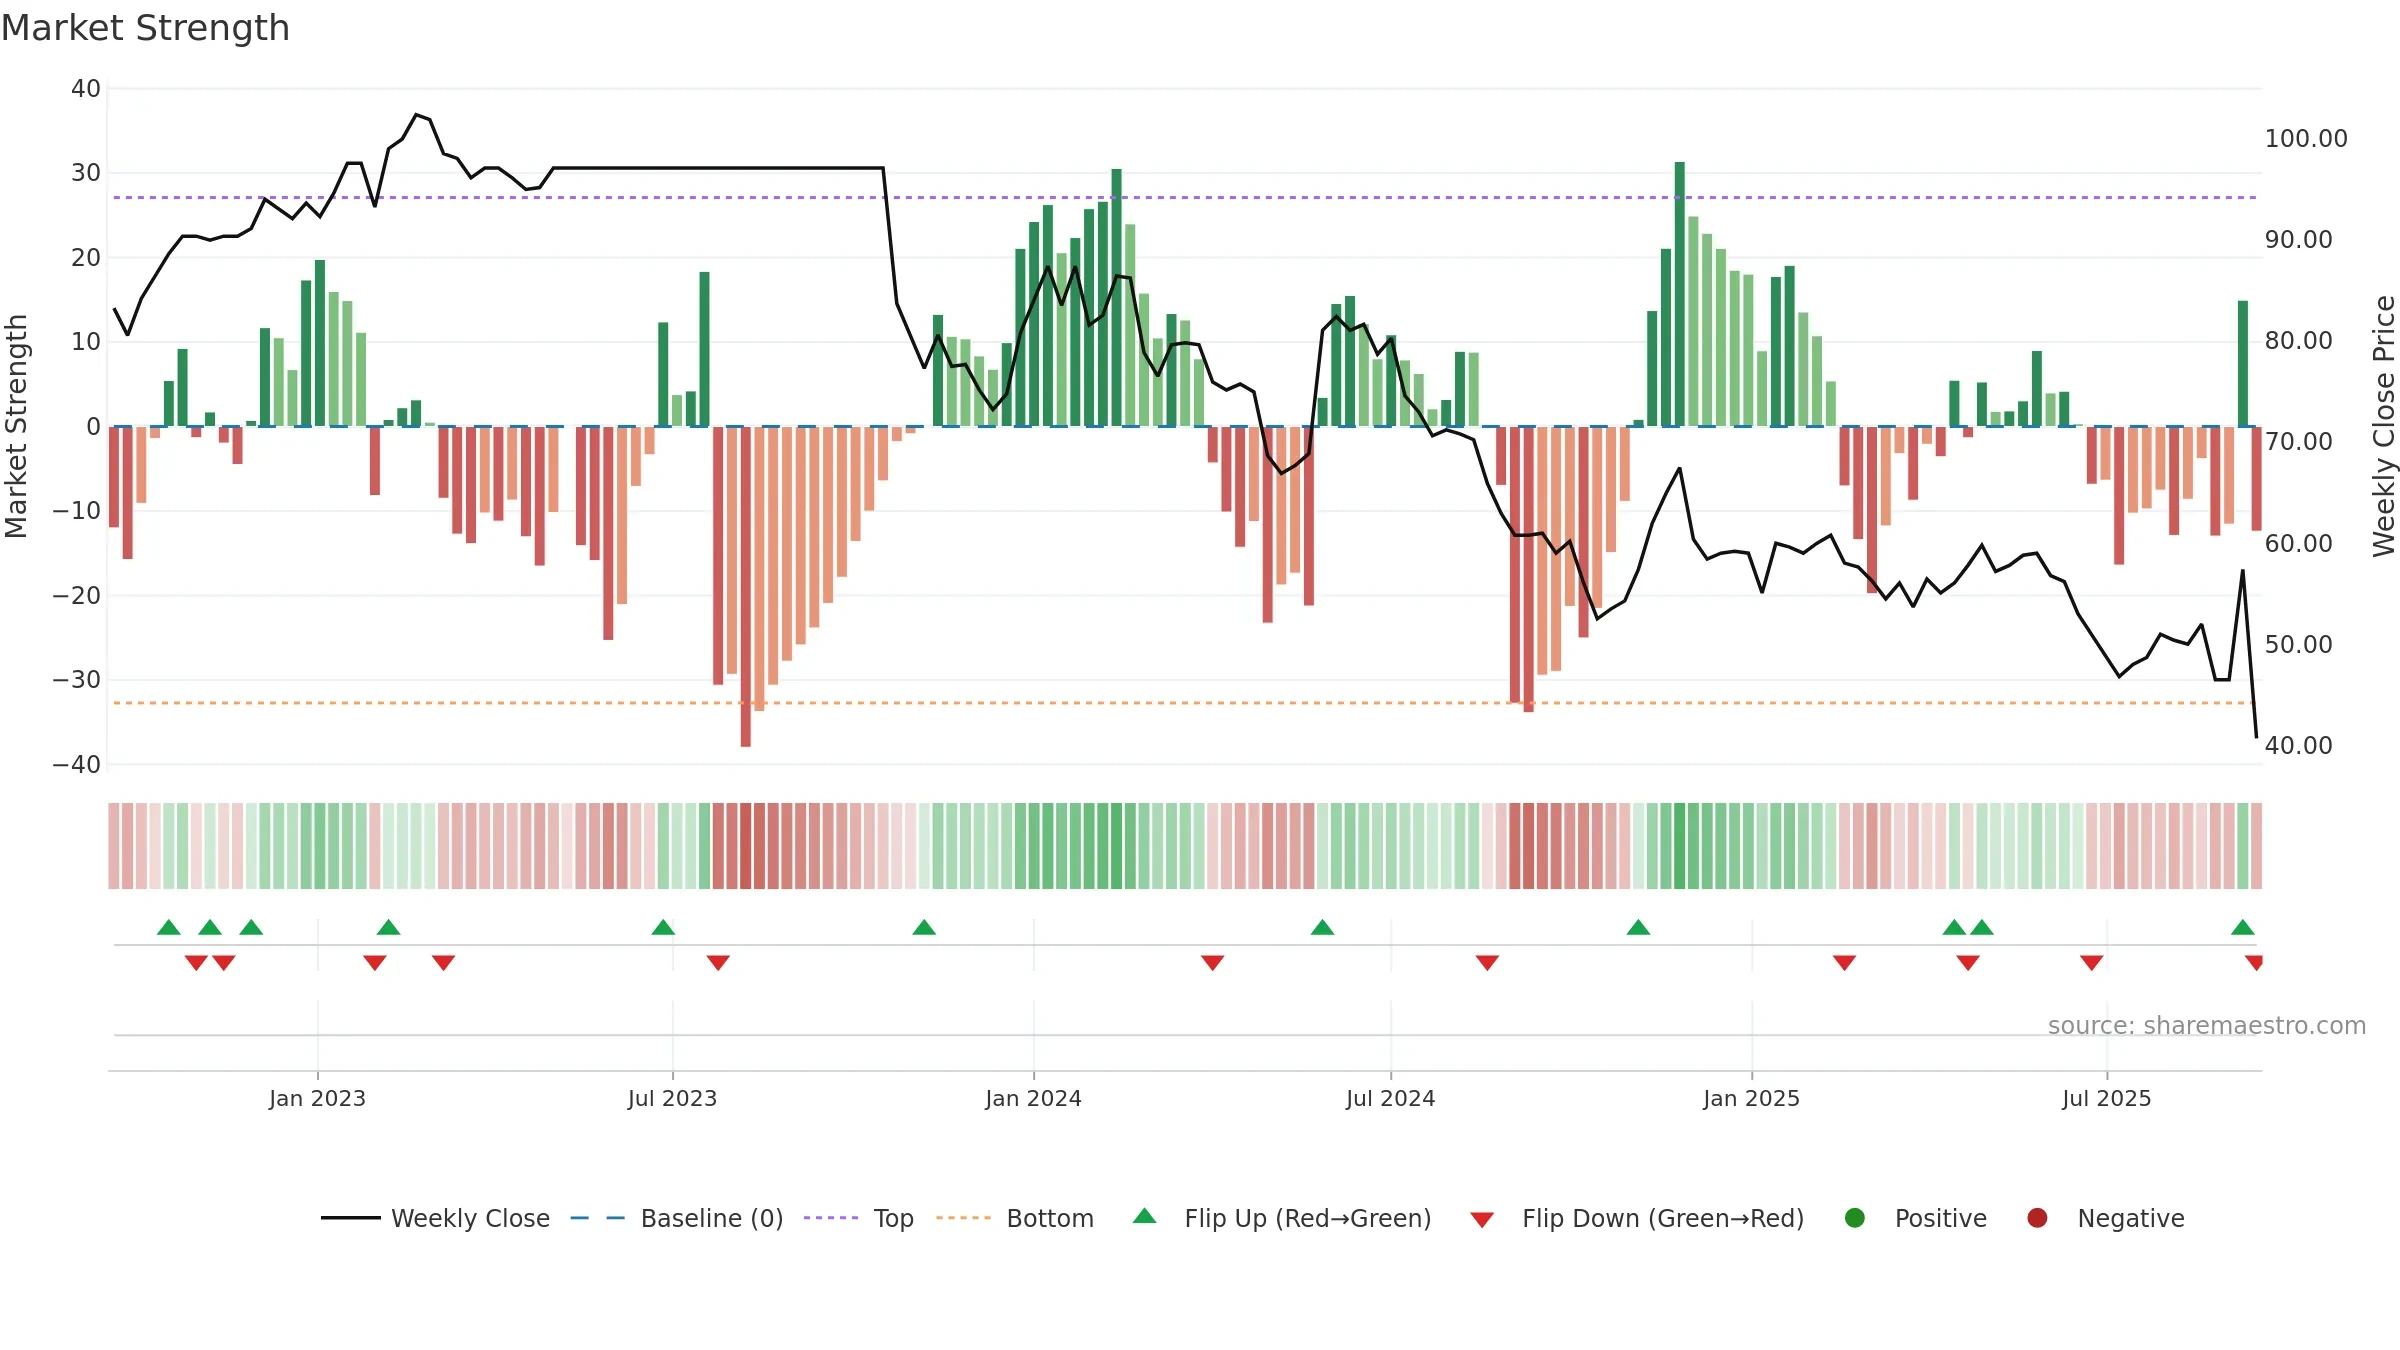
Wall to Wall Group AB closed at 40.7000 (0.00% WoW) . Data window ends Mon, 15 Sep 2025.
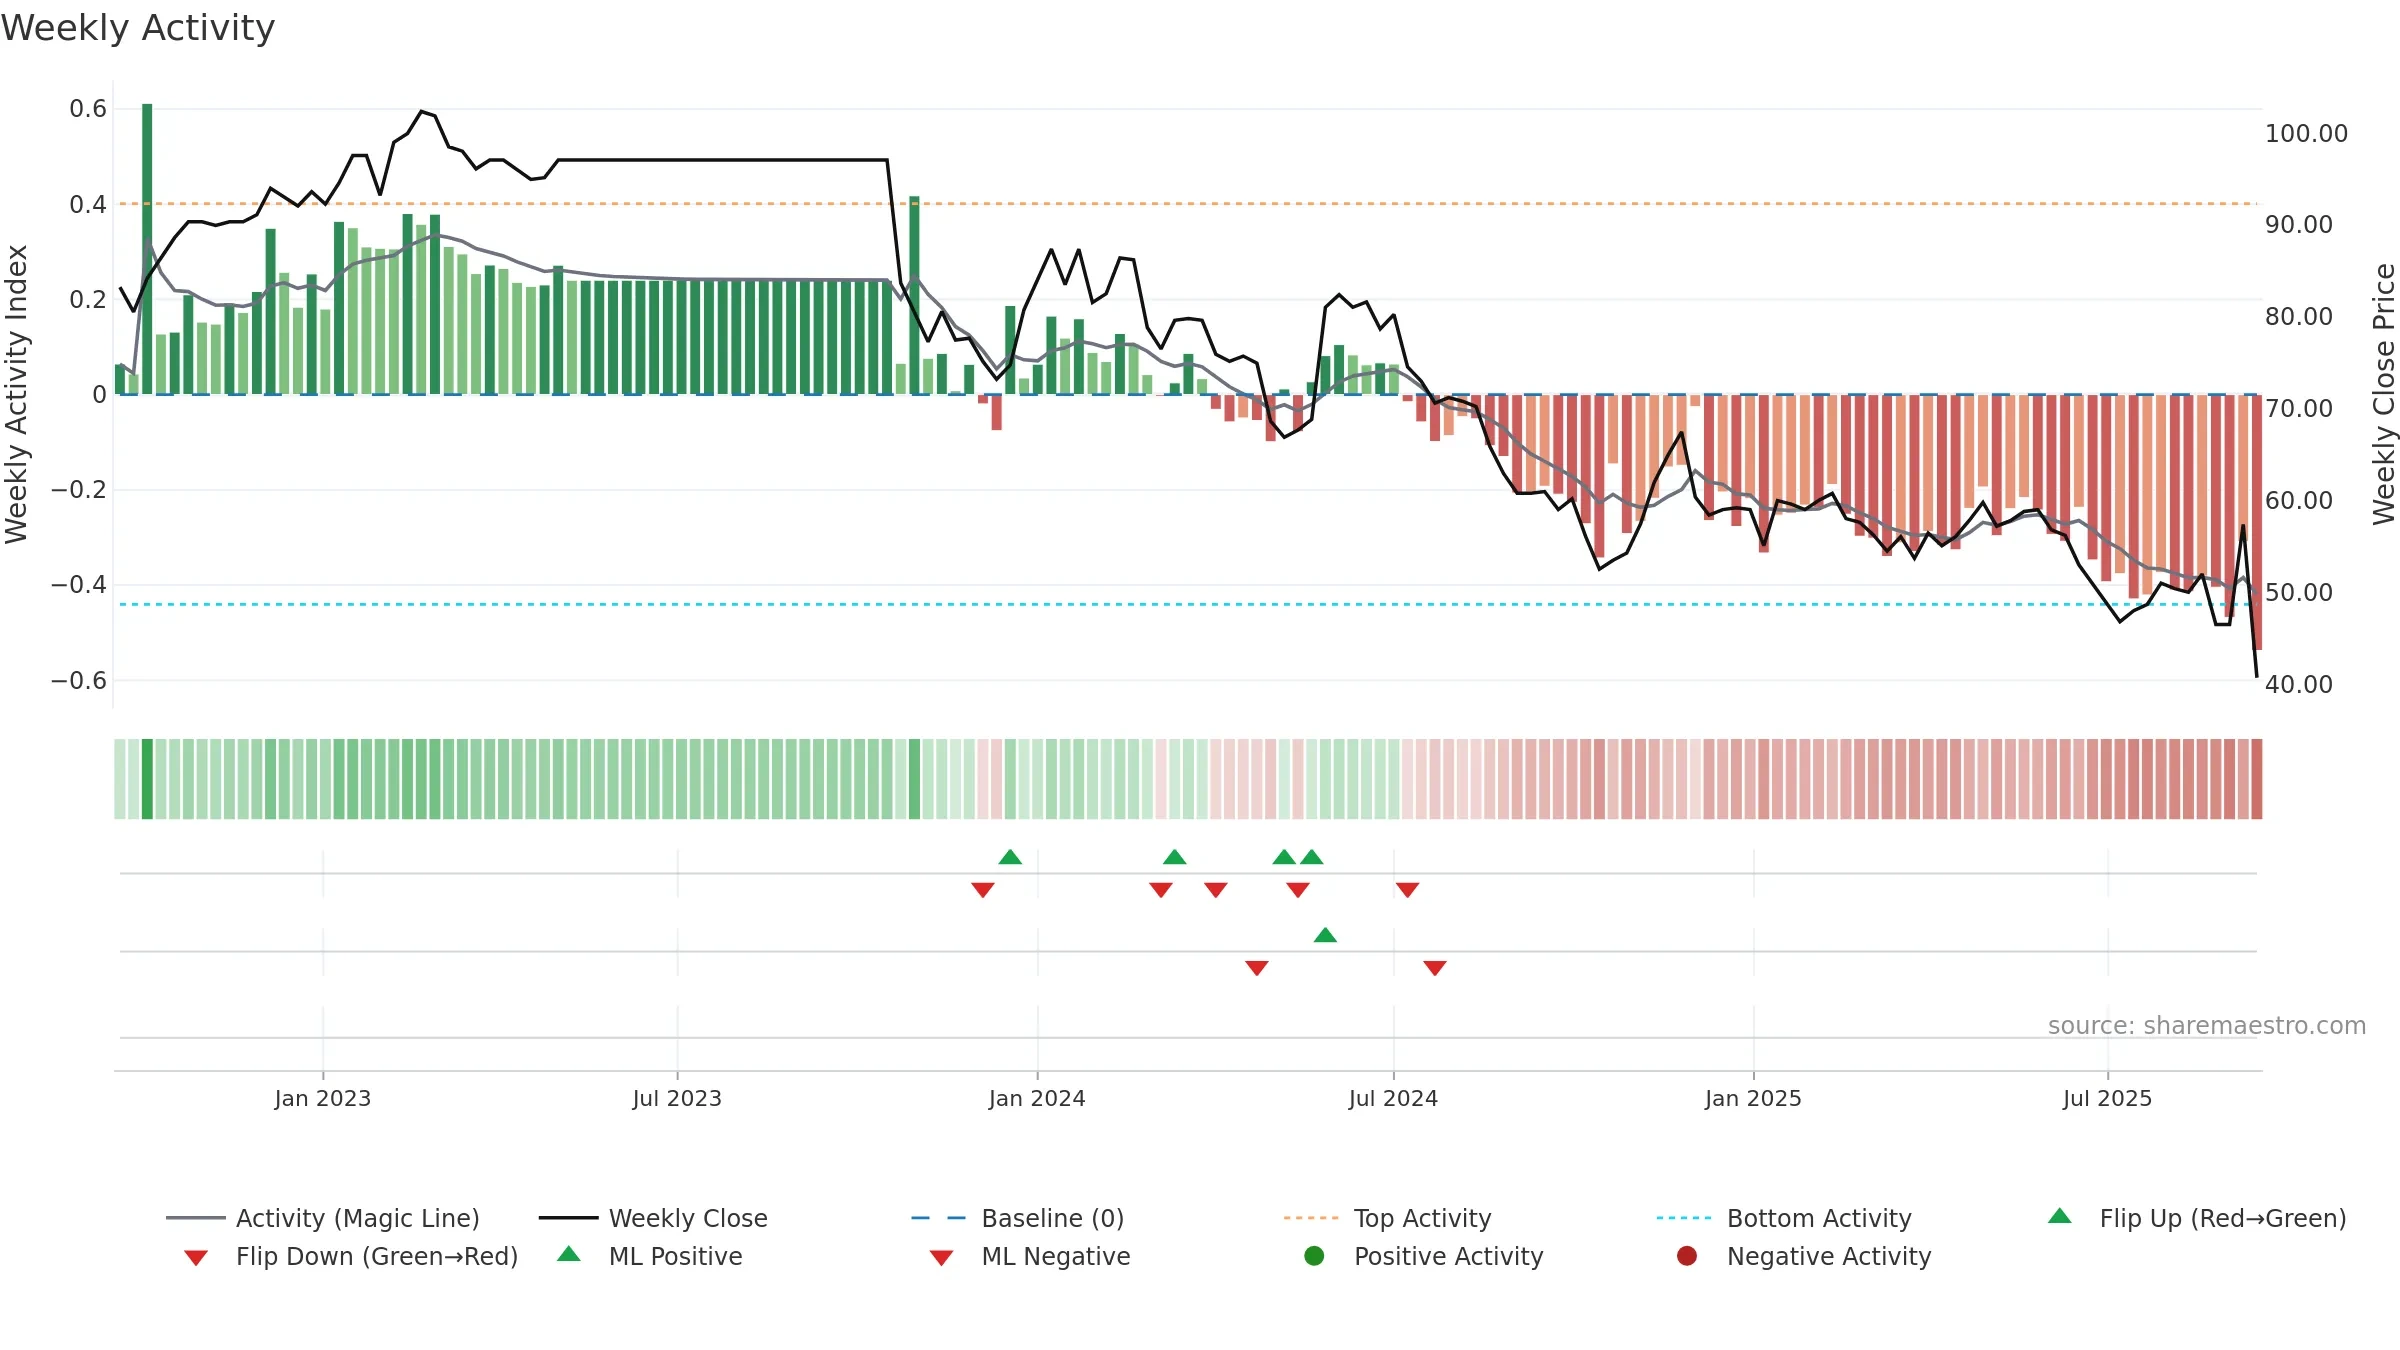
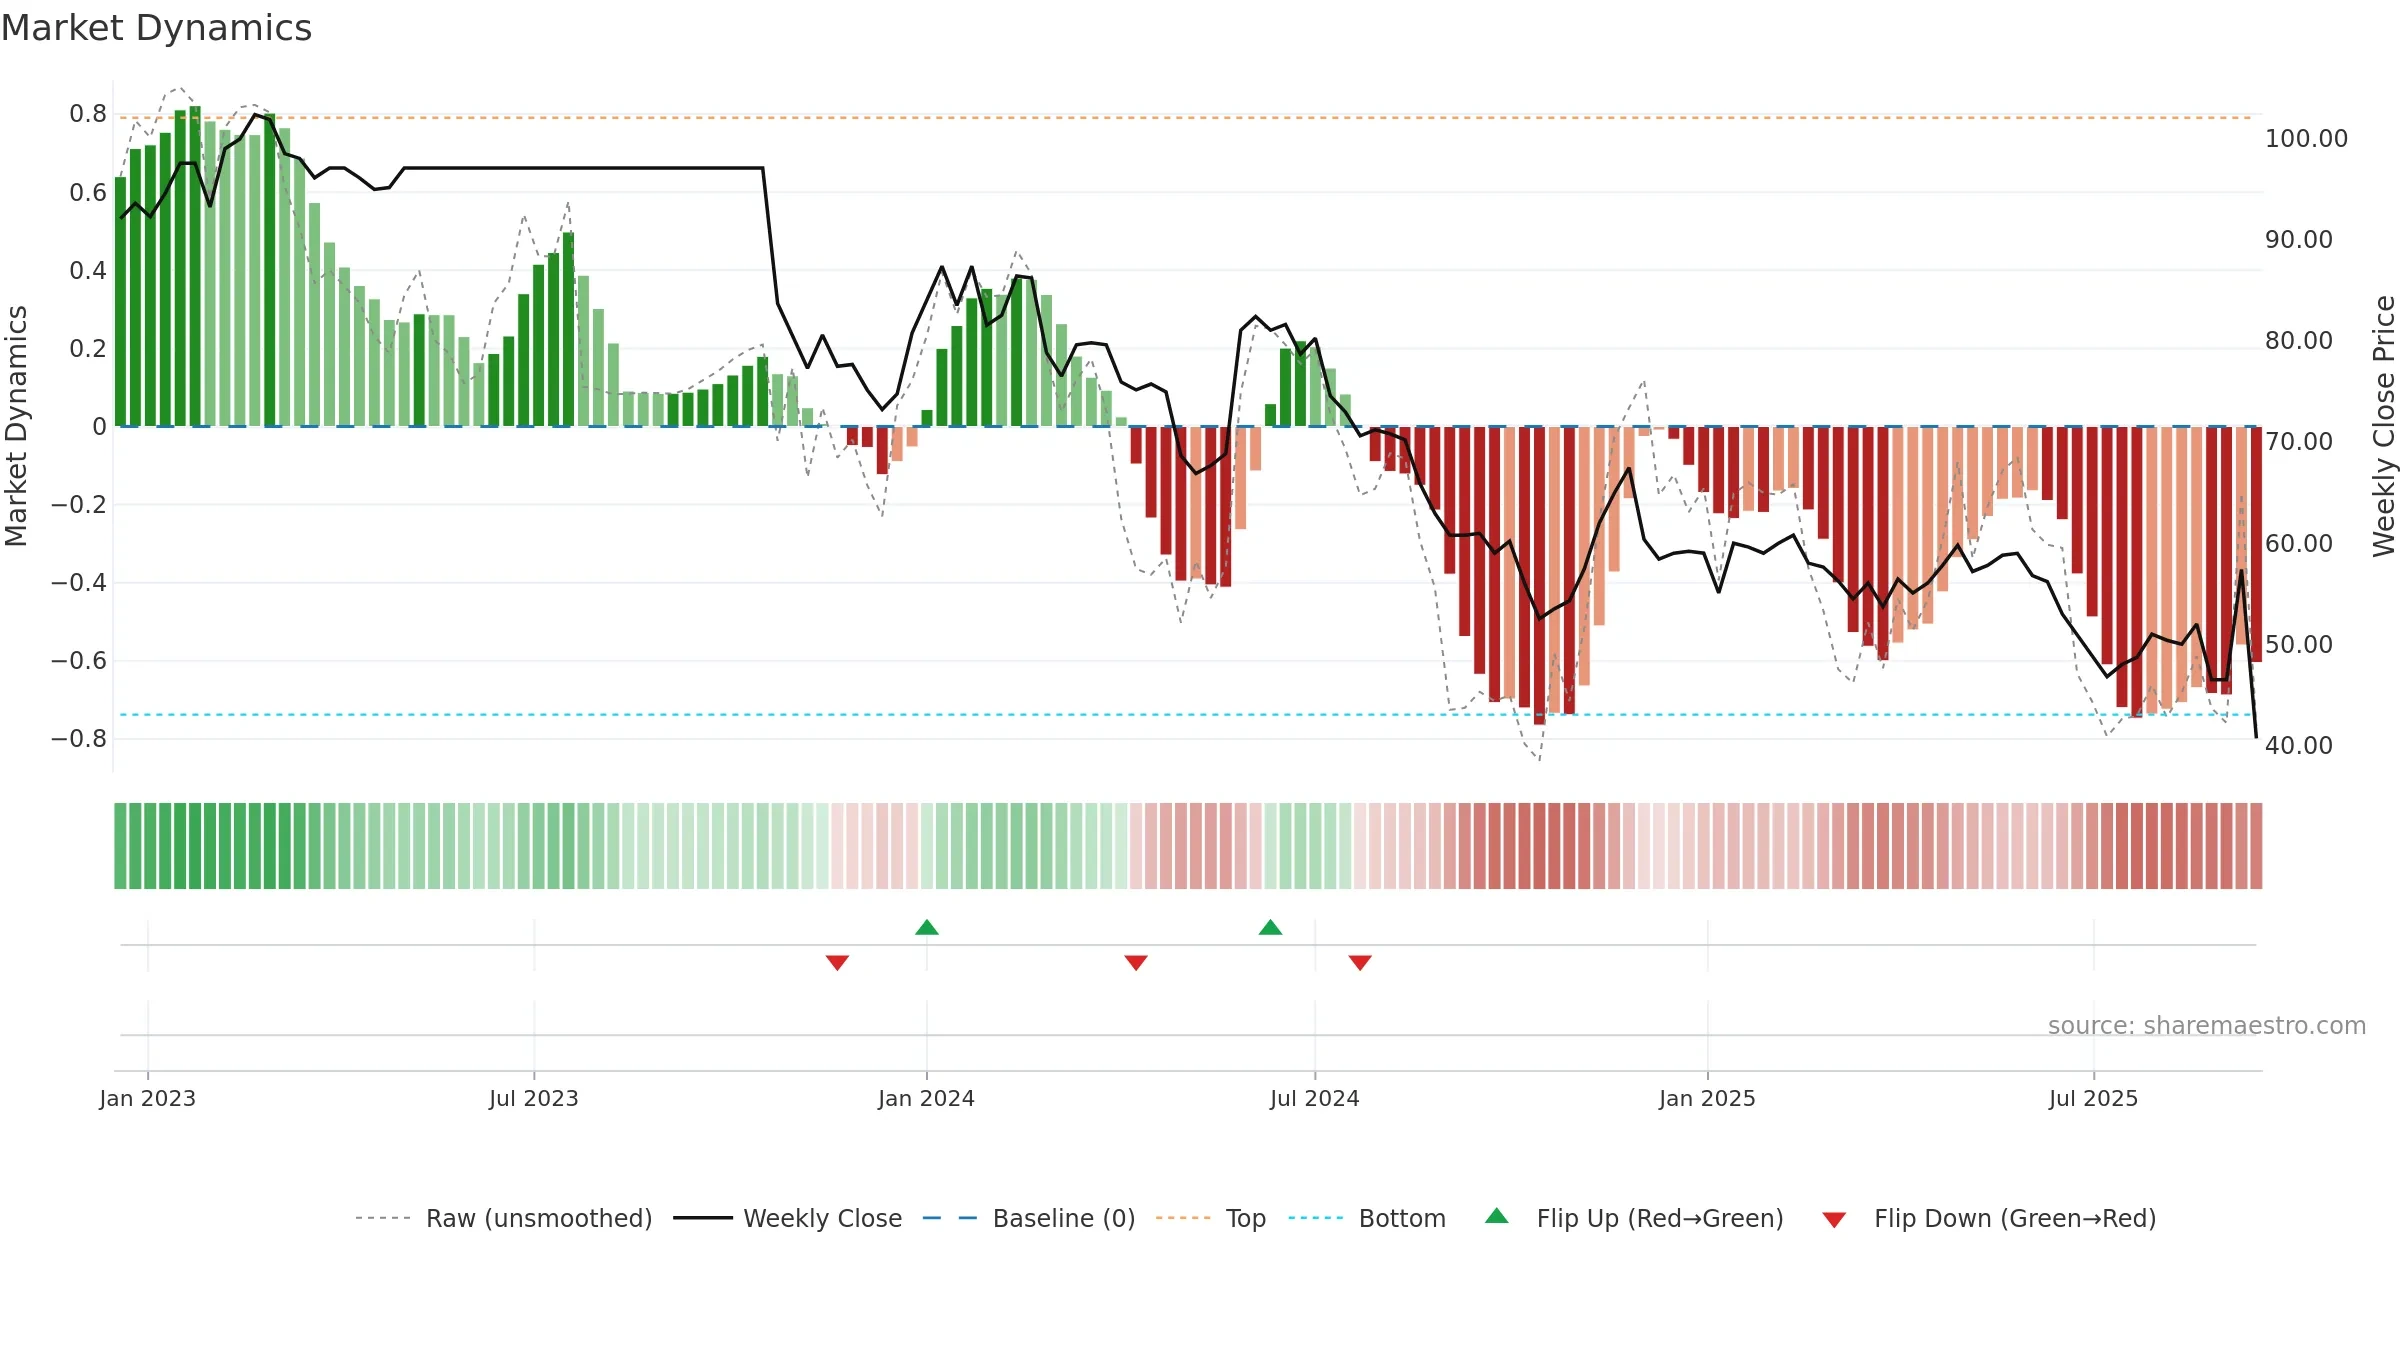
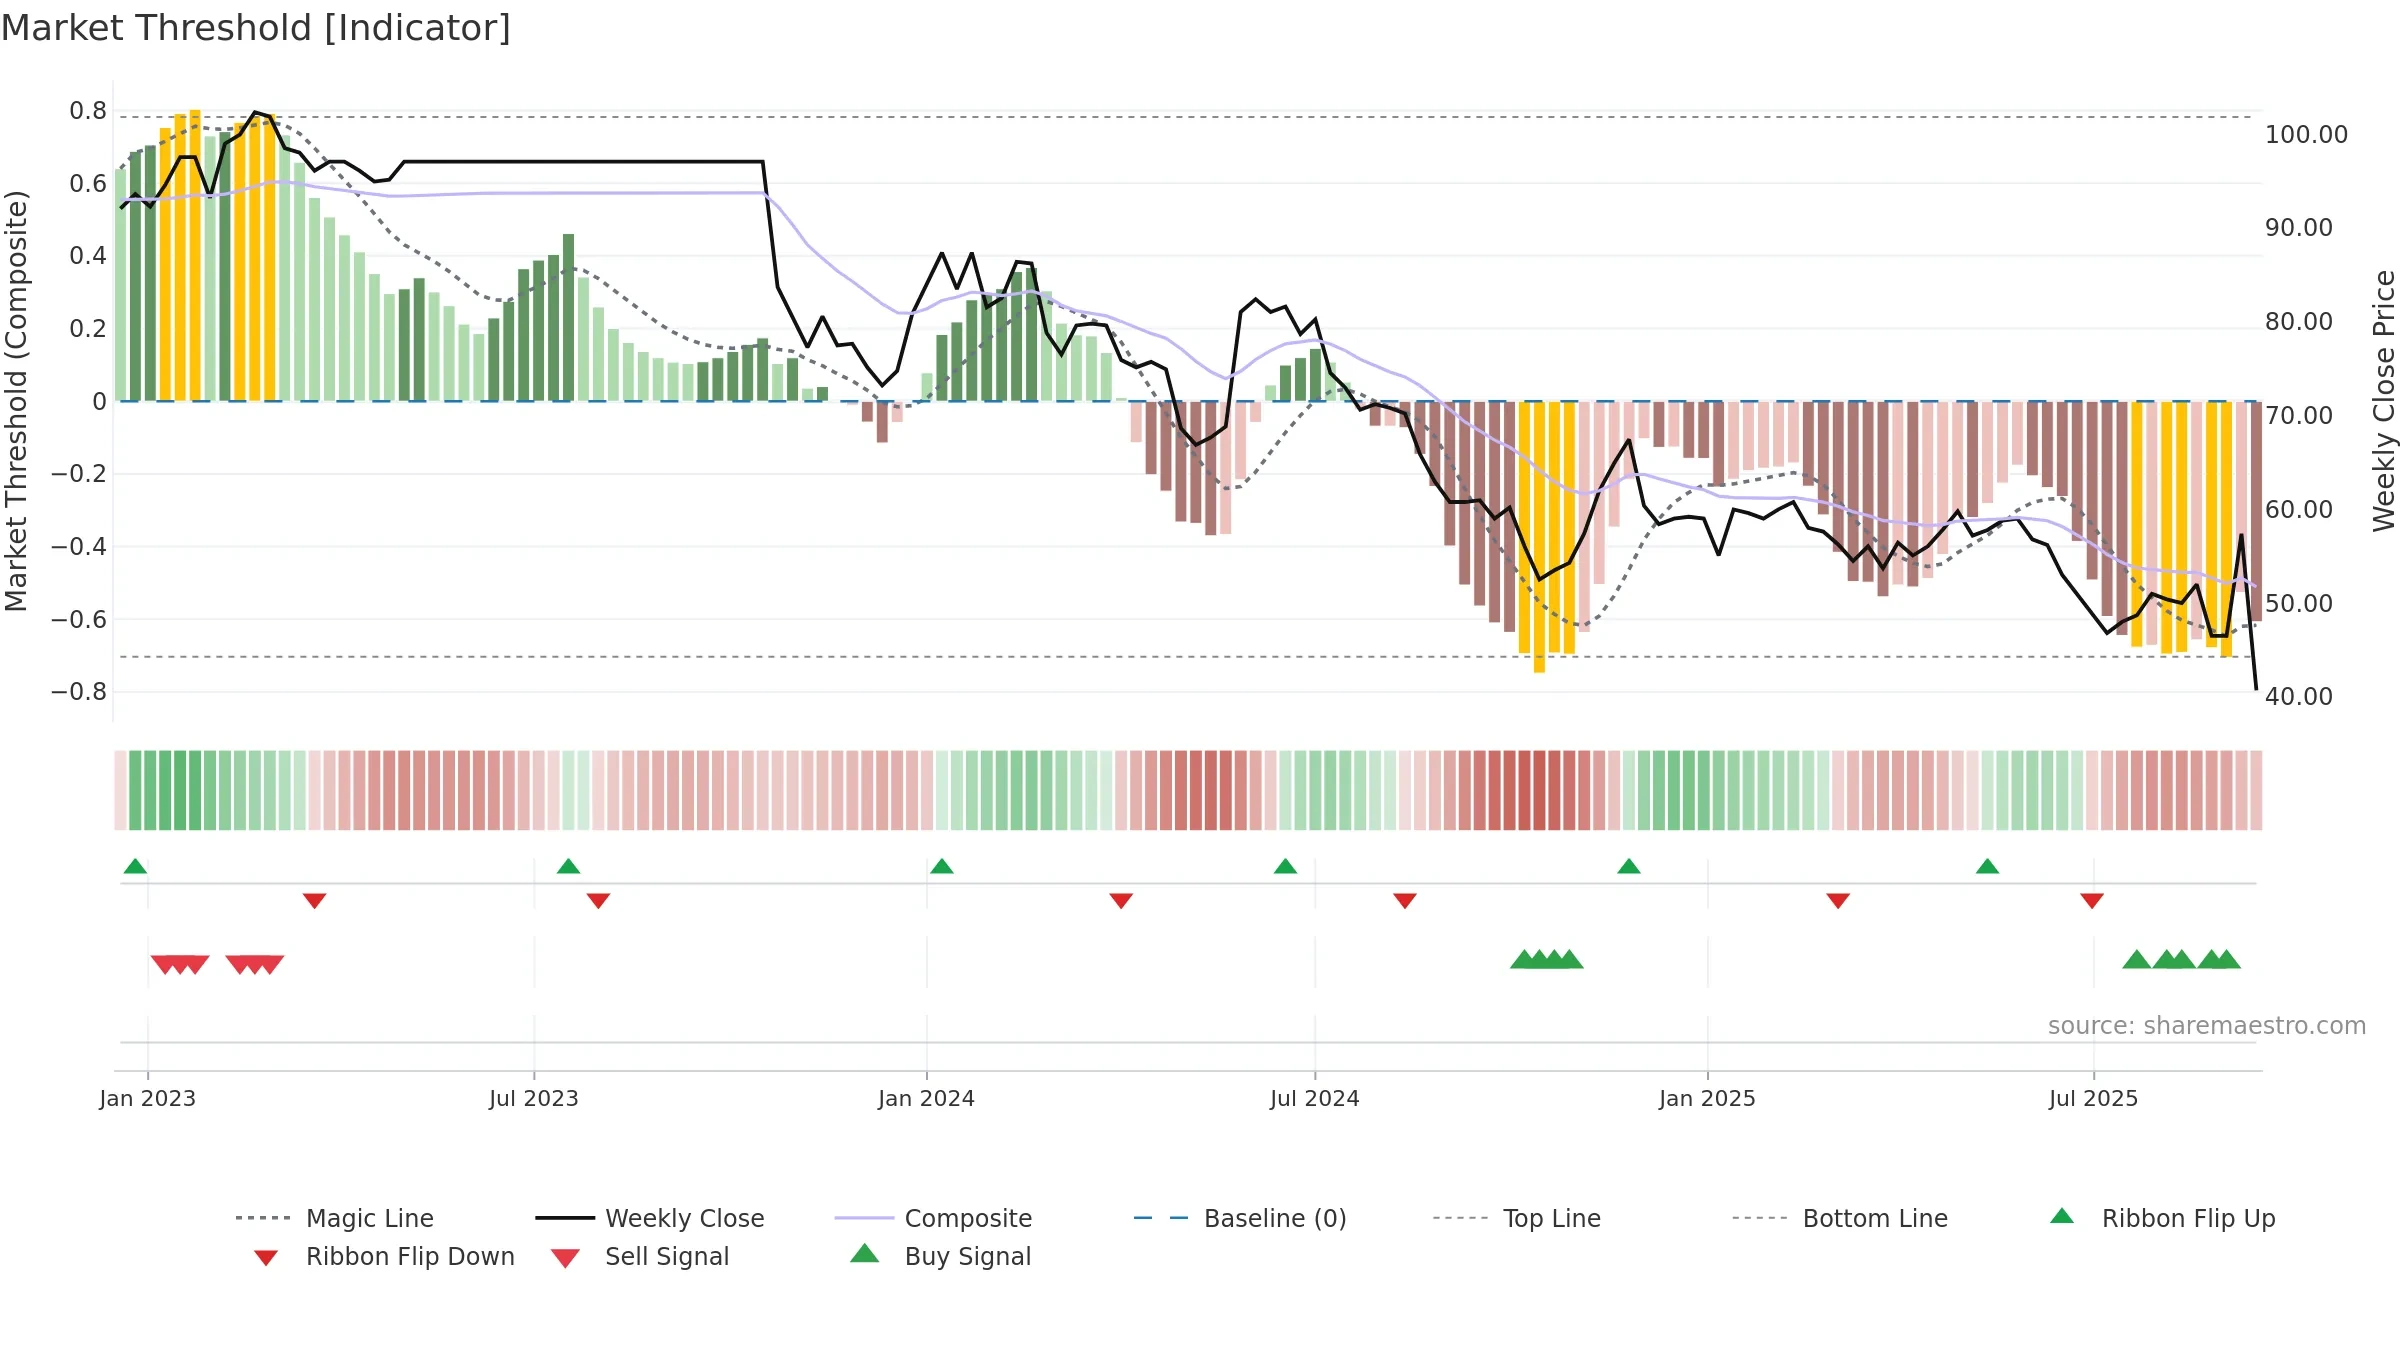
How to read this — Price slope is downward, indicating persistent supply pressure. Elevated weekly volatility increases whipsaw risk. Volume and price are moving in the same direction — a constructive confirmation. Returns are negatively correlated with volume — strength may come on lighter activity. Price is extended below its baseline; rebounds can be sharp if demand improves. Fresh short-term downside crossover weakens near-term tone. Price sits below key averages, keeping pressure on the tape.
Down-slope argues for patience; rallies can fade sooner unless participation improves.
Gauge maps the trend signal to a 0–100 scale.
How to read this — Range-bound conditions; conviction is limited until a break or acceleration emerges.
Wait for a directional break or improving acceleration.
Conclusion
Neutral setup. ★★★☆☆ confidence. Price window: -20. Trend: Range / Neutral; gauge 15. In combination, liquidity confirms the move.
- Liquidity confirms the price trend
- Price is not above key averages
- High return volatility raises whipsaw risk
- Negative multi-week performance
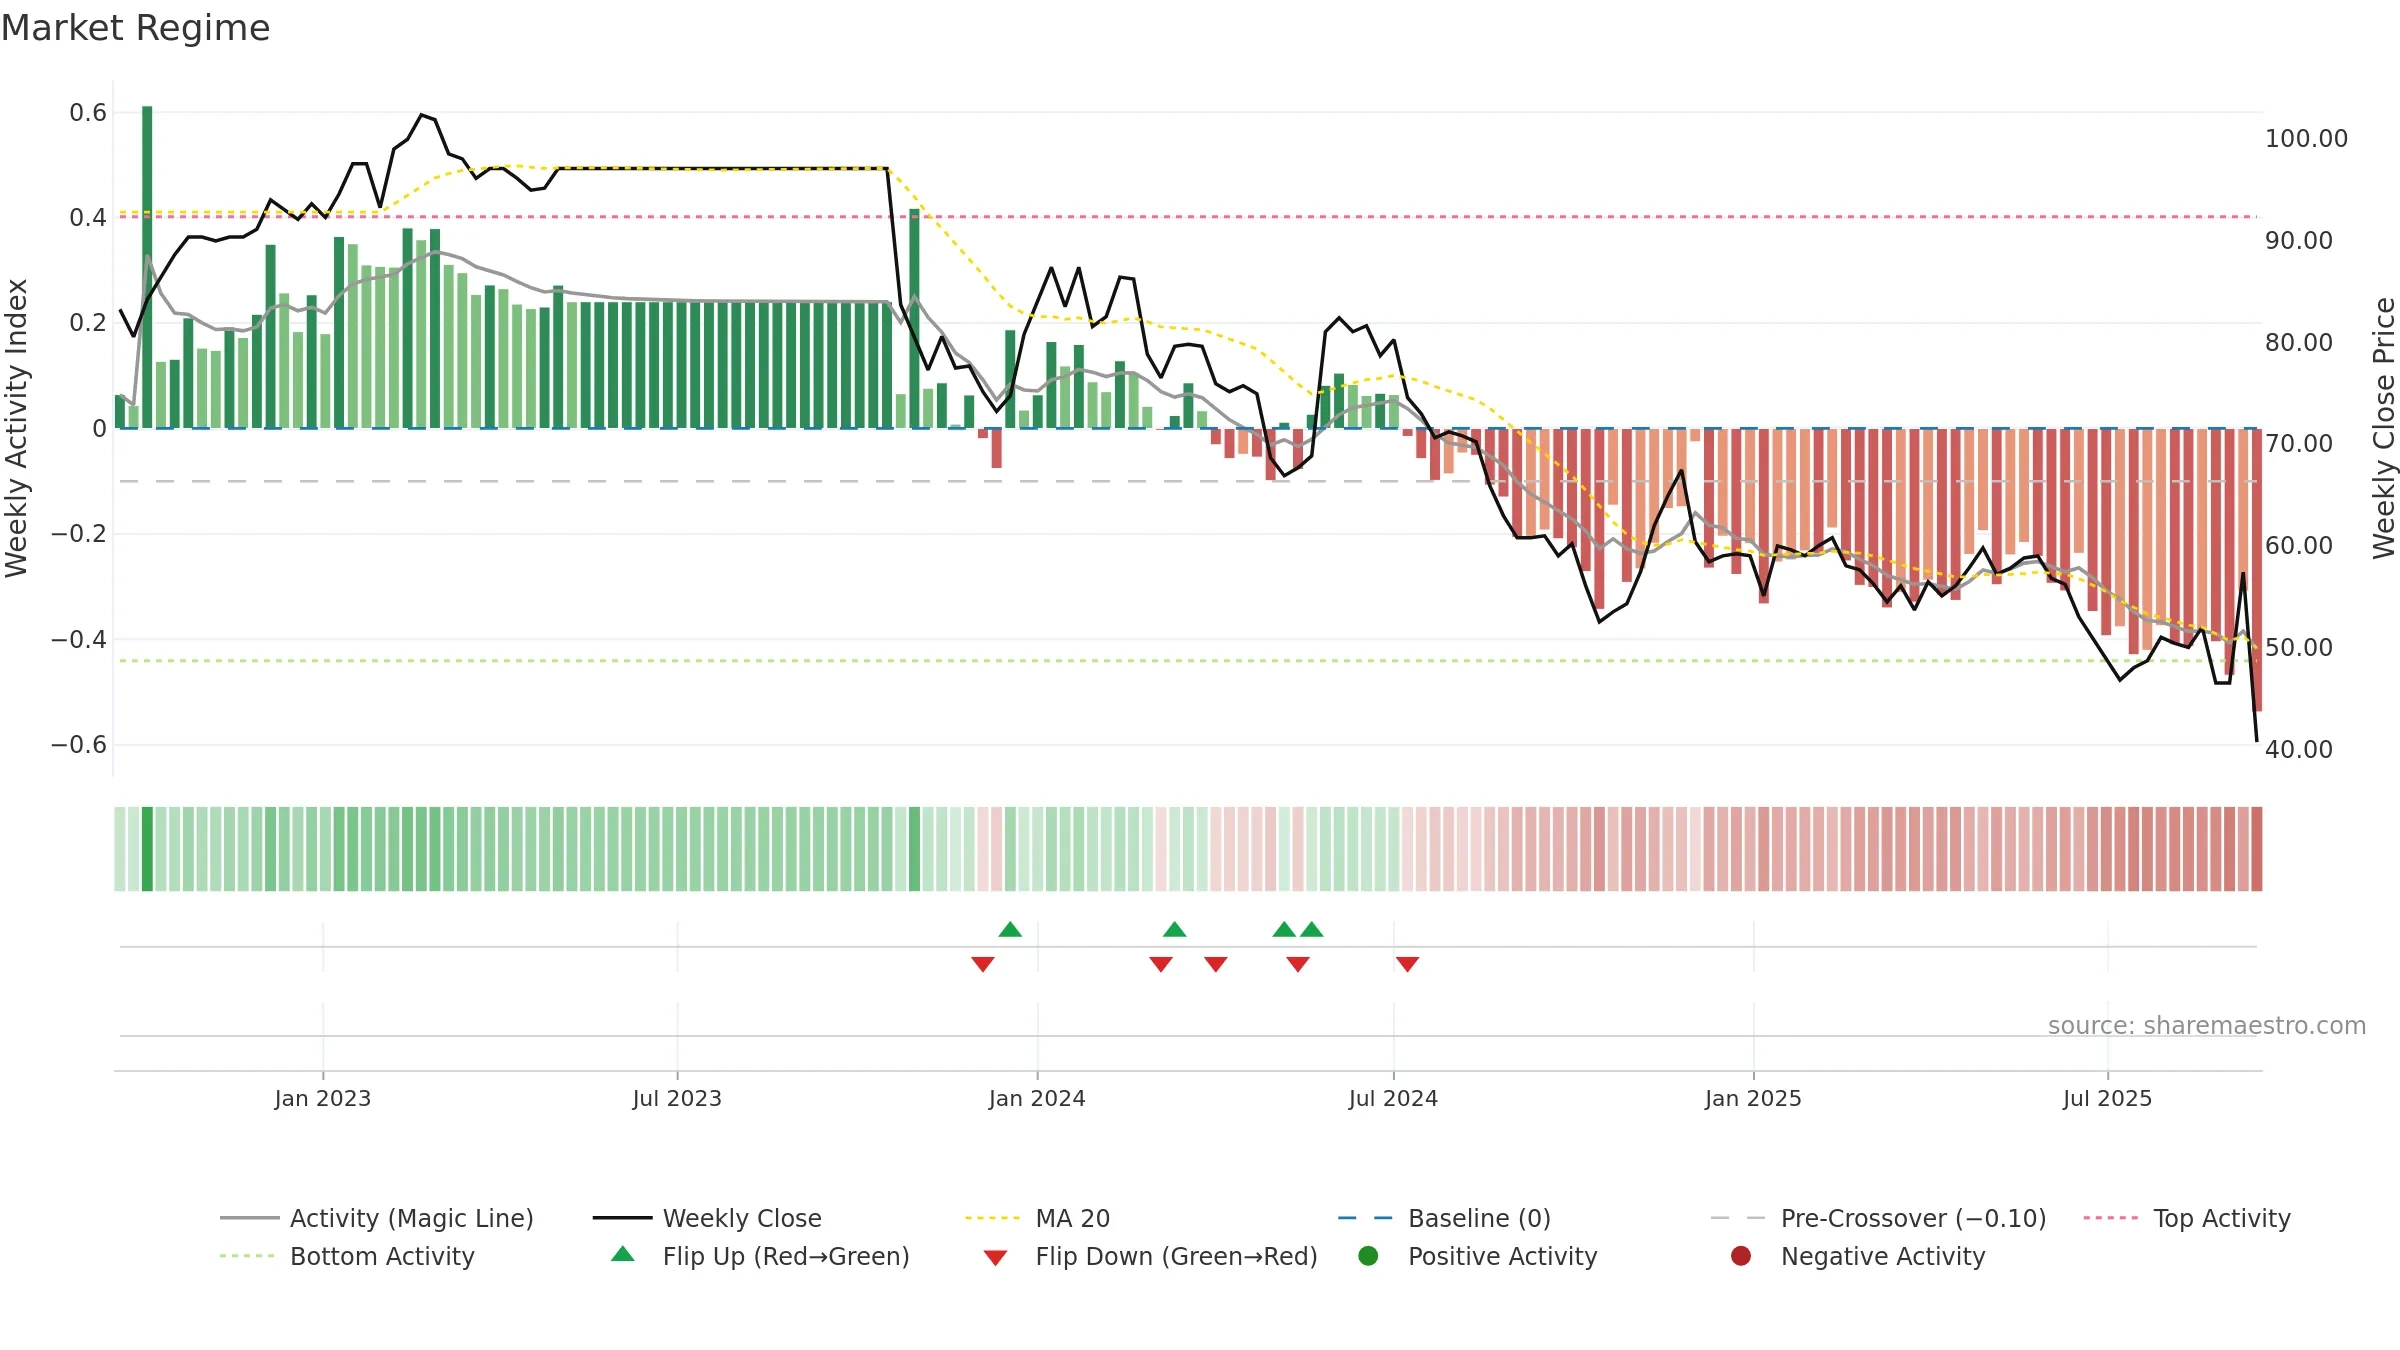
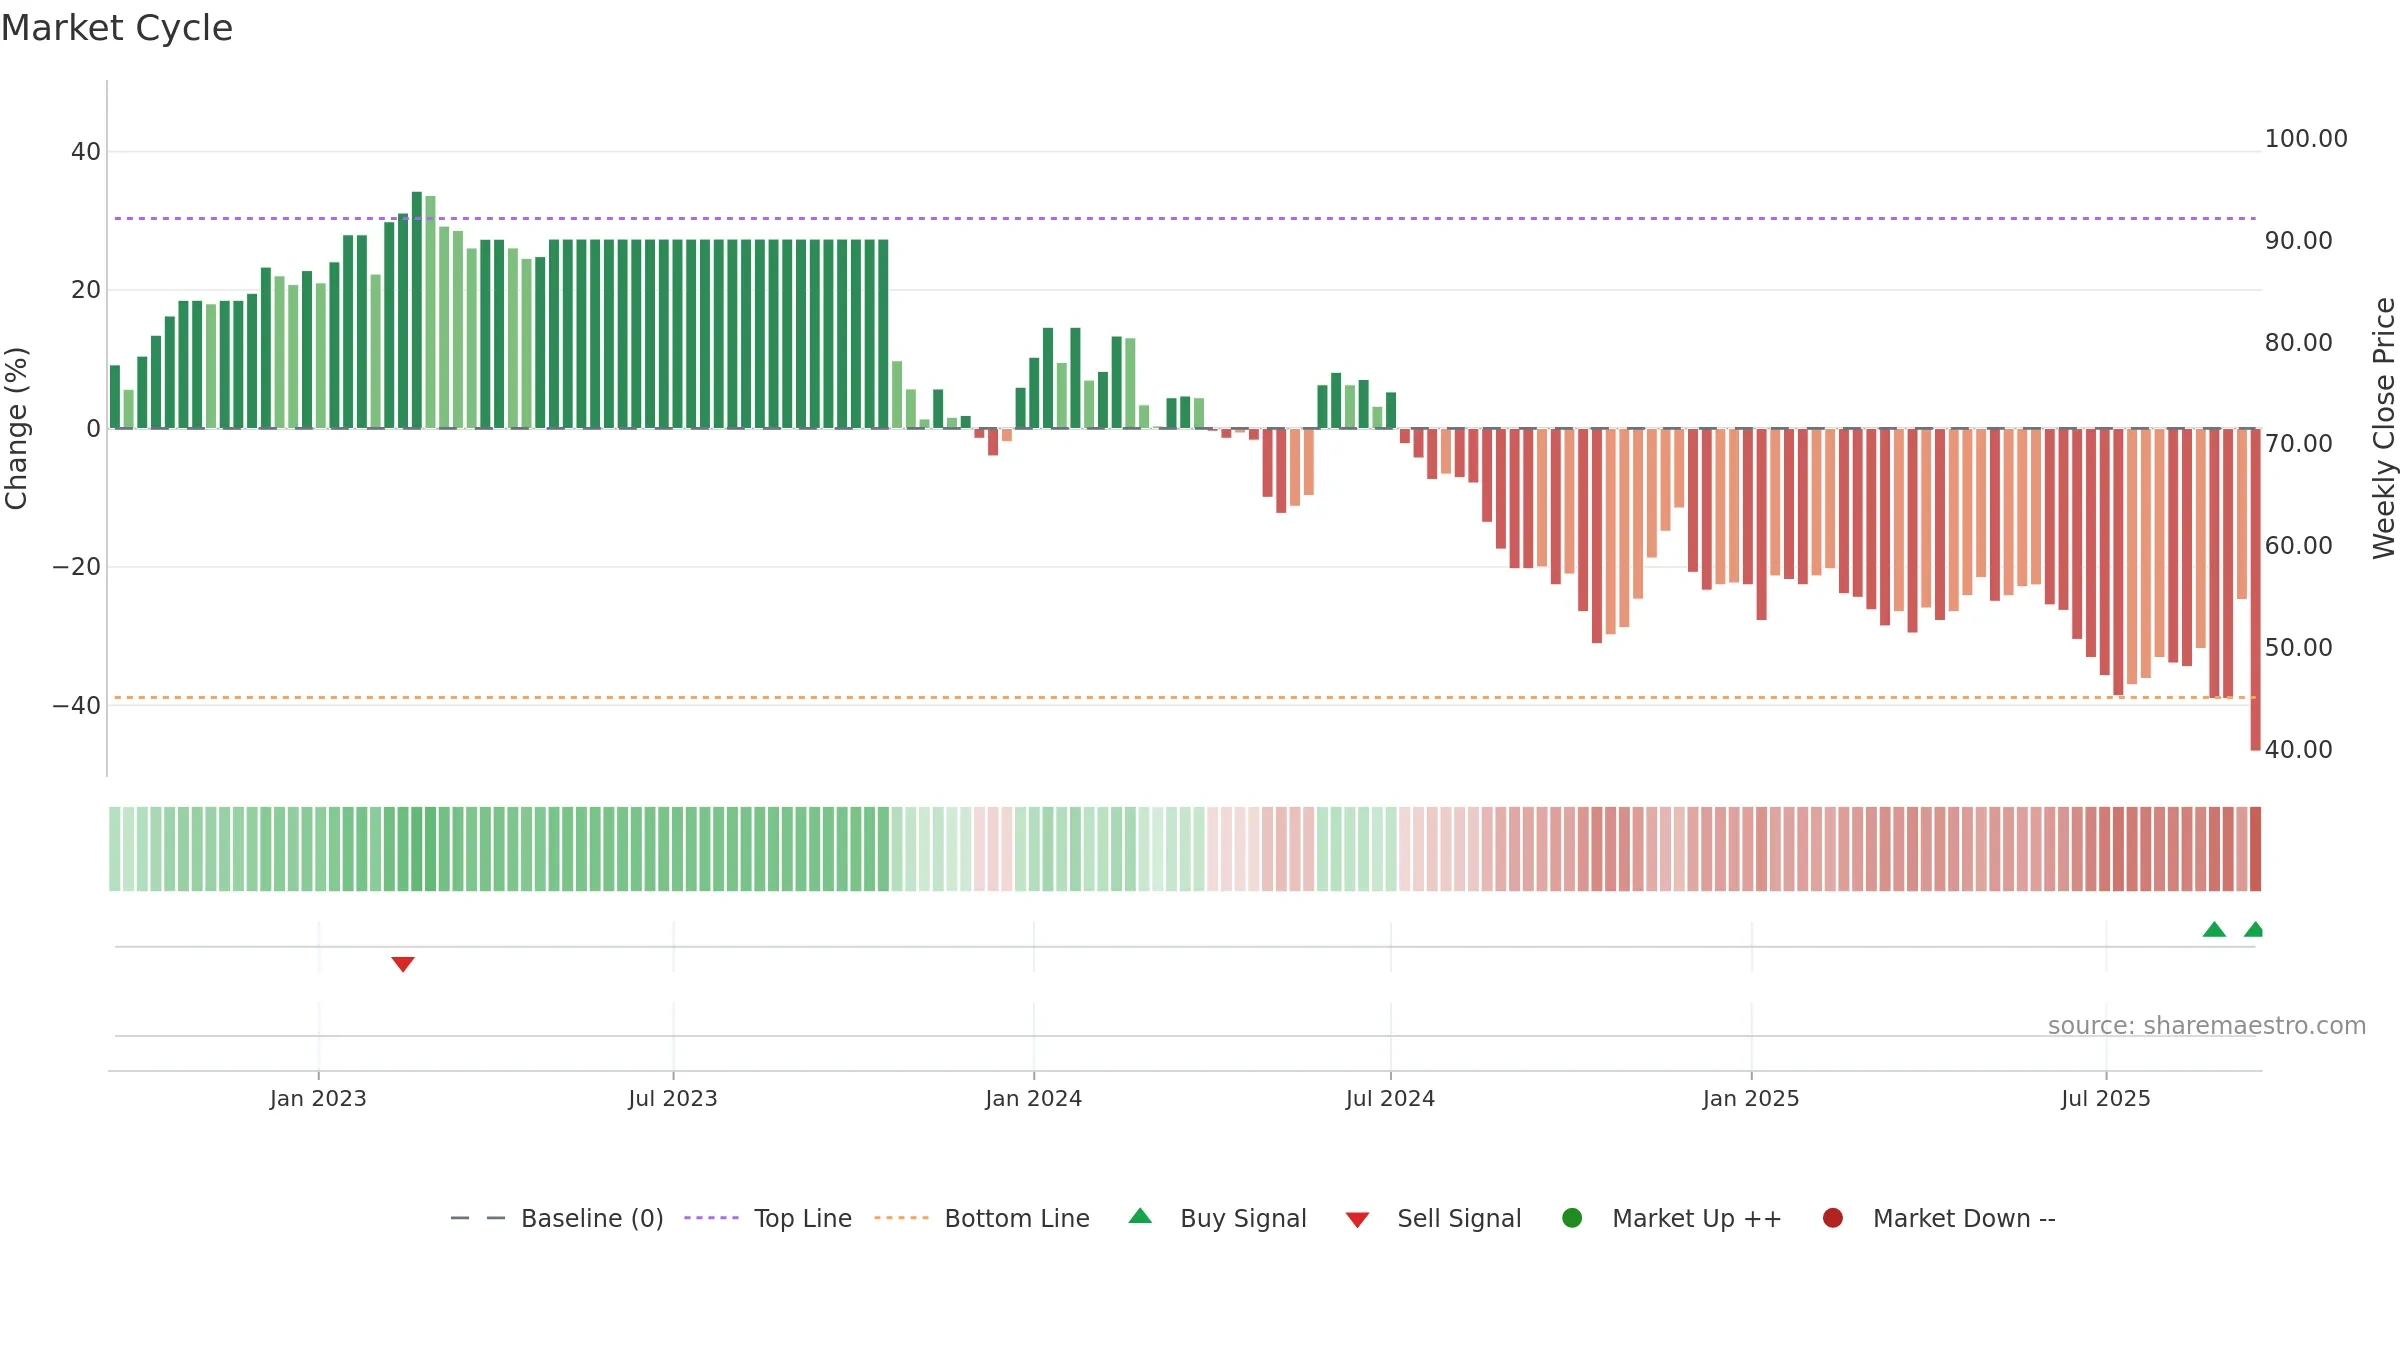
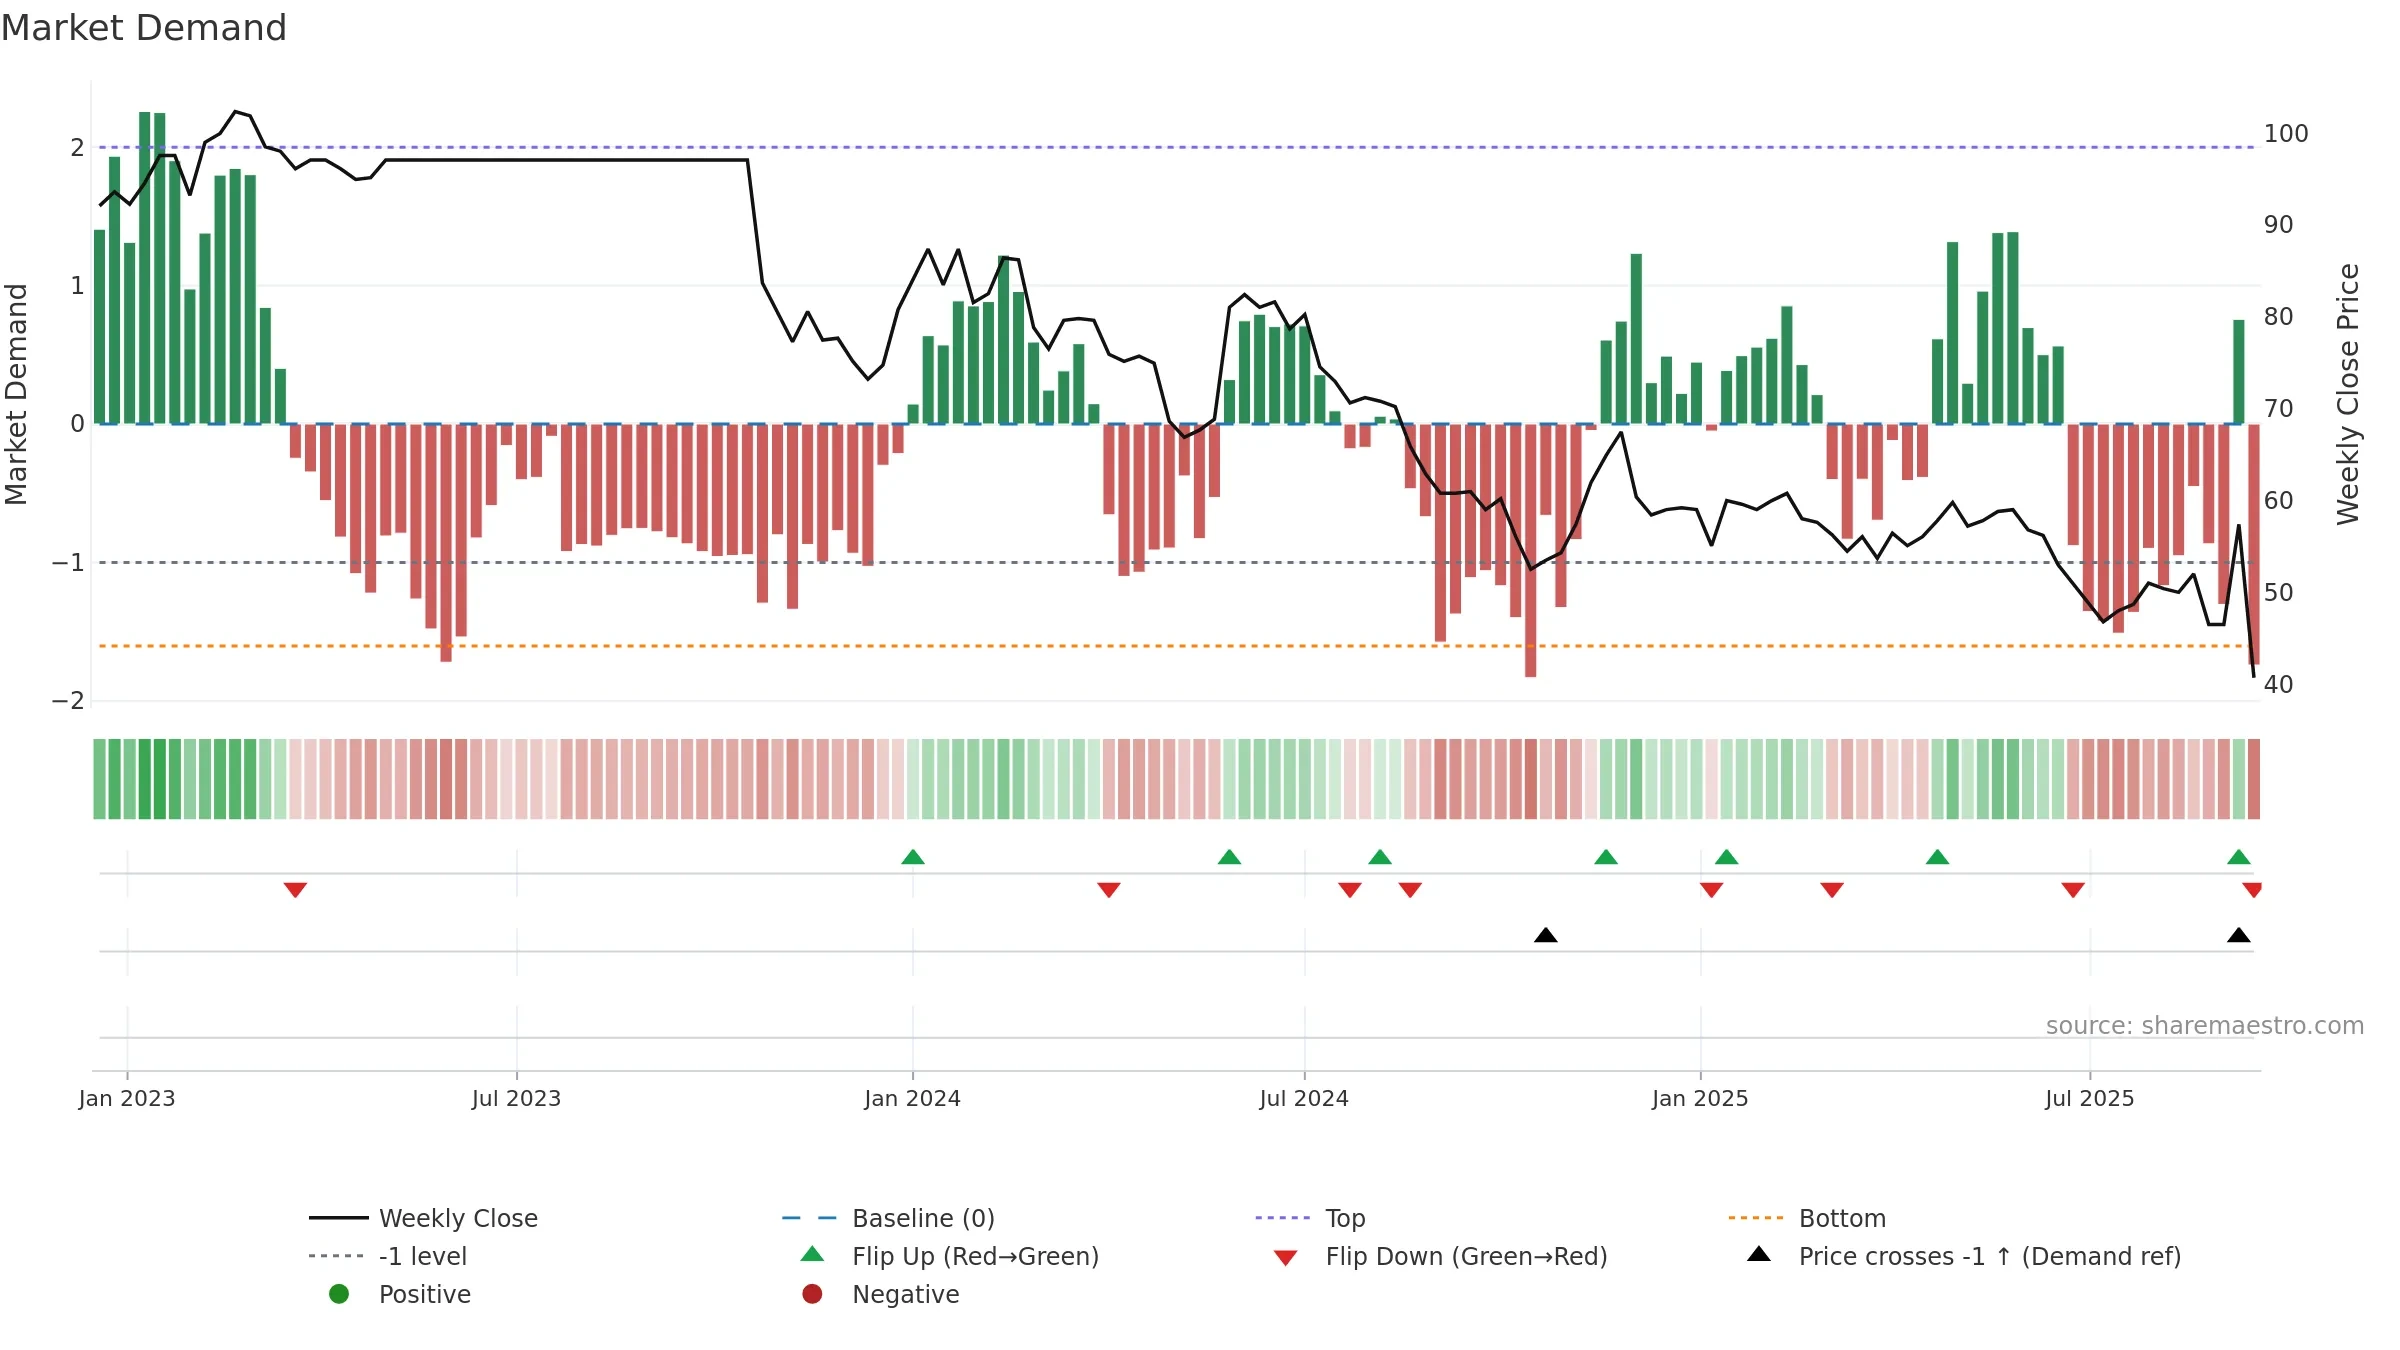
Why: Price window -20.20% over 8w. Close is -29.09% below the prior-window high. Return volatility 11.04%. Volume trend falling. Liquidity convergence with price. Trend state range / neutral. Low-regime (≤0.25) upticks 2/7 (29.0%) • Distributing. 4–8w crossover bearish. Momentum neutral and rising.
Tip: Most metrics include a hover tooltip where they appear in the report.