SMS Pharmaceuticals Limited
SMSPHARMA NSE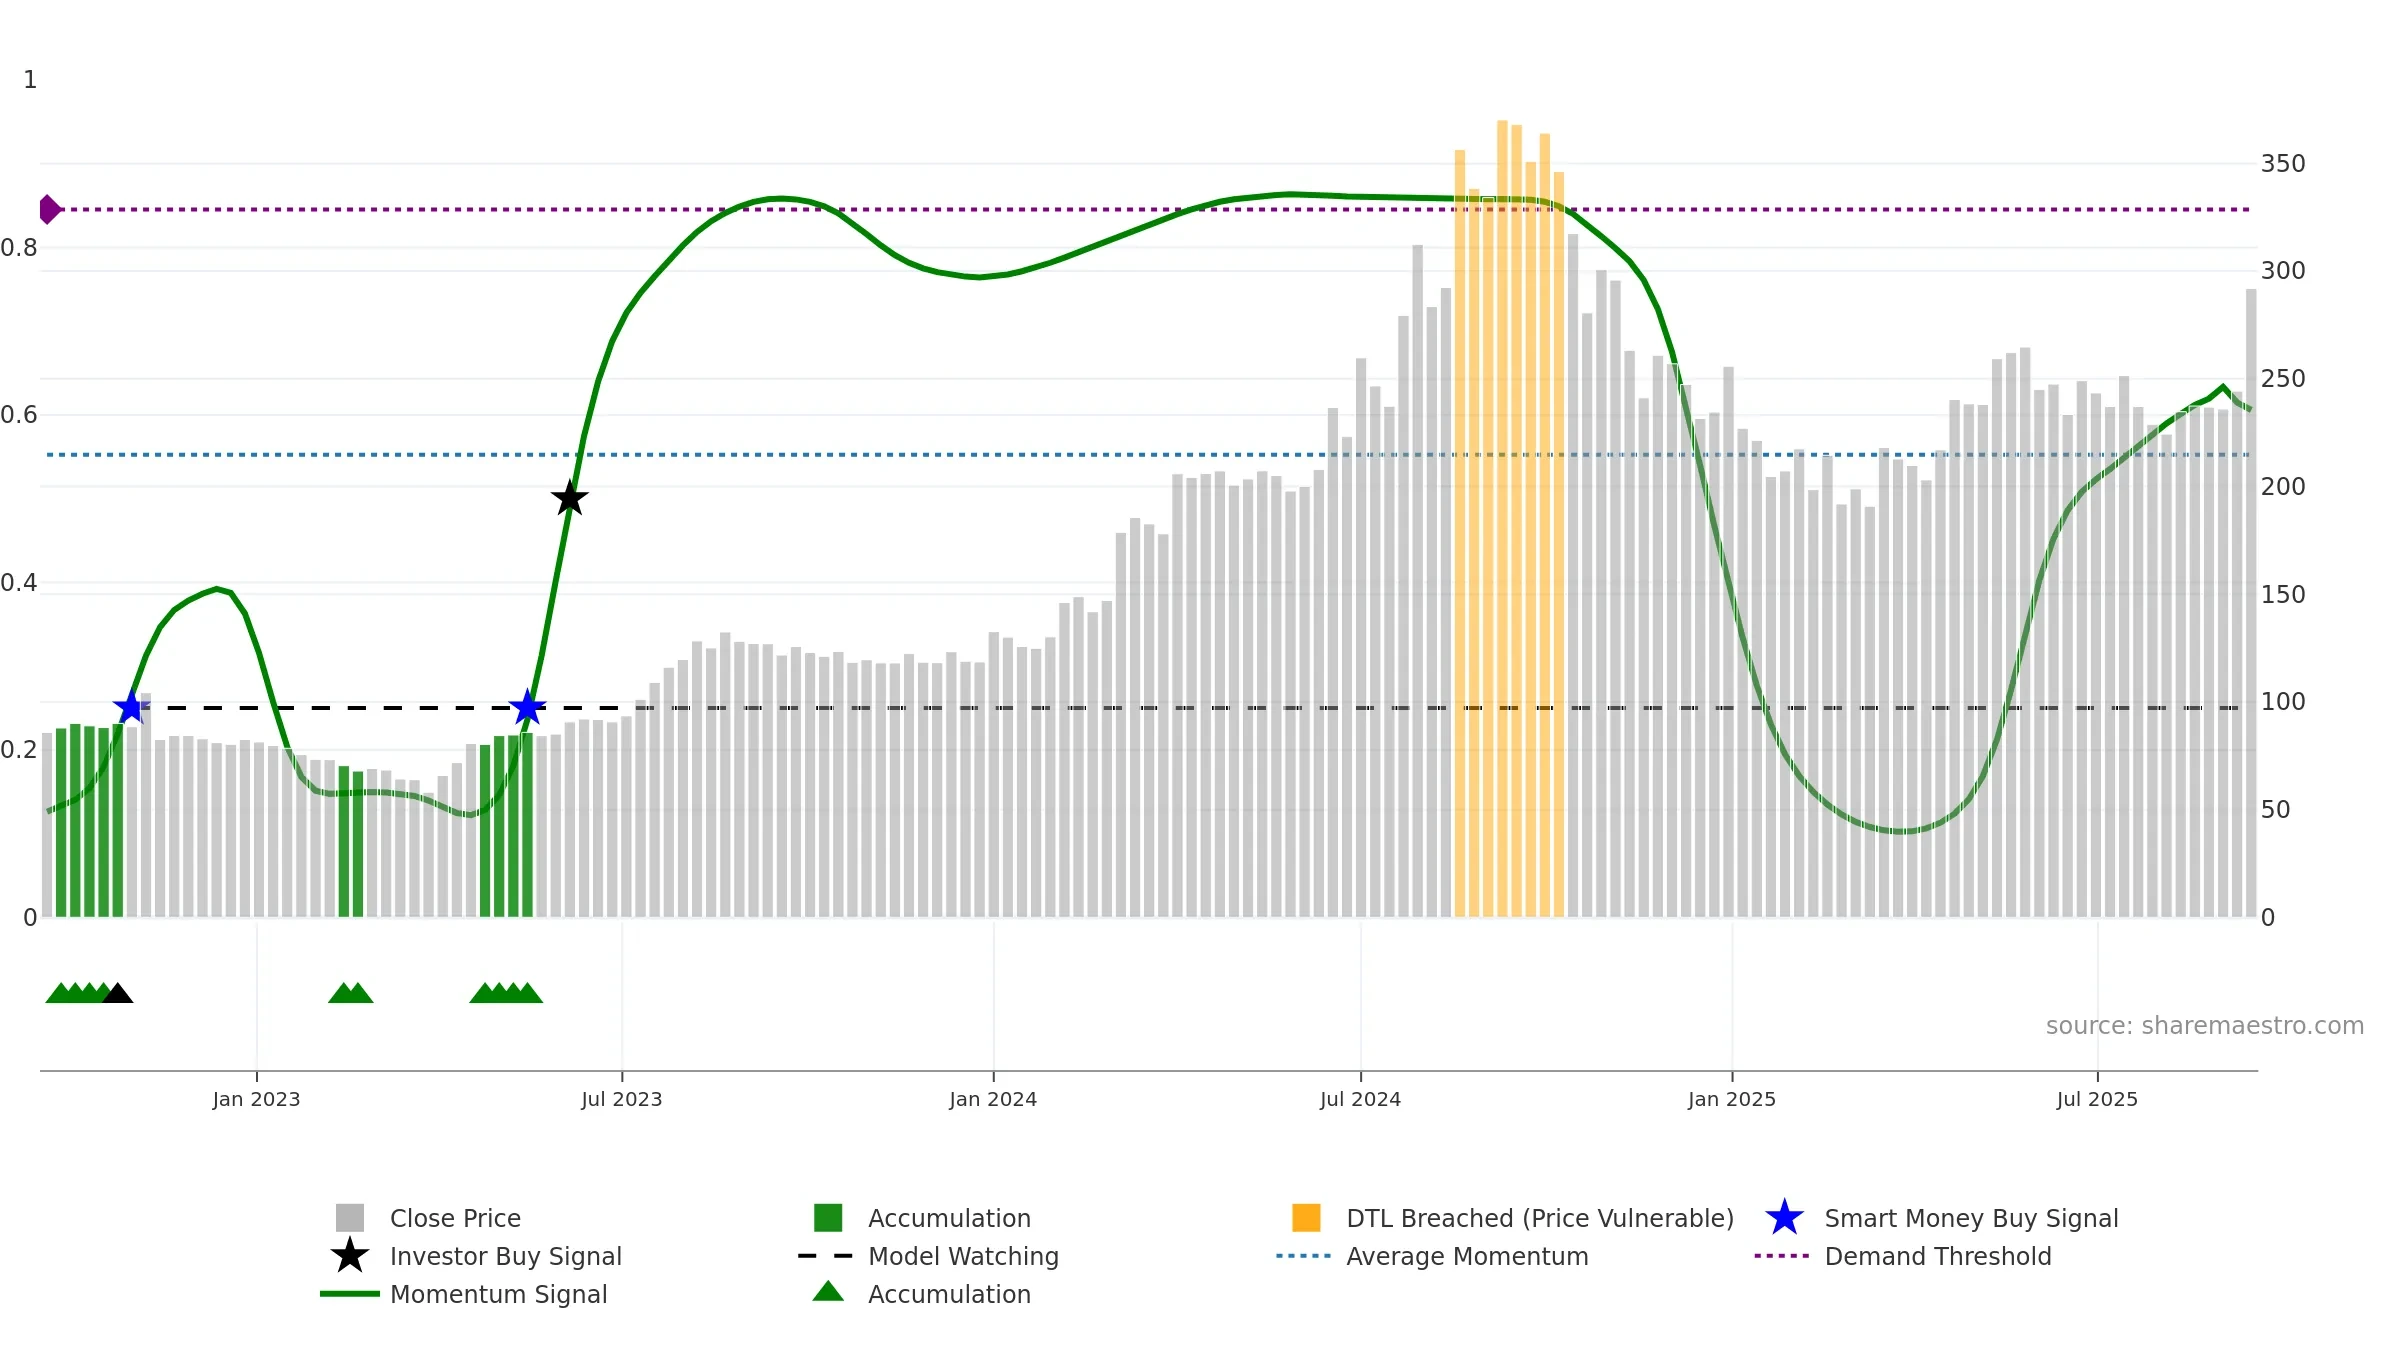
Weekly Report
SMS Pharmaceuticals Limited closed at 291.9600 (-0.35% WoW) . Data window ends Mon, 15 Sep 2025.
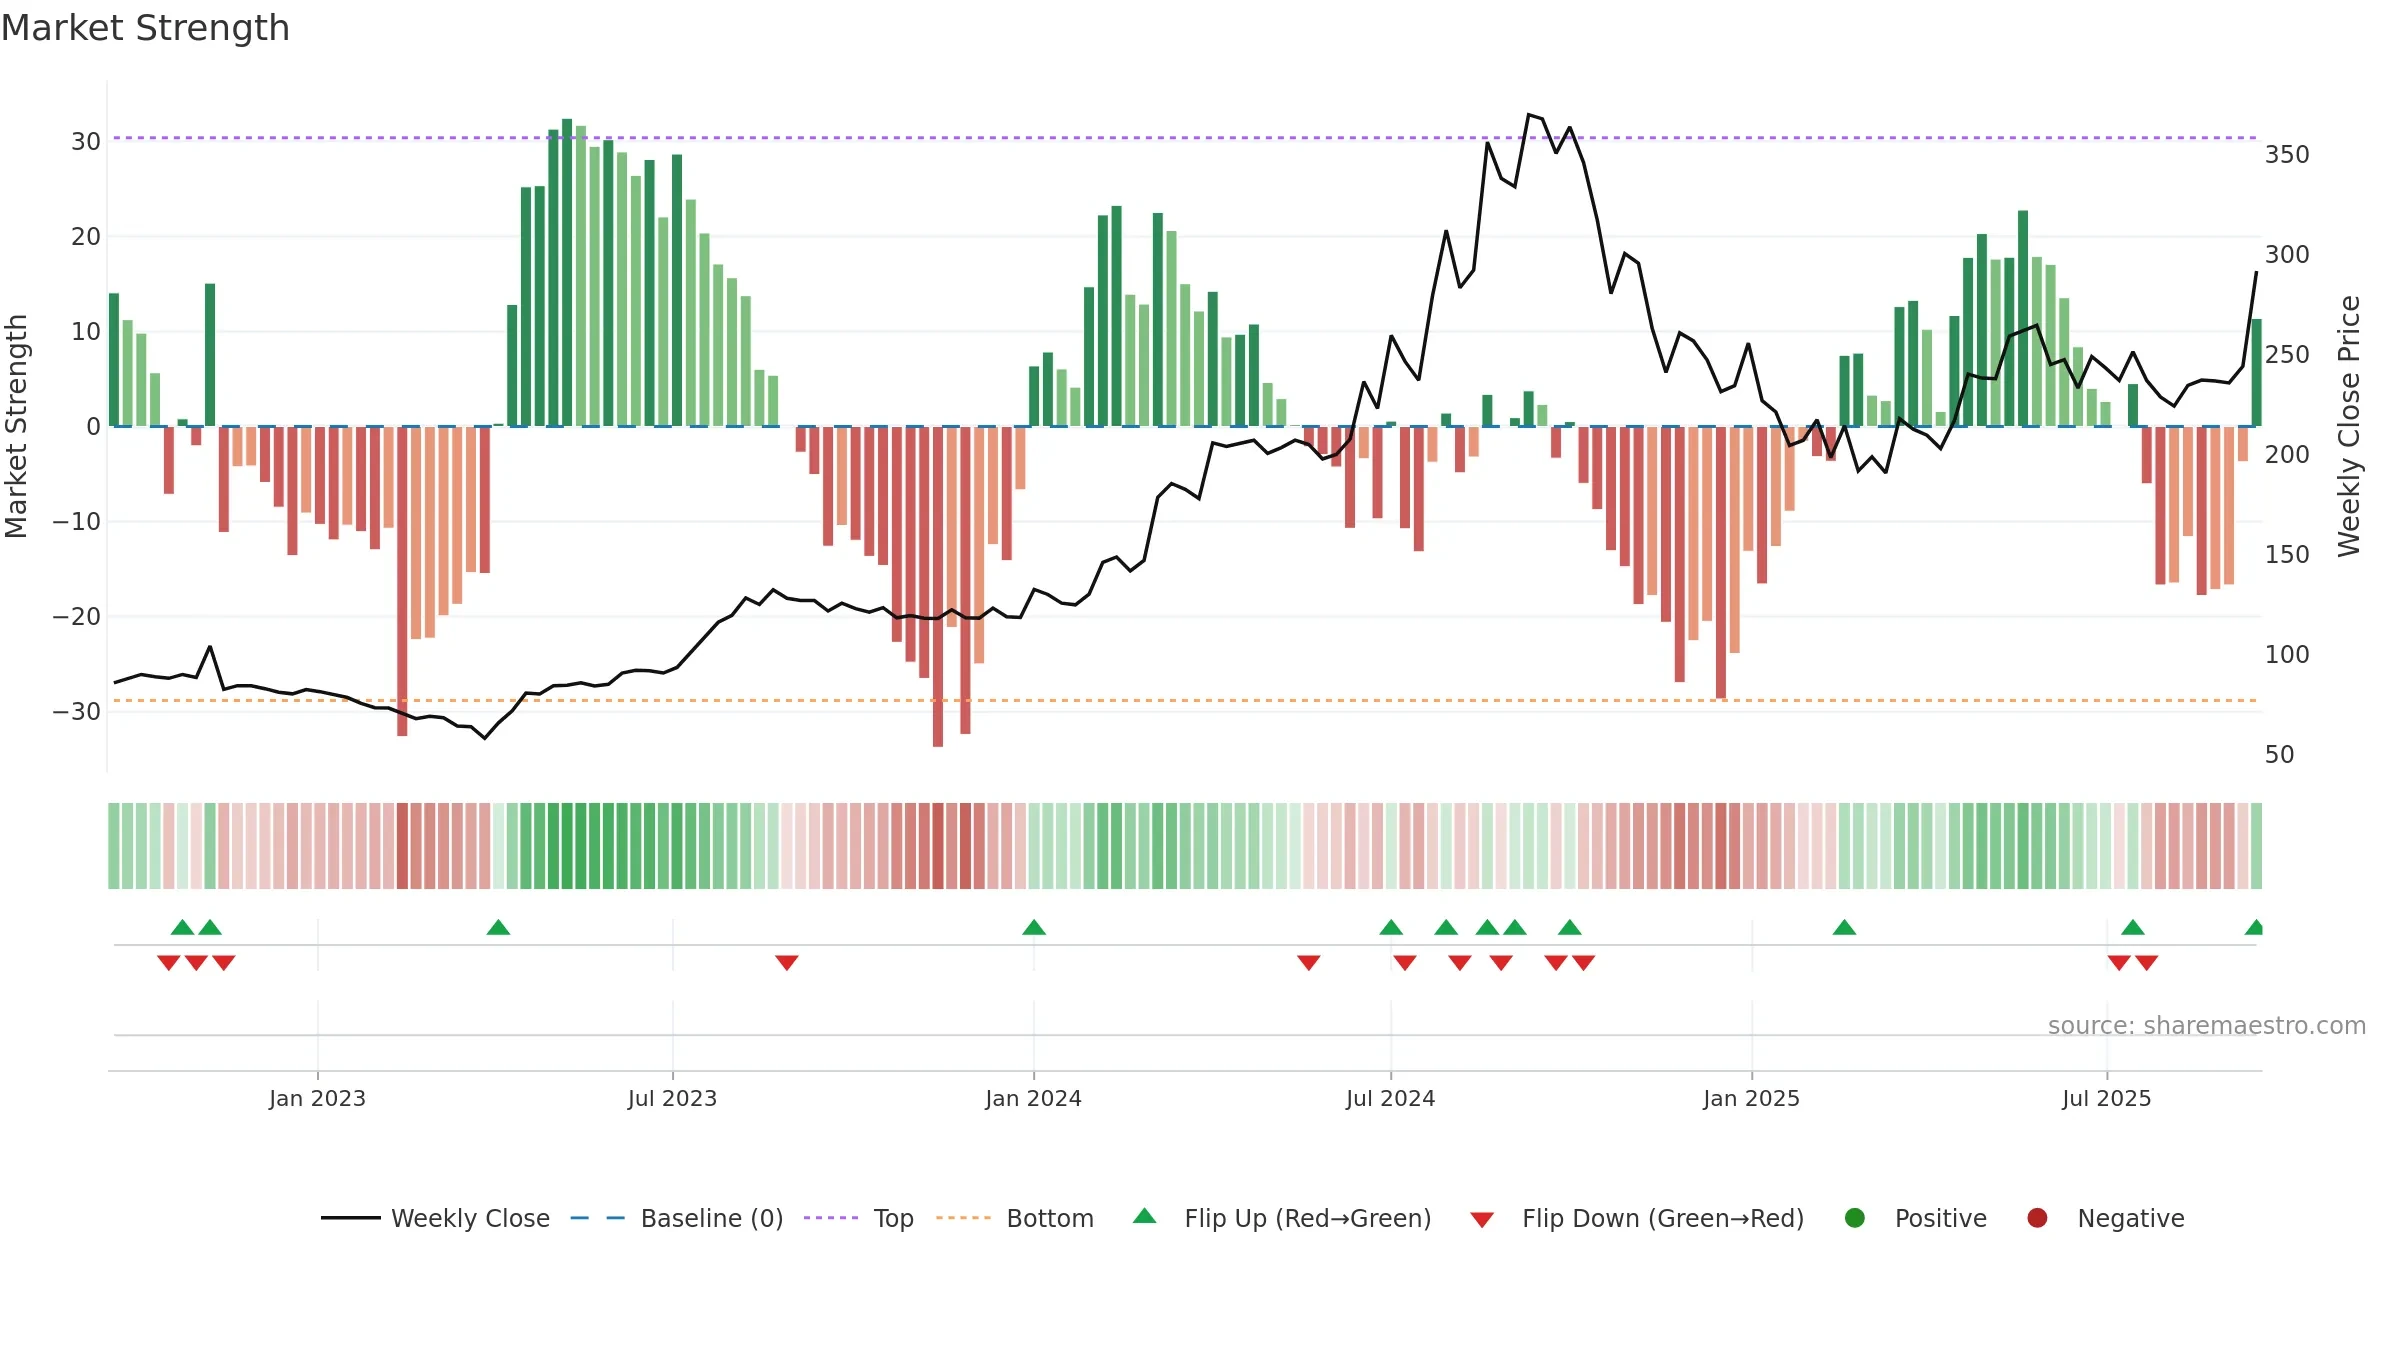
How to read this — Price slope is upward, indicating persistent buying over the window. Volume and price are moving in the same direction — a constructive confirmation. Price is stretched above its baseline; consolidation risk rises if activity fades. Price holds above key averages, indicating constructive participation.
Up-slope supports buying interest; pullbacks may be contained if activity stays firm.
Gauge maps the trend signal to a 0–100 scale.
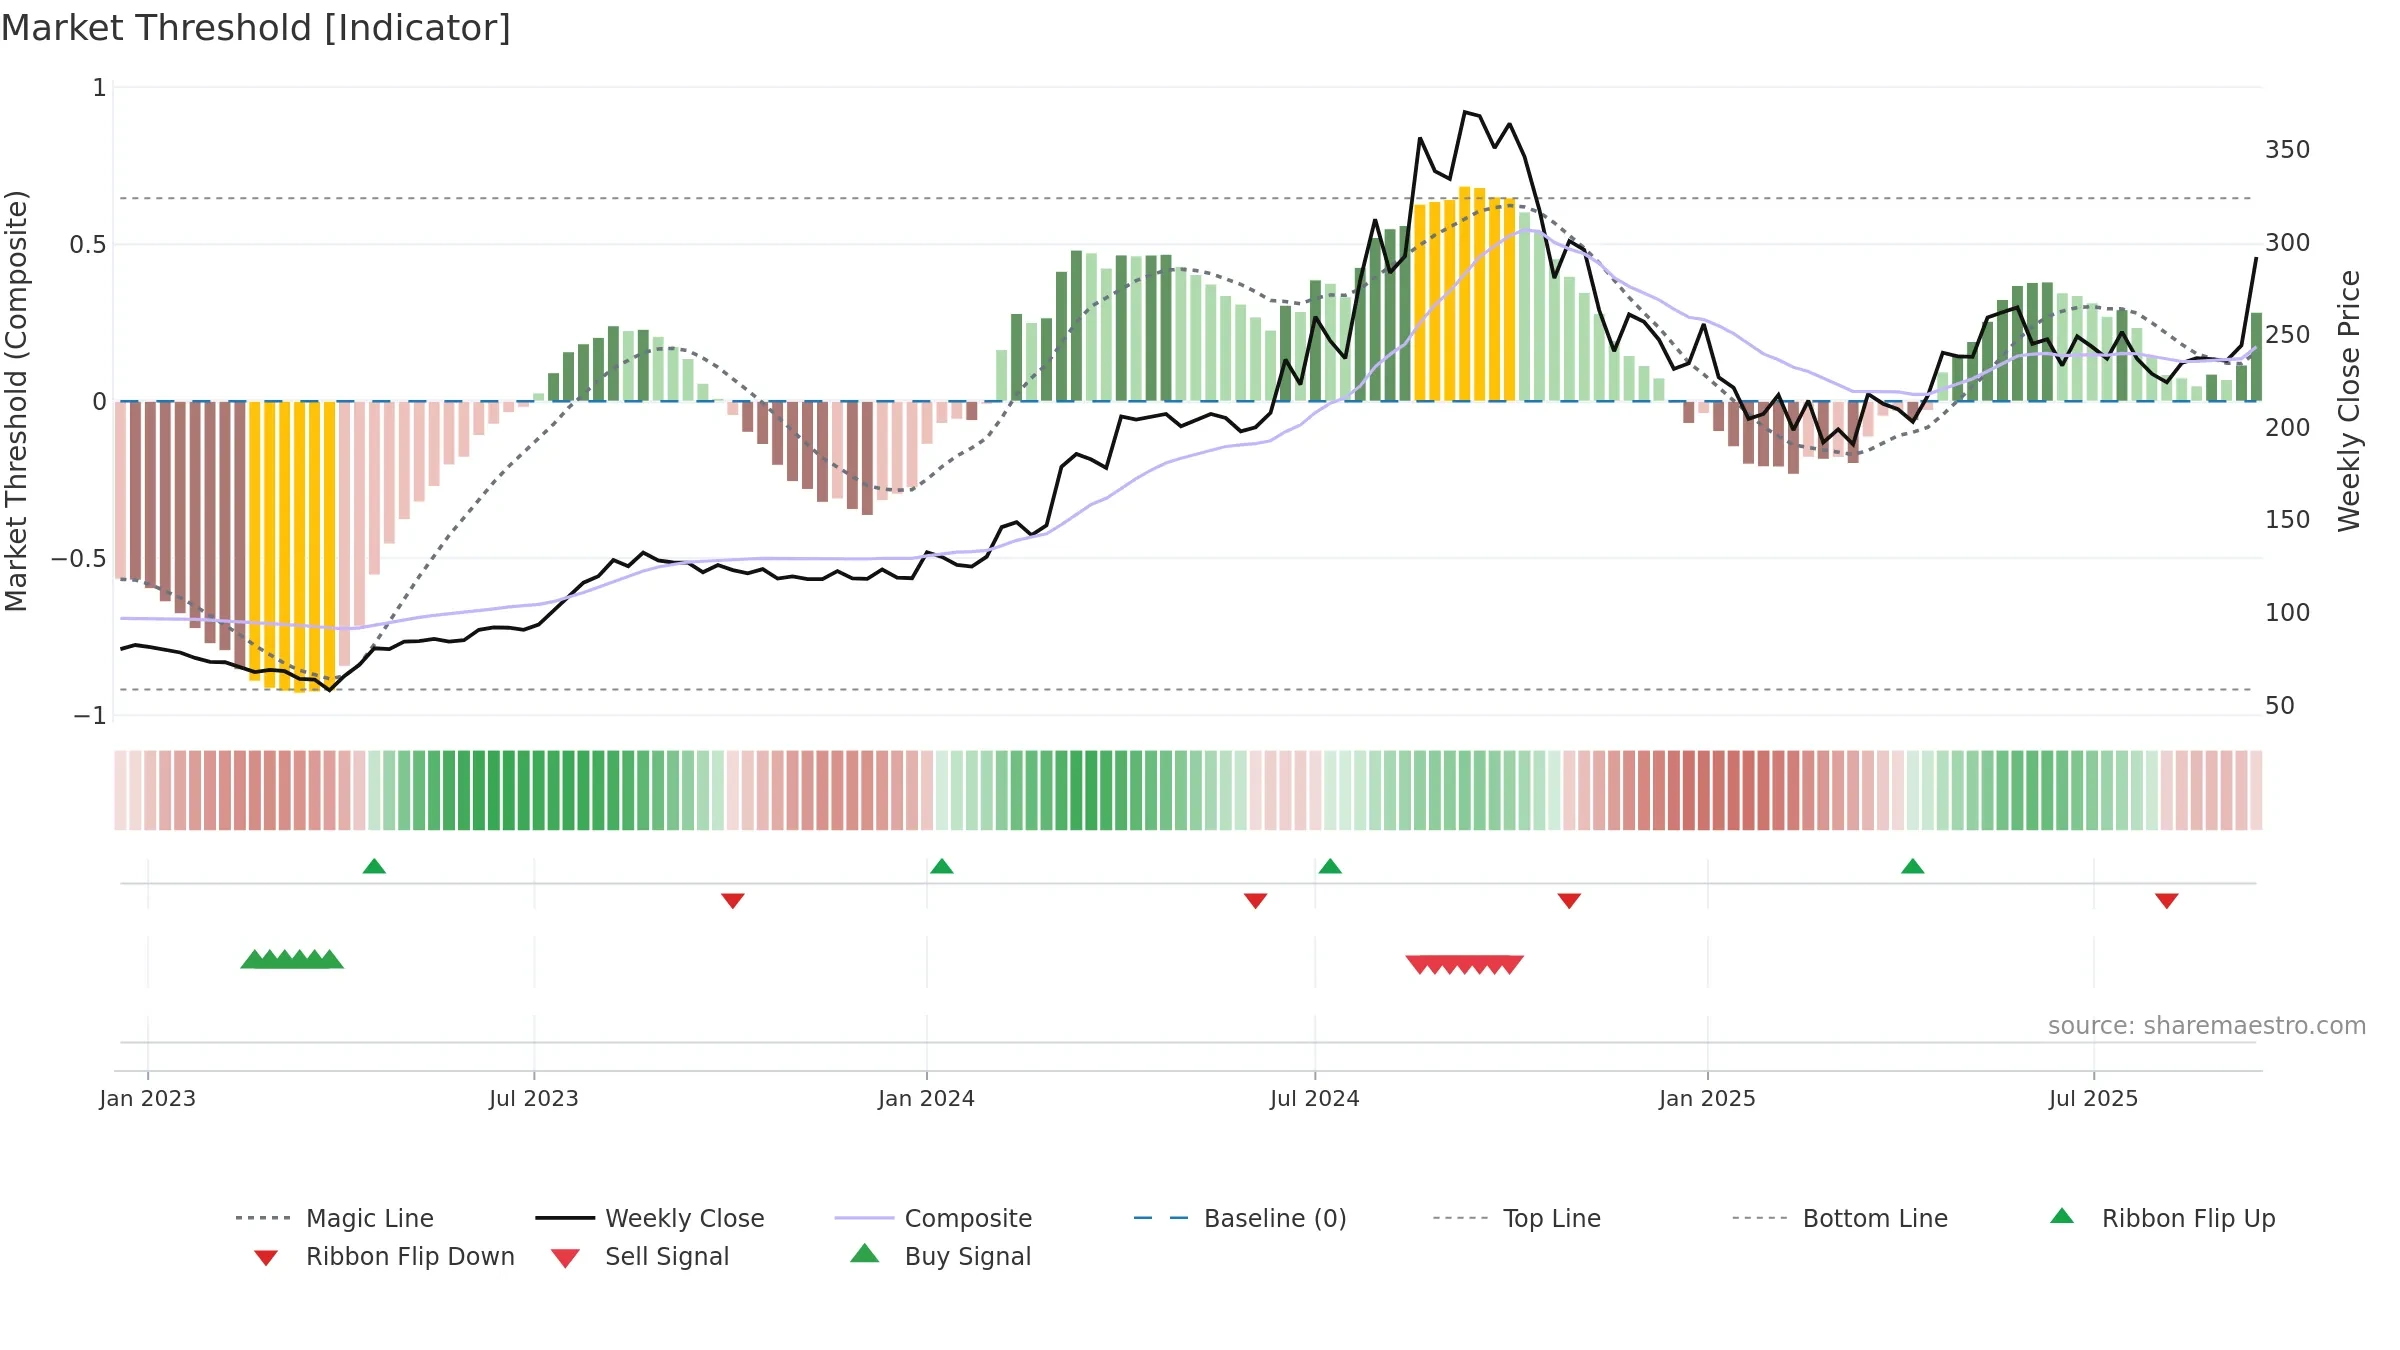
How to read this — Gauge is elevated but momentum is rolling over; topping risk is rising.
Stay alert: protect gains or seek confirmation before adding risk.
Price is below fair value; potential upside if momentum constructive.
Conclusion
Positive setup. ★★★★☆ confidence. Price window: 27. Trend: Uptrend at Risk; gauge 60. In combination, liquidity confirms the move.
- Momentum is bullish and rising
- Price holds above 8w & 26w averages
- Liquidity confirms the price trend
- Solid multi-week performance
- High-level but rolling over (topping risk)
Why: Price window 27.54% over 8w. Close is 19.52% above the prior-window high. Return volatility 2.03%. Volume trend rising. Liquidity convergence with price. Trend state uptrend at risk. Momentum bullish and rising. Valuation supportive skew.
Tip: Most metrics include a hover tooltip where they appear in the report.