No results found.

Direxion Daily Semiconductor Bear 3X Shares

SOXS ETF-US
Week Ending
Fri, 19 Sep 2025
Open
5.4600
Close
5.5300
High
5.6900
Low
5.4600
Trend
0.12895
Sharemaestro [Charts]
SOXS weekly Smart Money chart, closing 2025-09-19.
SOXS weekly Market Snapshot chart, closing 2025-09-19.
SOXS weekly Market Cycle chart, closing 2025-09-19.
SOXS weekly Market Demand chart, closing 2025-09-19.
SOXS weekly Market Strength chart, closing 2025-09-19.
SOXS weekly Market Dynamics chart, closing 2025-09-19.
SOXS weekly Market Threshold chart, closing 2025-09-19.

Weekly Report

Direxion Daily Semiconductor Bear 3X Shares (SOXS) Week Ending: Fri, 19 Sep 2025 ★★★☆☆
Price
Weekly Close

Direxion Daily Semiconductor Bear 3X Shares closed at 5.5300 (1.28% WoW) . Data window ends Fri, 19 Sep 2025.

Price Window-27.81% over 8w
Return Volatility4.88%
Volume TrendFalling
Vs 8-week High-27.81%
Accumulation Weeks3
Distribution Weeks1
MA StackWeak
4–8 CrossoverNone
Price vs MAsBelow
Baseline Deviation-0.94% (widening)
Interpretation

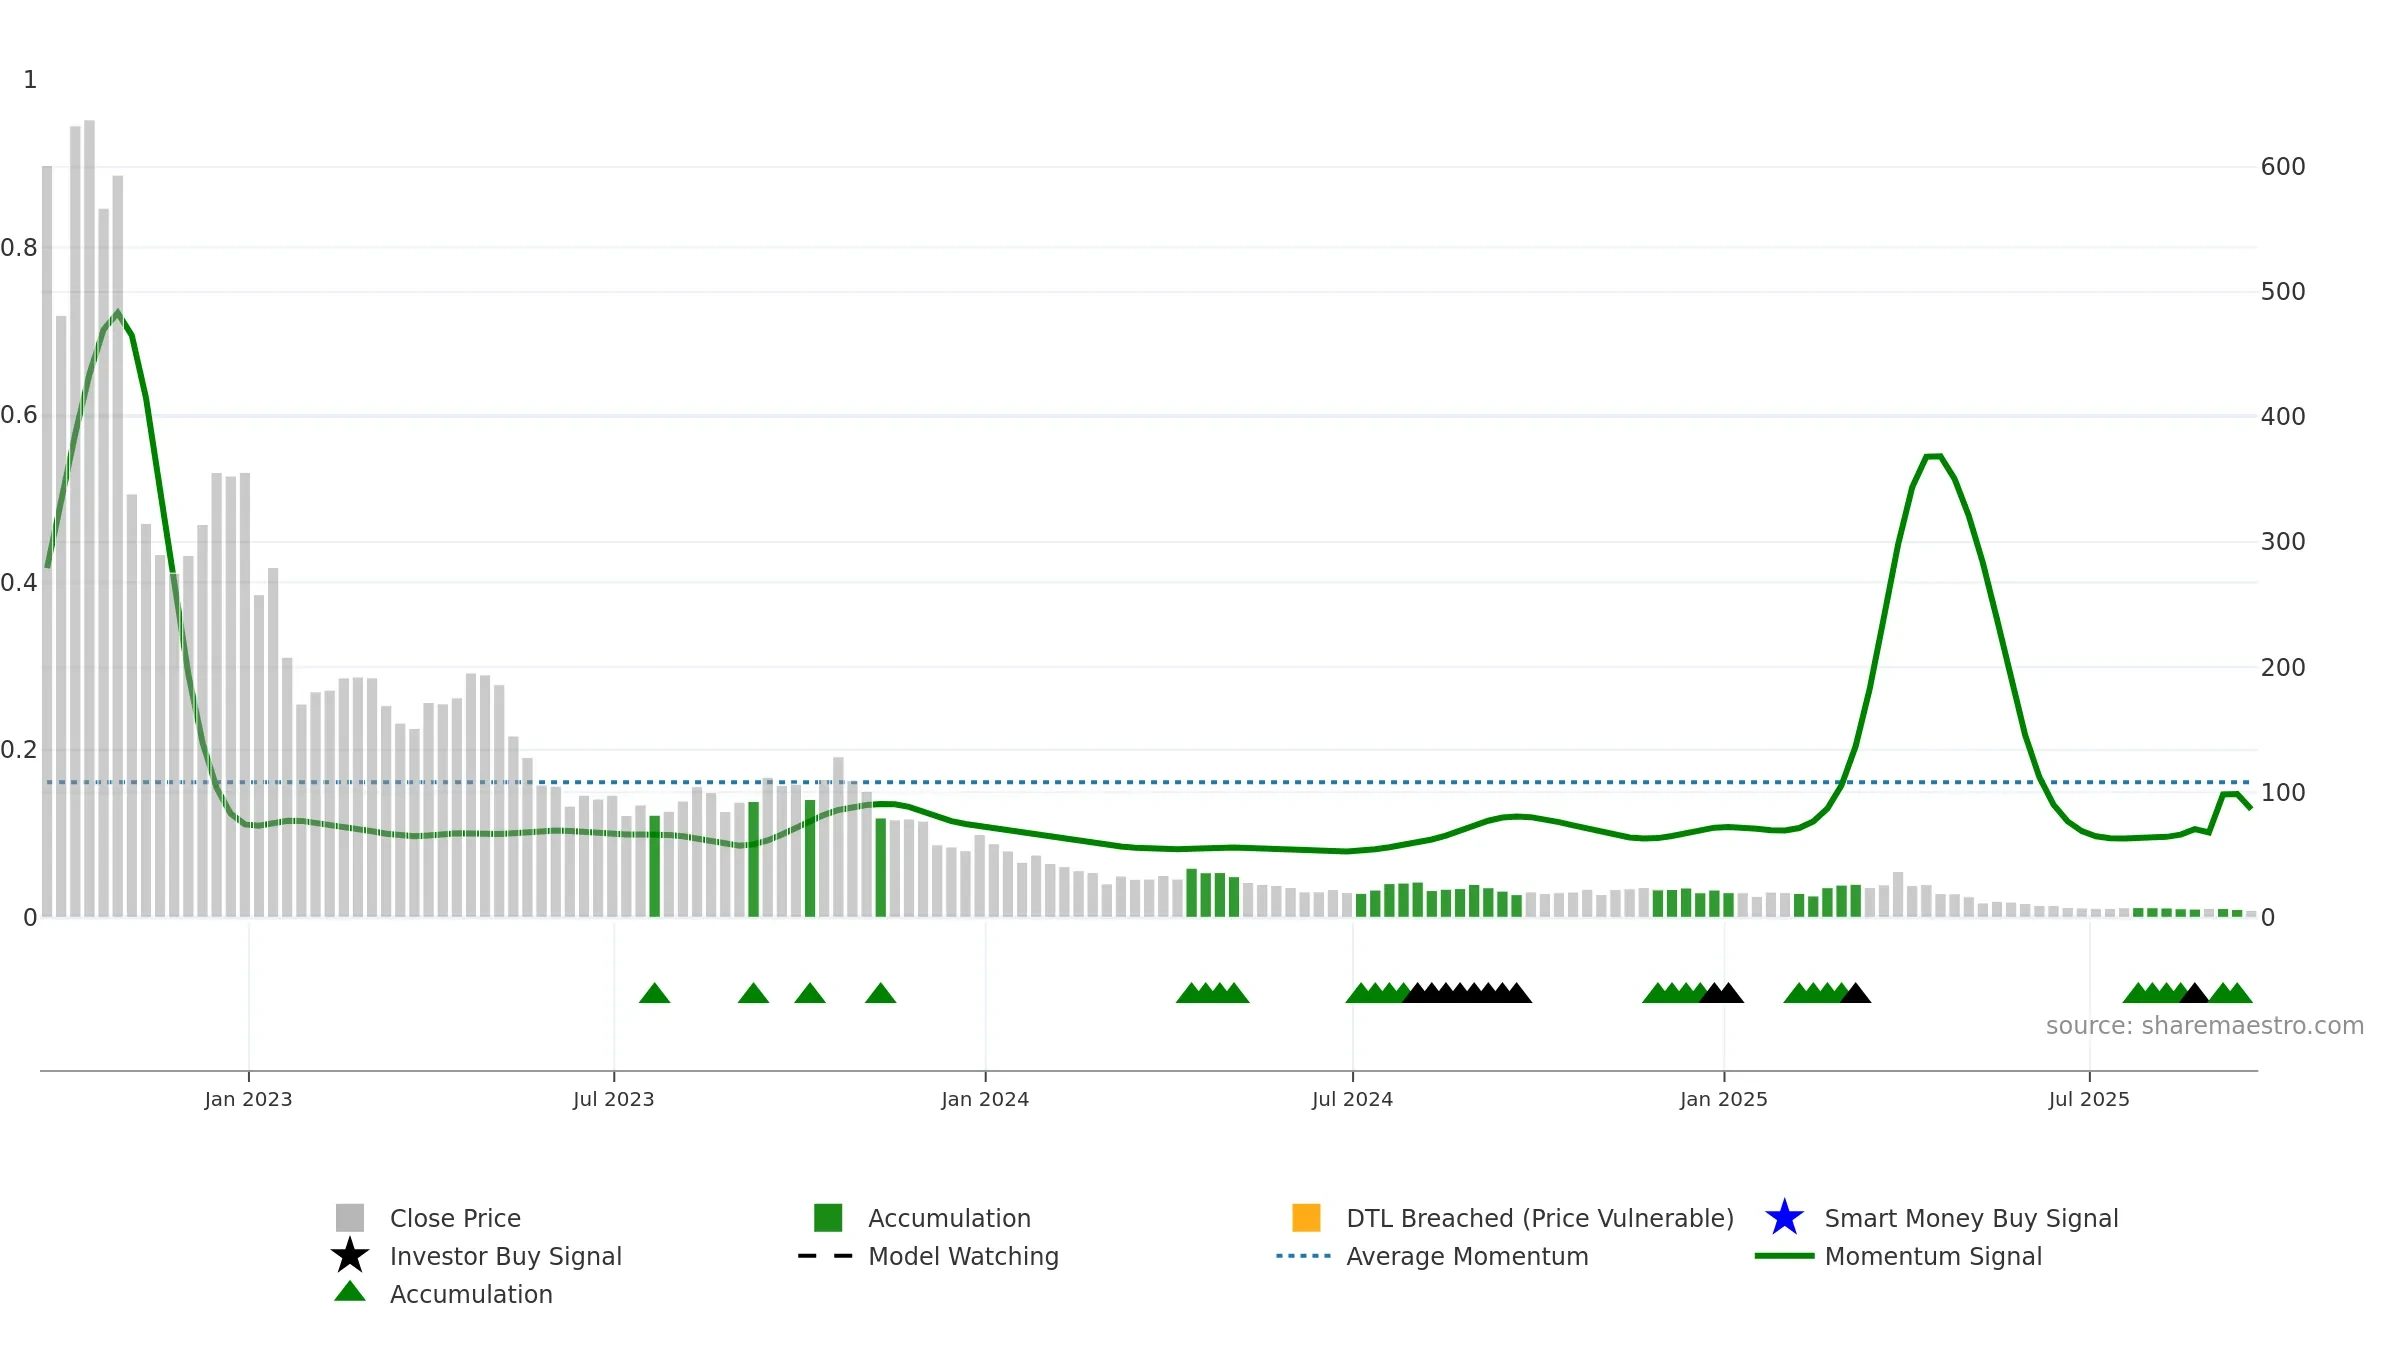
How to read this — Price slope is downward, indicating persistent supply pressure. Elevated weekly volatility increases whipsaw risk. Volume and price are moving in the same direction — a constructive confirmation. Returns are negatively correlated with volume — strength may come on lighter activity. Accumulation weeks: 3; distribution weeks: 1. Price-level slope and return-drift differ — moves have been uneven week to week. Weak MA stack argues for caution; rallies can fail near the 8–13 week region. Price sits below key averages, keeping pressure on the tape.

What this means for you

Down-slope argues for patience; rallies can fade sooner unless participation improves.

Trend
Sharemaestro Trend Line

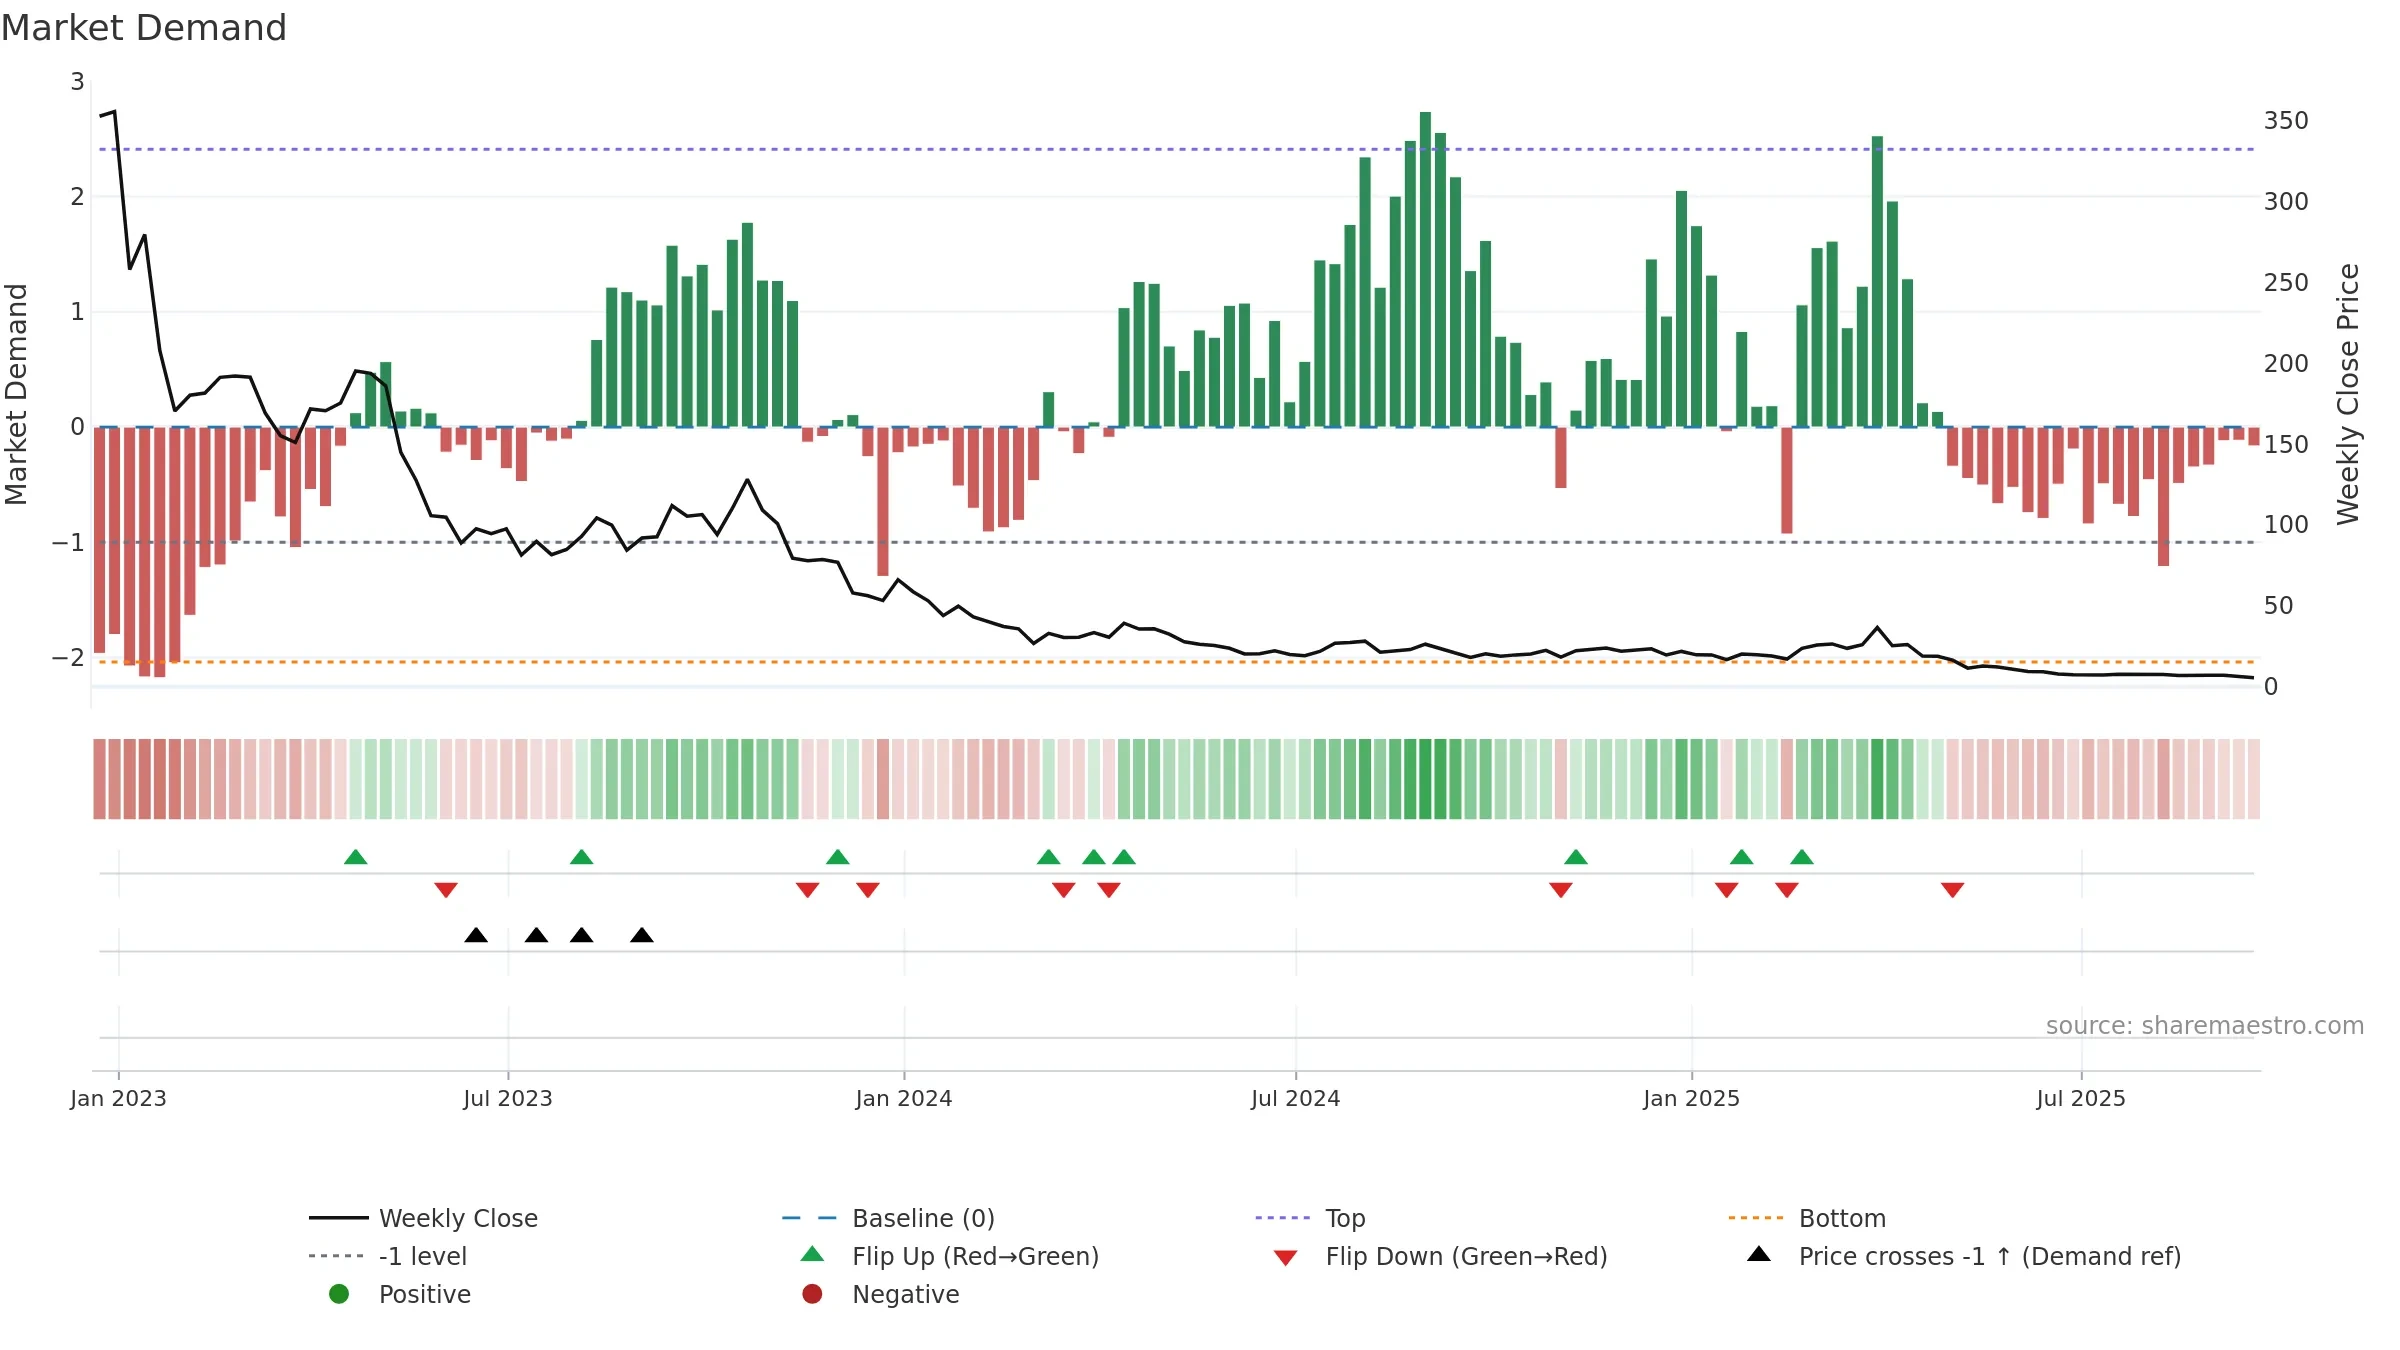
Gauge maps the trend signal to a 0–100 scale.

Gauge Reading56.4/100
DirectionRising
Accelerationdecelerating
Gauge VolatilityLow
Zone LabelBullish
Bullish Weeks3
Neutral Weeks5
Bearish Weeks0
Interpretation

How to read this — Bullish gauge levels imply persistent upside pressure. A rising gauge shows momentum building rather than fading. Deceleration reduces the odds of persistence.

What this means for you

Constructive backdrop; dips are more likely to find support while the gauge stays high.

Conclusion

Neutral ★★★☆☆

Neutral setup. ★★★☆☆ confidence. Price window: -27. Trend: Bullish @ 56. In combination, liquidity confirms the move.

Why: Price window -27.81% over 8w. Close is -27.81% below the window high. Return volatility 4.88%. Volume trend falling. Liquidity convergence with price. Accumulation 3; distribution 1. MA stack weak. Baseline deviation -0.94% (widening). Momentum bullish and rising. Acceleration decelerating. Gauge volatility low.

Price Window Endpoint return over the last N weeks using weekly closes: (Closelast − Closefirst)/Closefirst × 100.
Return Volatility Std-dev of weekly returns (%). Higher = choppier.
Volume Trend Slope of weekly volume across the window (rising / falling / flat).
Vs N-week High % distance of latest close from the highest close in the window.
Accumulation Weeks Weeks price rose on higher volume than the prior week.
Distribution Weeks Weeks price fell on higher volume than the prior week.
MA Stack Relative order of short / intermediate / long MAs. Short > long is constructive.
4–8 Crossover Latest cross of 4-week vs 8-week MA (bullish / bearish / none).
Price vs MAs Whether the close is above/below key averages (8w & 26w).
Baseline Deviation % distance from the market-cycle baseline (fair-value track).
Gauge Reading Smoothed trend signal mapped to 0–100.
Direction Slope sign of the gauge across the window (rising / falling).
Acceleration Change in the slope of the gauge (accelerating / decelerating).
Gauge Volatility Variability of the gauge (low / normal / high).
Zone Label Classification by level (Bullish / Neutral / Bearish).
Target Price (Flag) If flagged: Positive/Negative stance. Otherwise: numeric fair value.
Composite Score Overall model score (0–10).
Hybrid Efficiency Efficiency of growth × quality (0–10).
Rating Model’s verdict for the snapshot.
Weekly Close Sparkline of the last 52 weekly closing prices.
Trend Line Sparkline of the smoothed trend signal over the last 52 weeks.

Tip: Most metrics also include a hover tooltip where they appear in the report.

Download JSON Download CSV JSON-LD Snapshots: 2025-09-19