Shanghai M&G Stationery Inc.
603899 SHA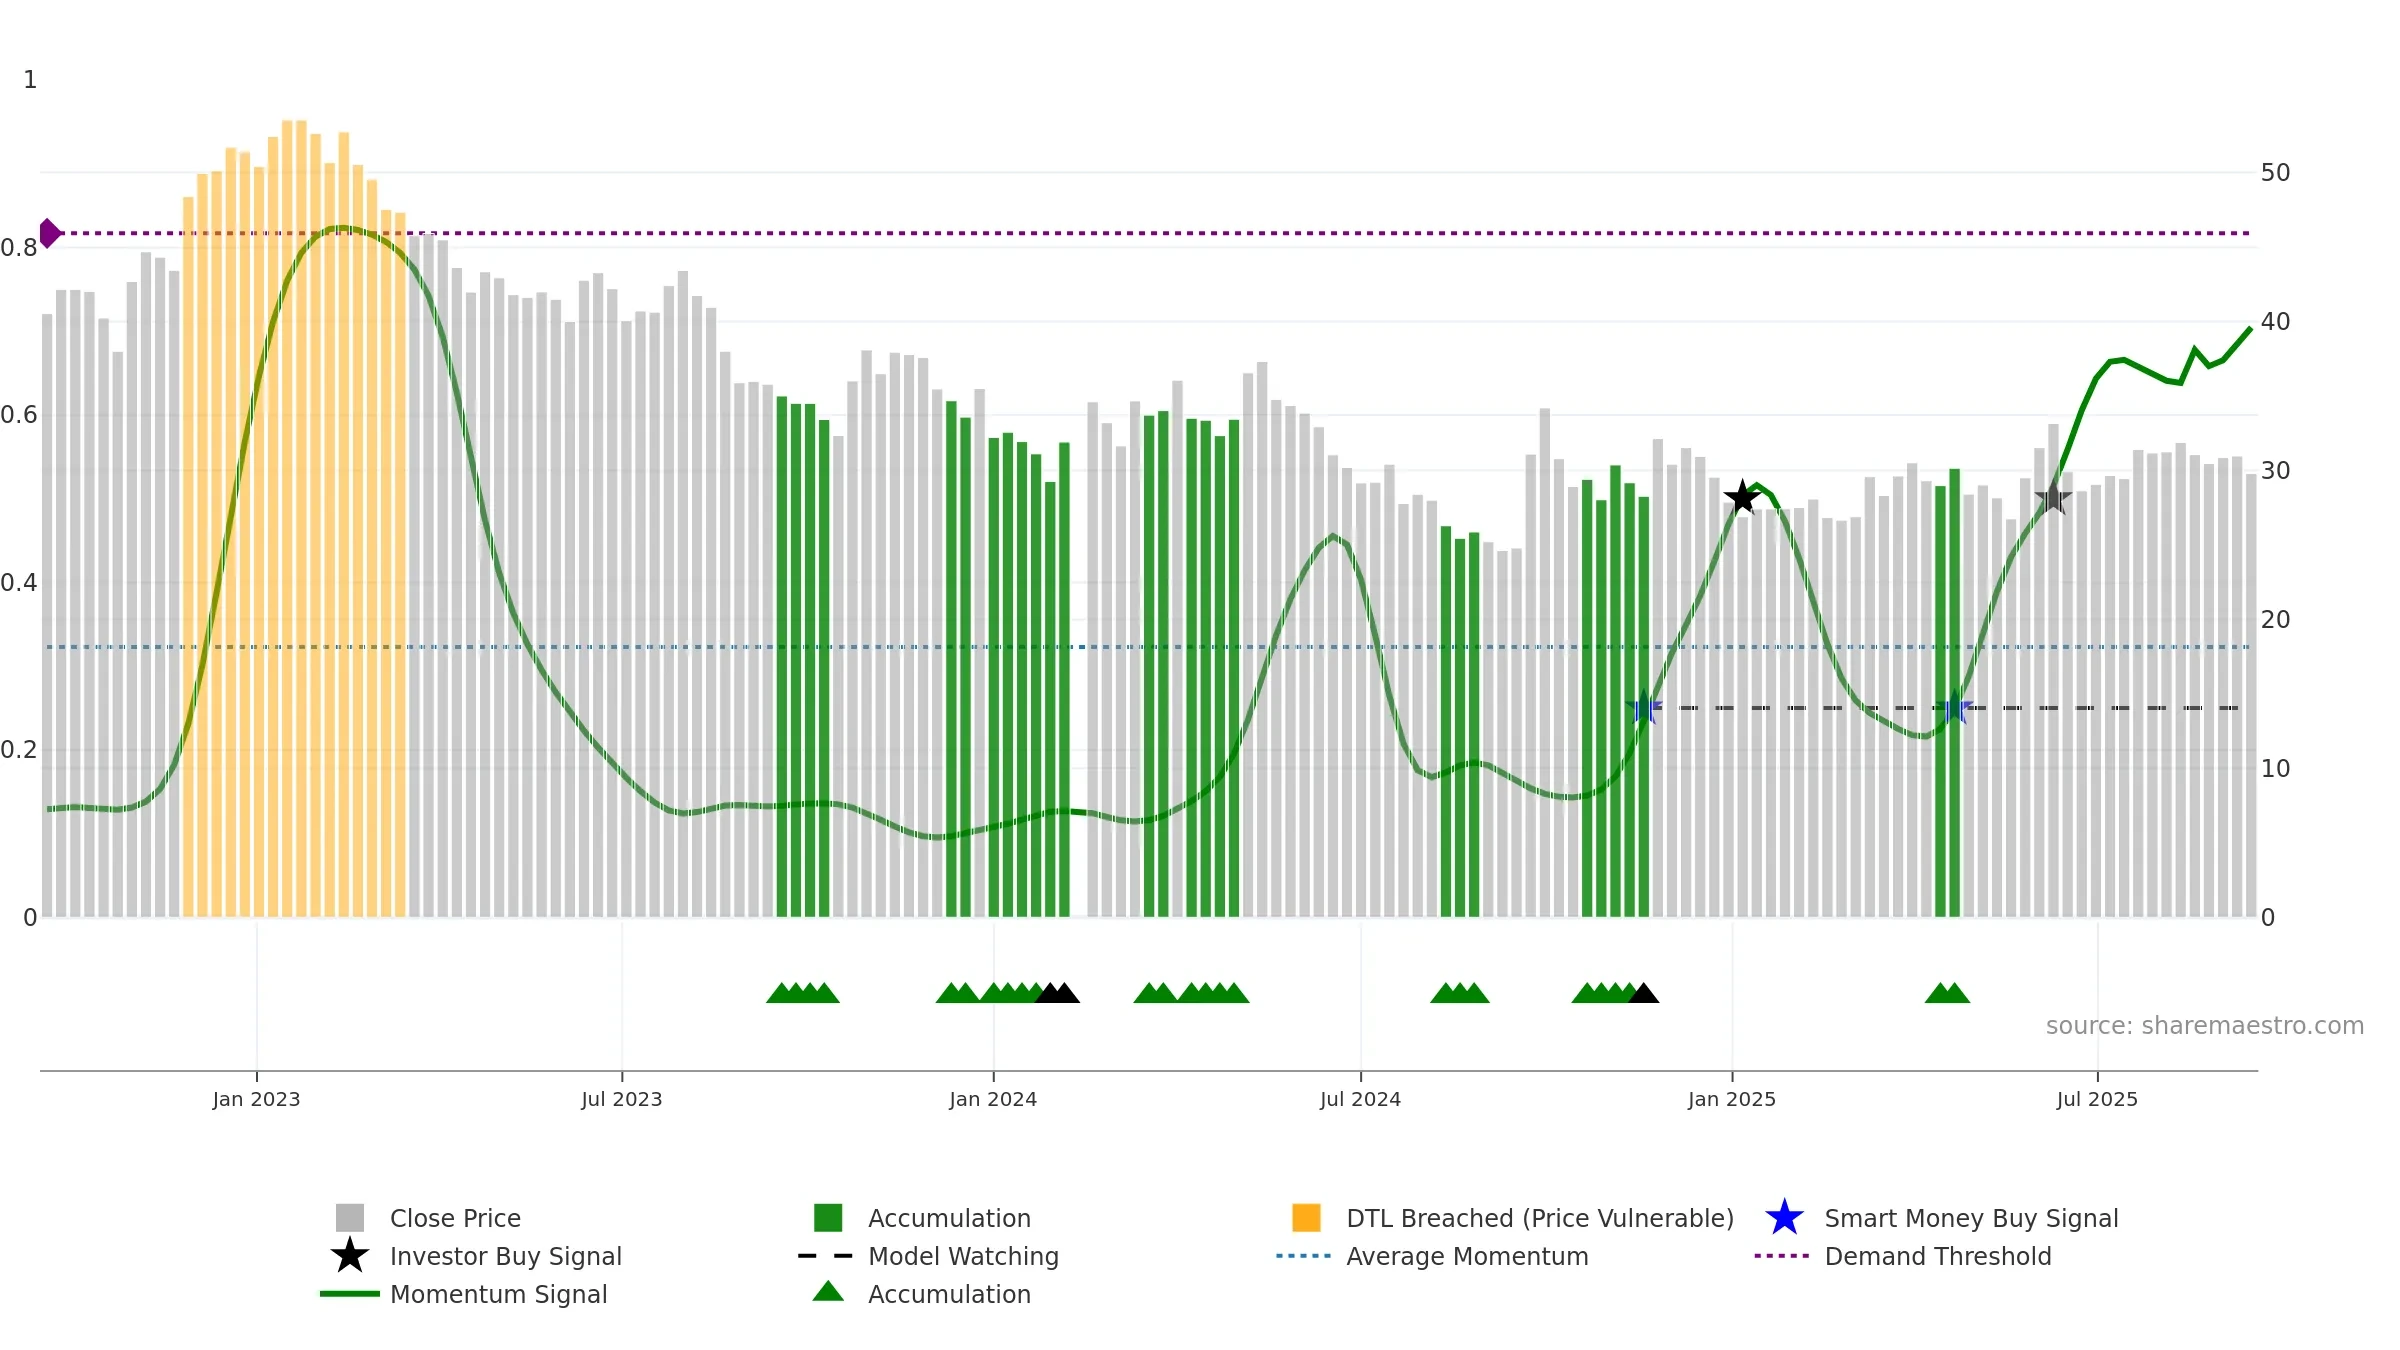
Weekly Report
Shanghai M&G Stationery Inc. closed at 29.8000 (-1.06% WoW) . Data window ends Mon, 15 Sep 2025.
How to read this — Price slope is downward, indicating persistent supply pressure. Low weekly volatility favours steadier follow-through. Volume and price are moving in the same direction — a constructive confirmation. Returns are negatively correlated with volume — strength may come on lighter activity. Price sits below key averages, keeping pressure on the tape.
Down-slope argues for patience; rallies can fade sooner unless participation improves.
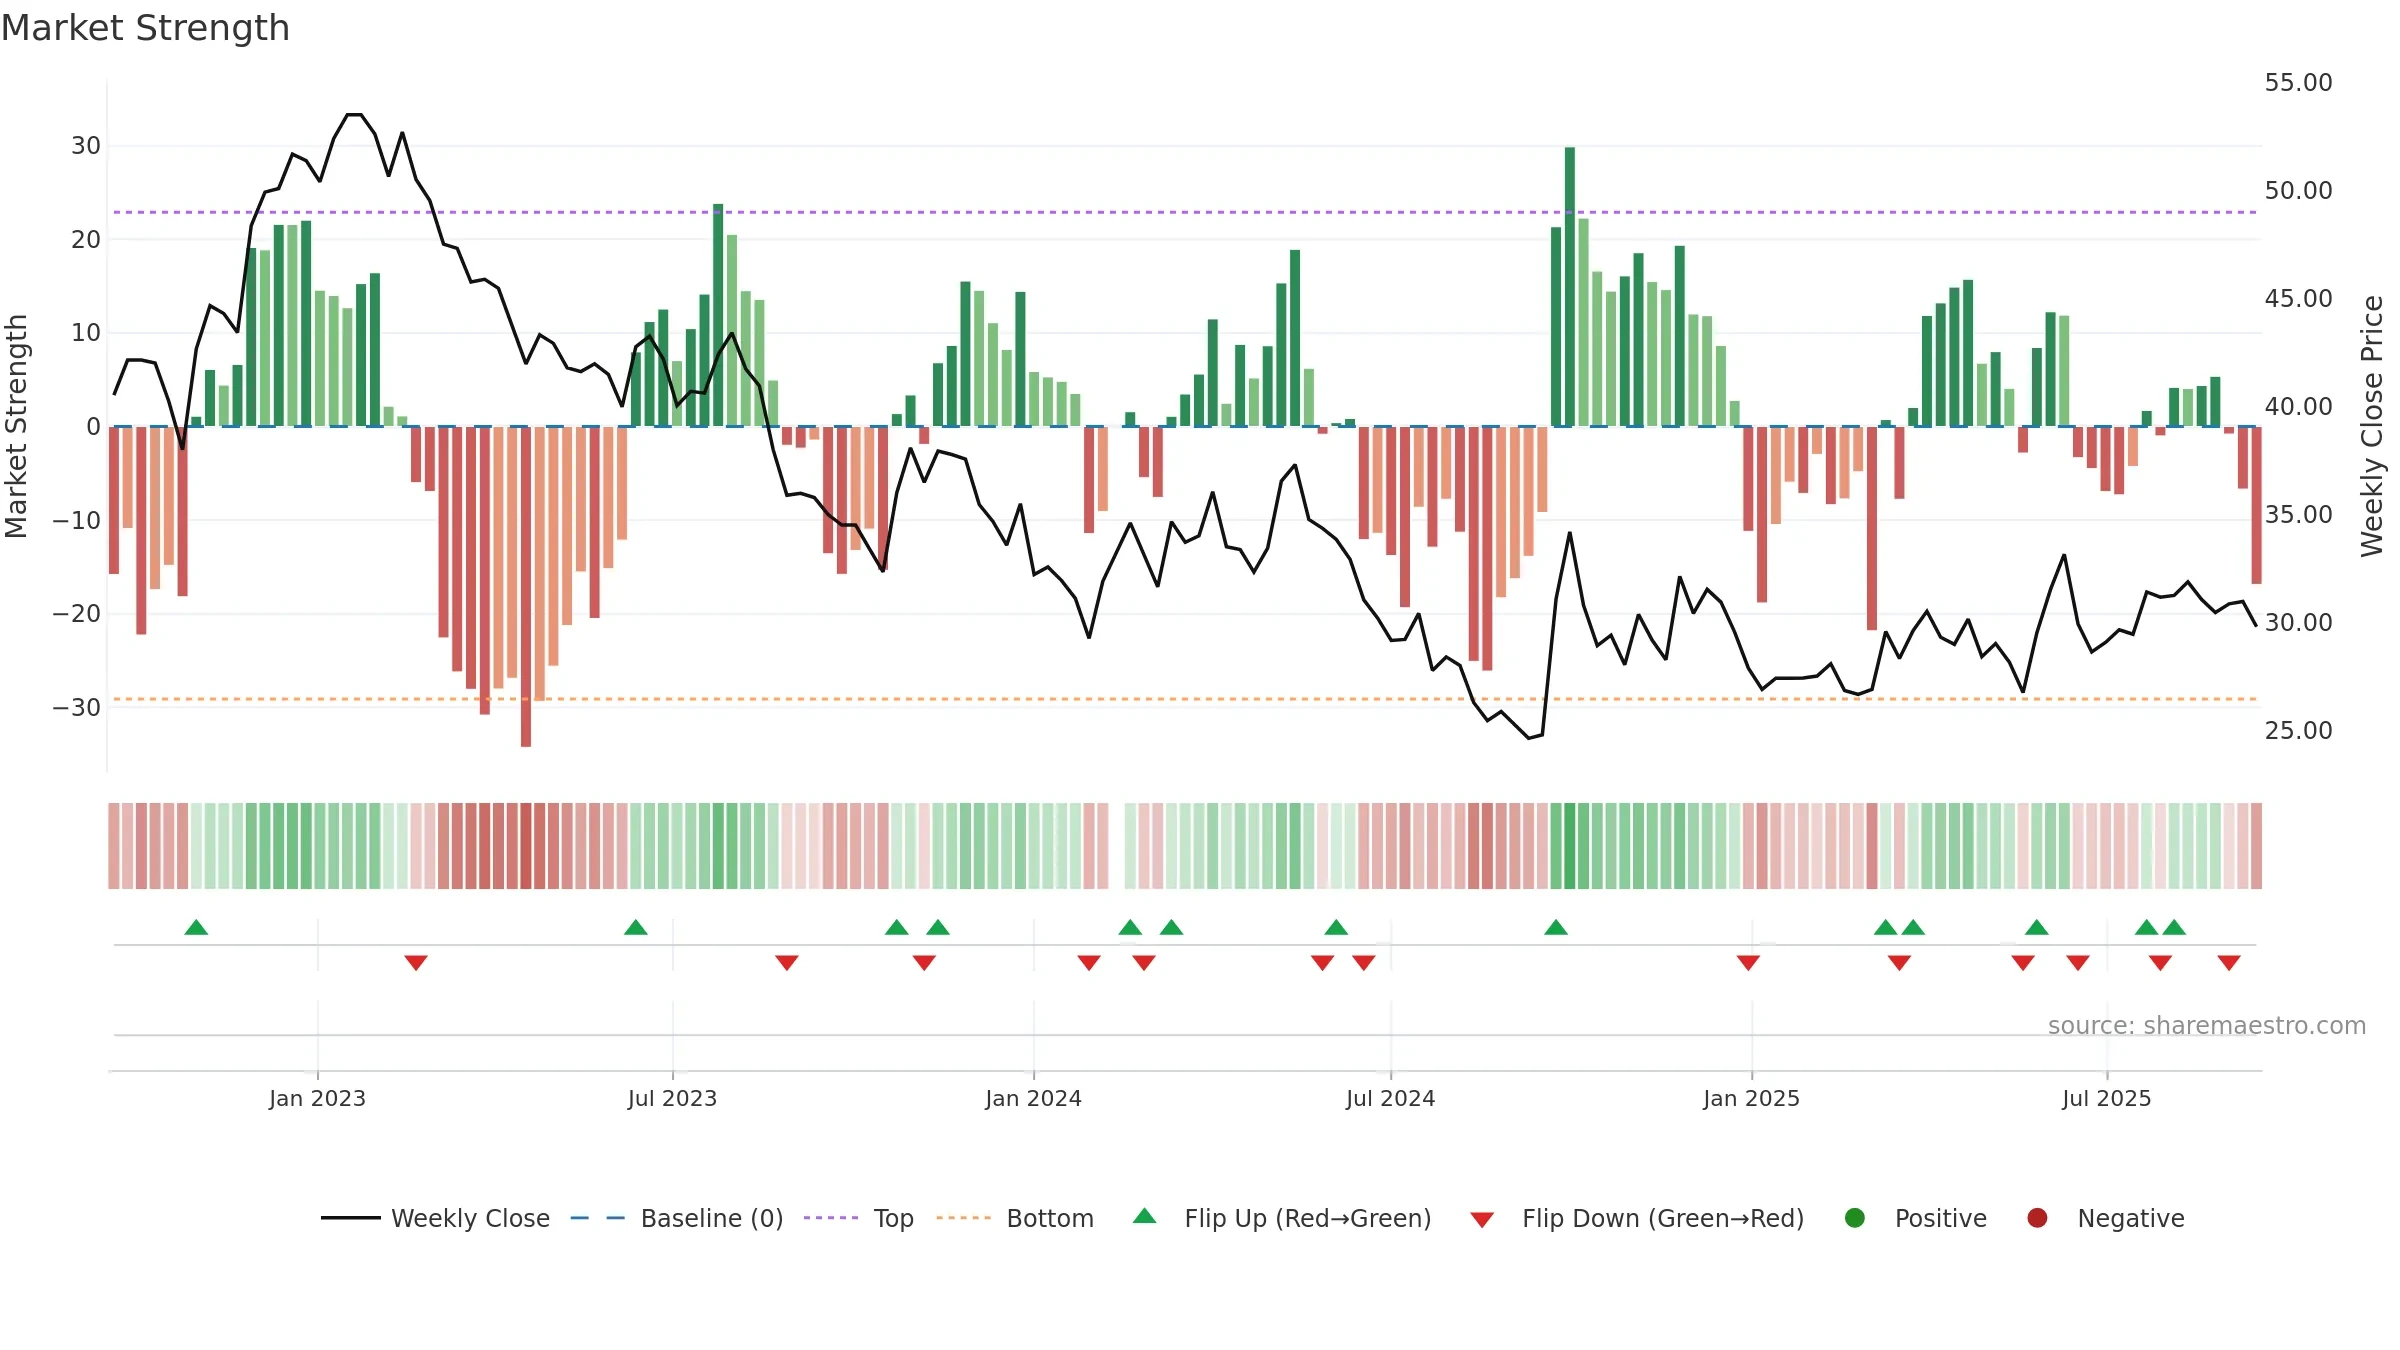
Gauge maps the trend signal to a 0–100 scale.
How to read this — High gauge and rising momentum — buyers in control.
Bias remains higher; pullbacks could be buyable if participation holds.
Price is below fair value; potential upside if momentum constructive.
Conclusion
Positive setup. ★★★★☆ confidence. Price window: -4. Trend: Strong Uptrend; gauge 70. In combination, liquidity confirms the move.
- High gauge with rising momentum (strong uptrend)
- Momentum is bullish and rising
- Liquidity confirms the price trend
- Low return volatility supports durability
- Price is not above key averages
- Negative multi-week performance
Why: Price window -4.40% over 8w. Close is -6.52% below the prior-window high. Return volatility 1.93%. Volume trend falling. Liquidity convergence with price. Trend state strong uptrend. Momentum bullish and rising. Valuation supportive skew.
Tip: Most metrics include a hover tooltip where they appear in the report.