Skechers U.S.A., Inc.
SKX NYSE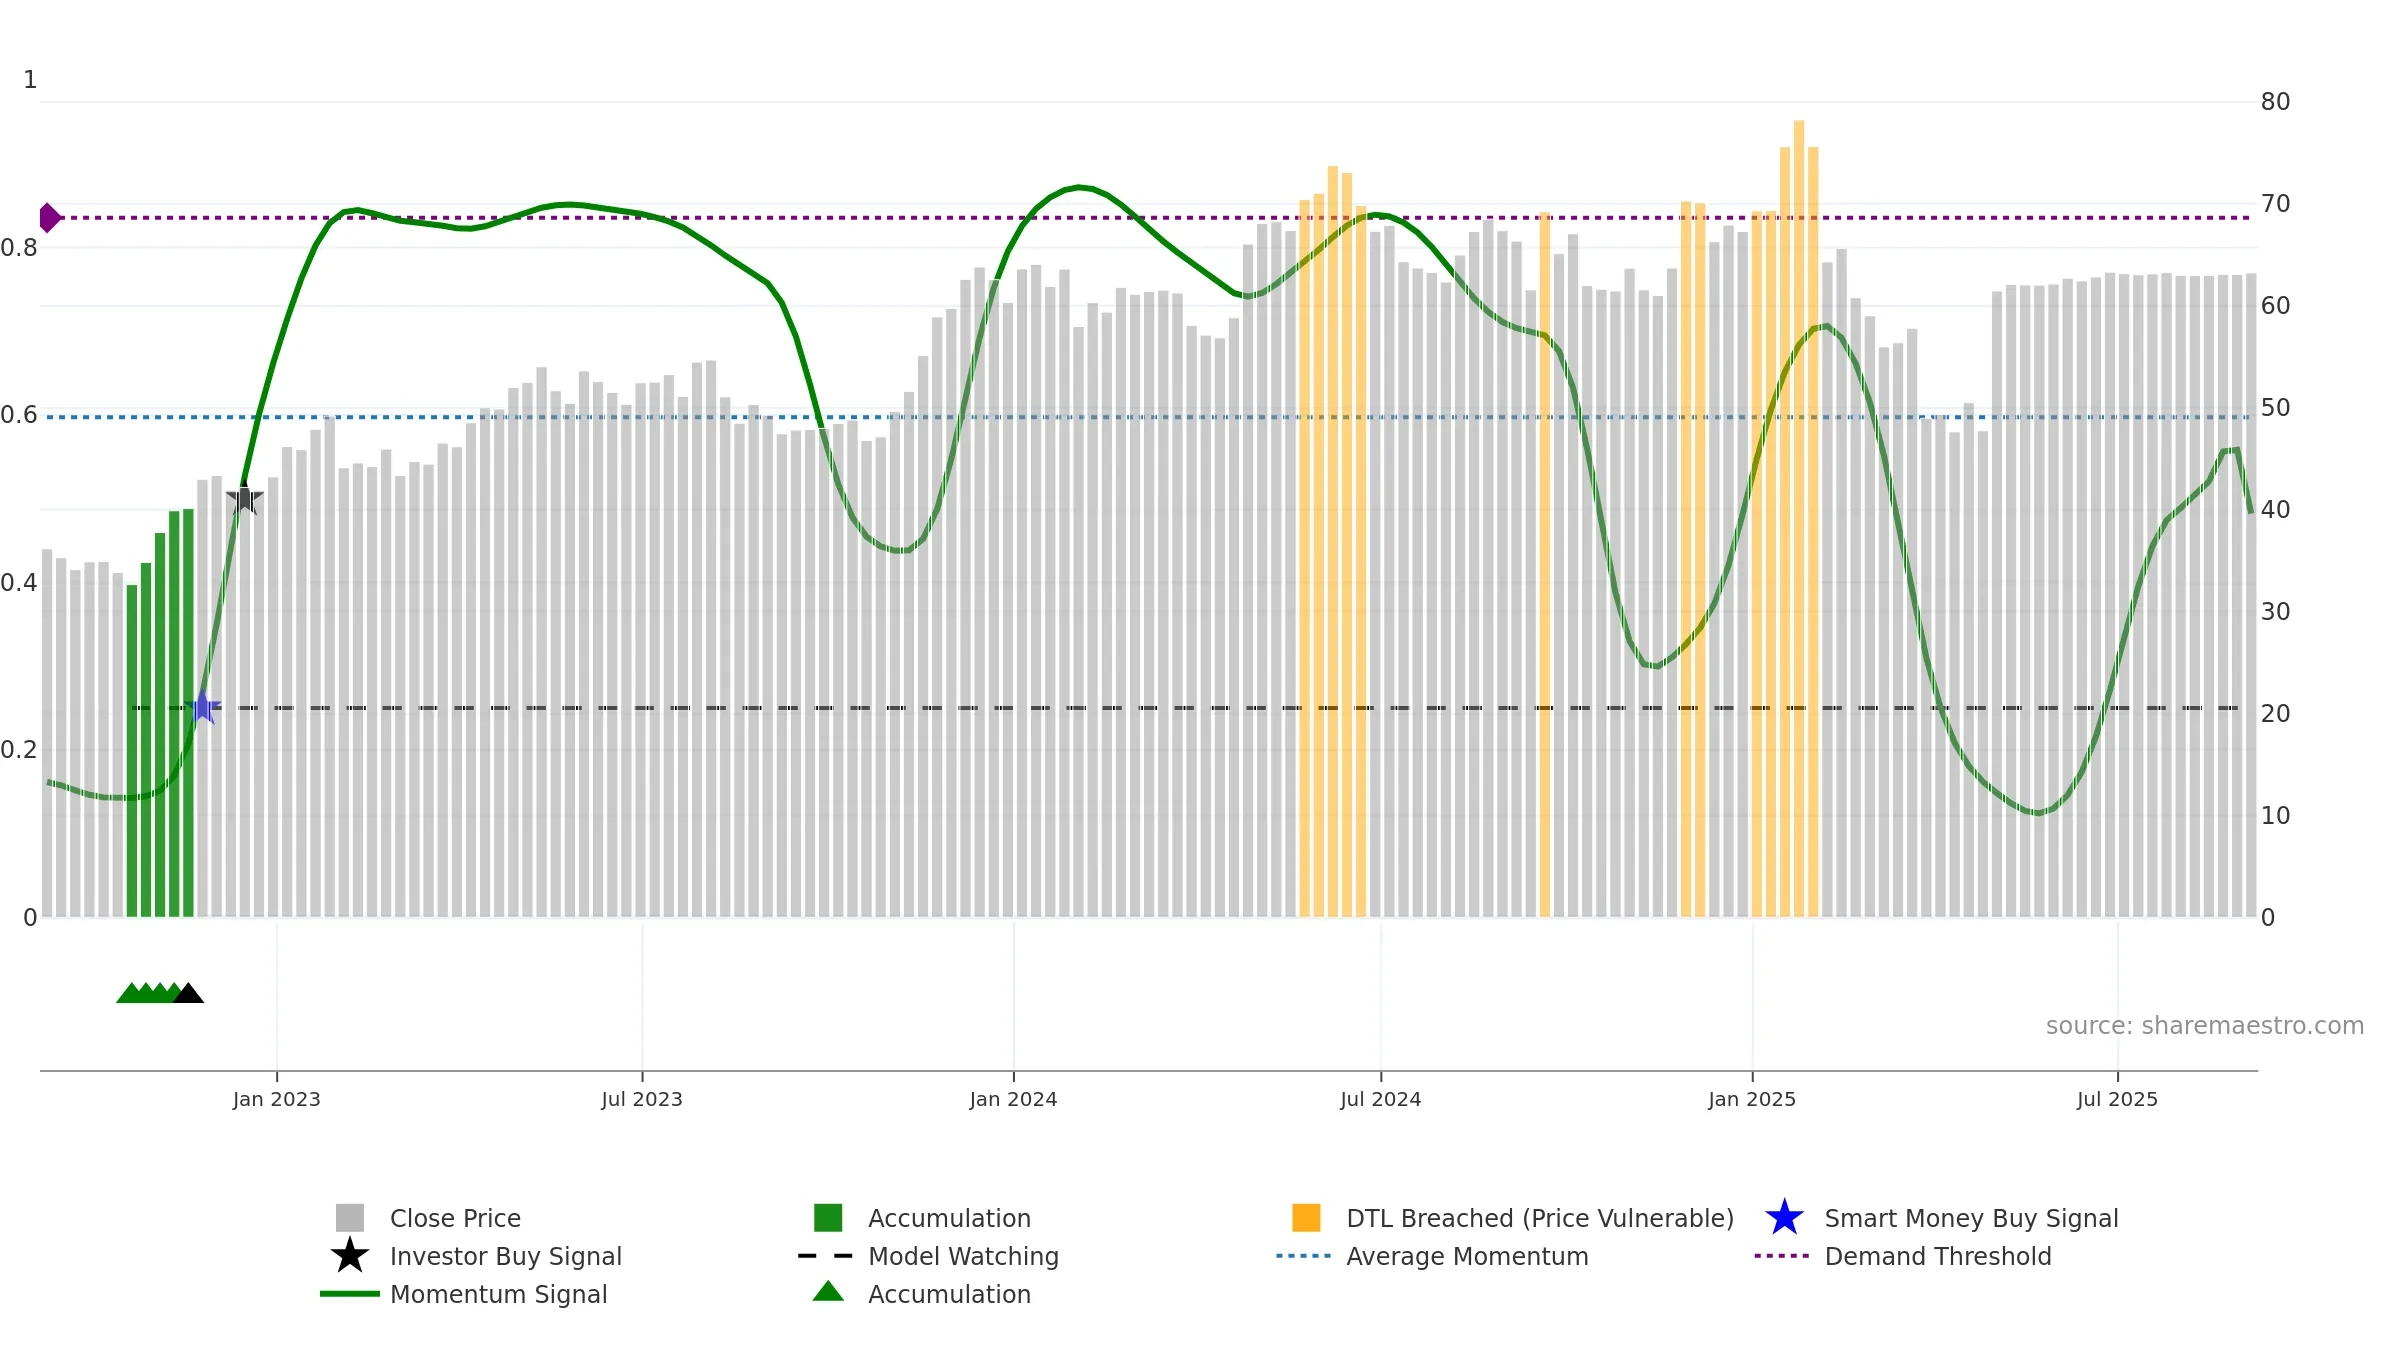
Weekly Report
Skechers U.S.A., Inc. closed at 63.2200 (0.03% WoW) . Data window ends Fri, 05 Sep 2025.
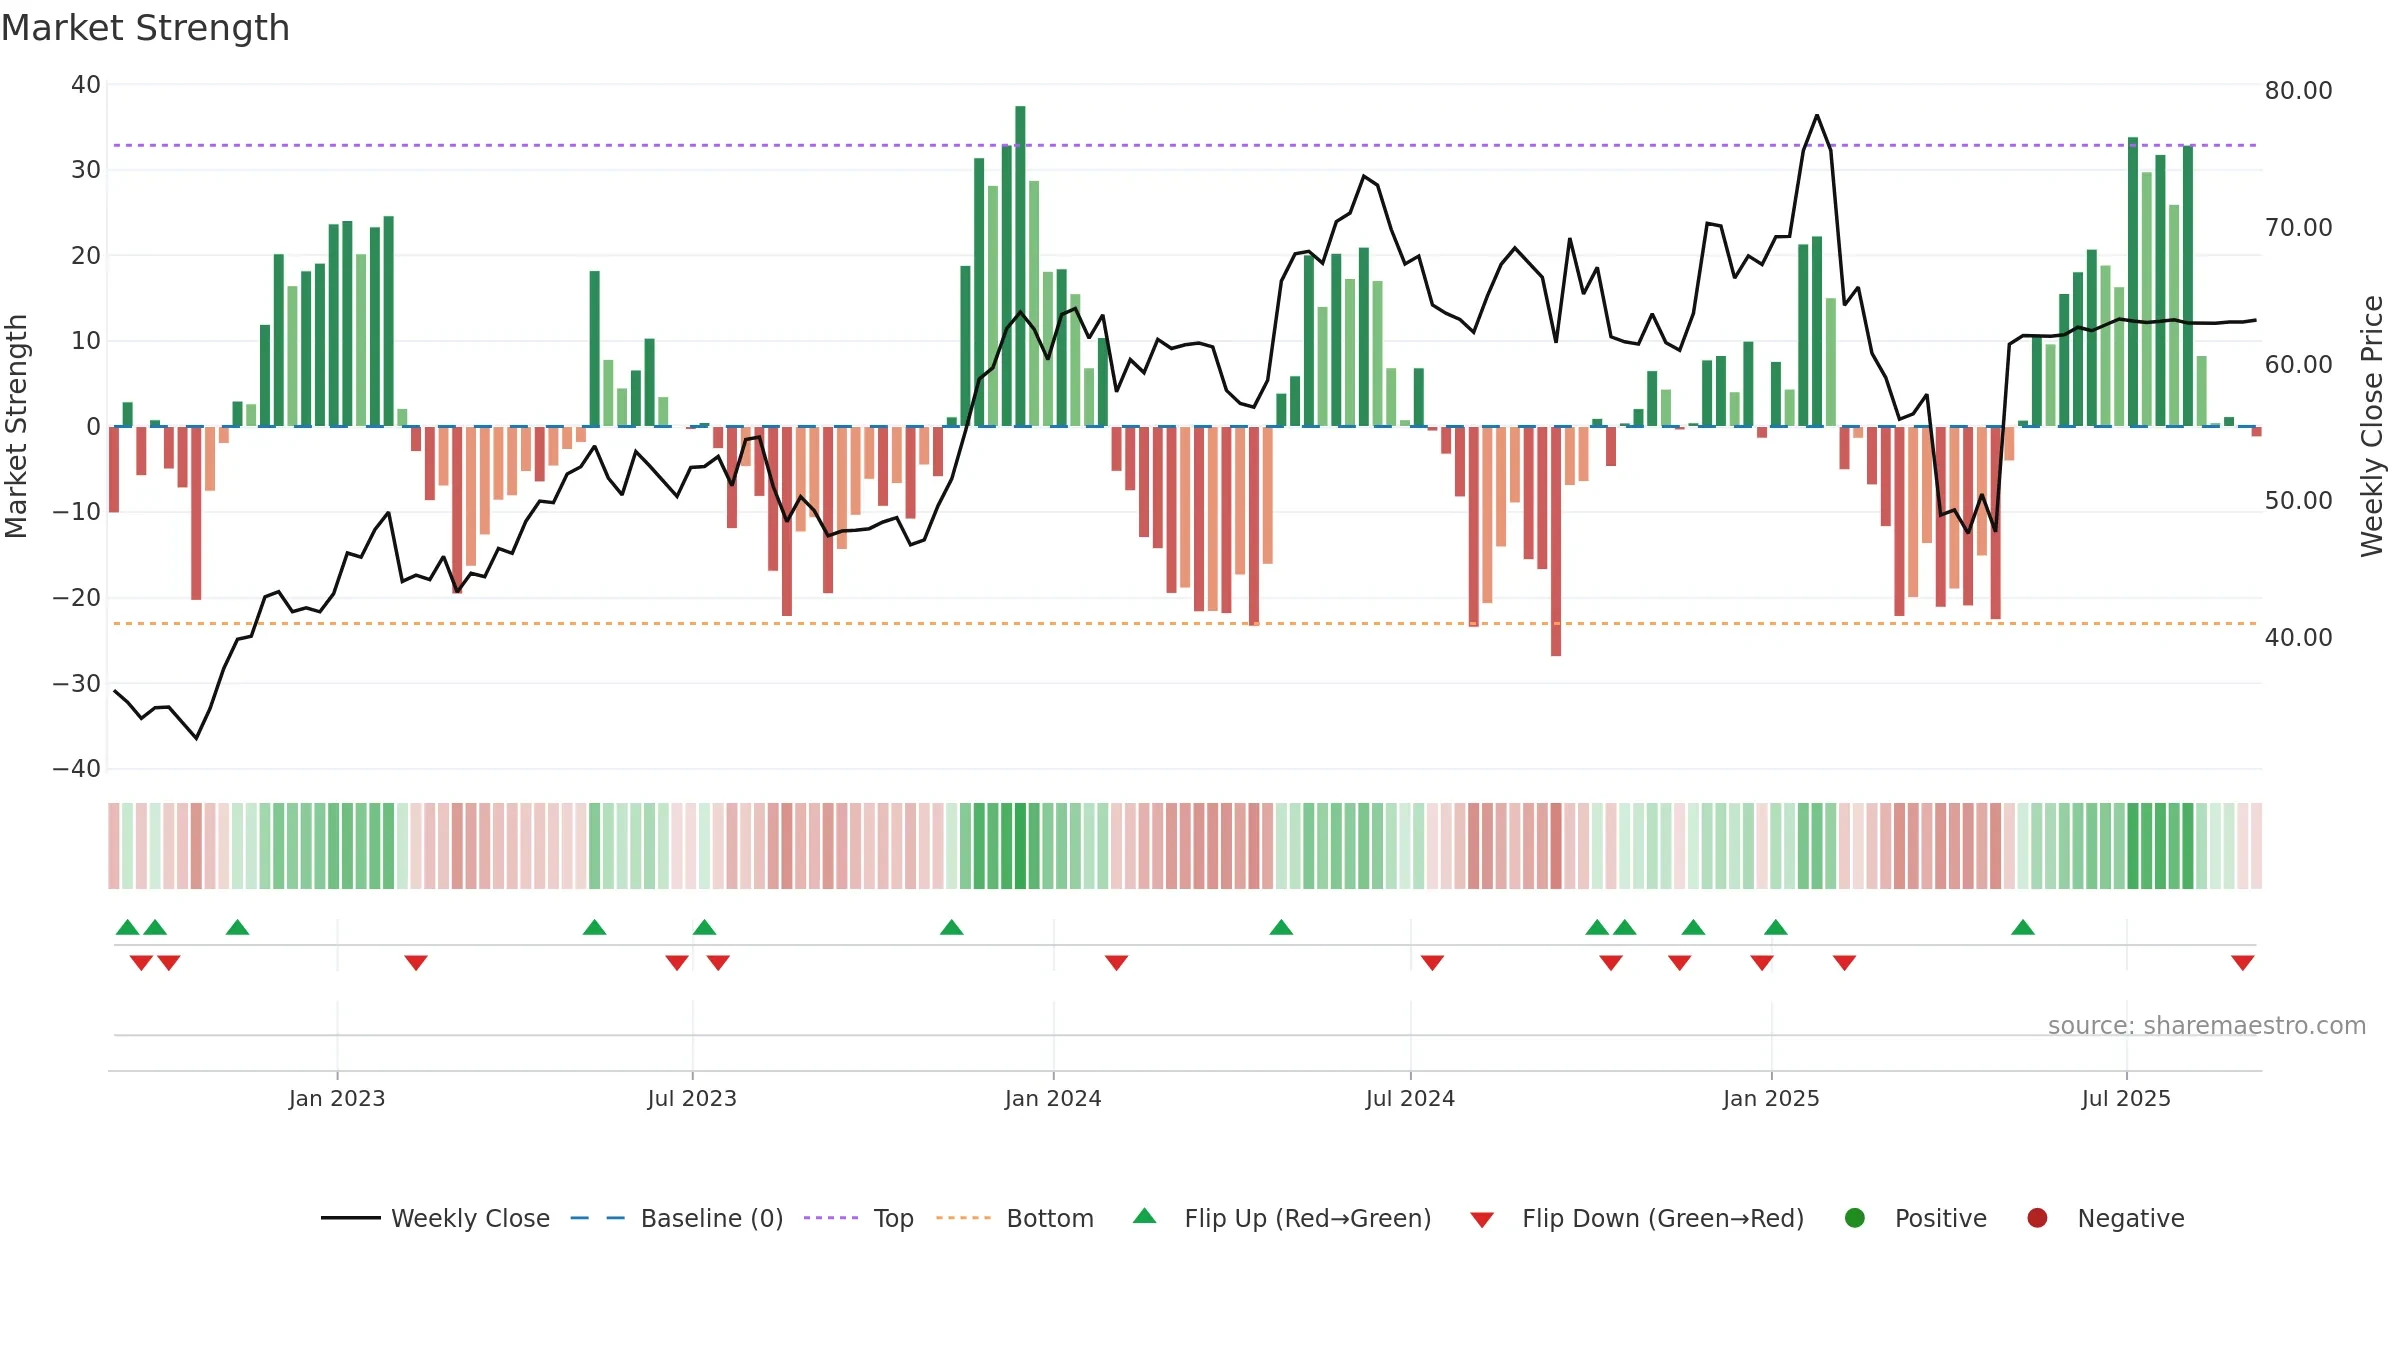
How to read this — Price slope is upward, indicating persistent buying over the window. Low weekly volatility favours steadier follow-through. Volume trend diverges from price — watch for fatigue or rotation. Returns are positively correlated with volume — strength tends to arrive on higher activity. Distance to baseline is narrowing — reverting closer to its fair-value track. Constructive MA stack supports the up-drift; pullbacks may find support at the 8–13 week region. Fresh short-term crossover improves near-term tone. Price holds above key averages, indicating constructive participation.
Up-slope supports buying interest; pullbacks may be contained if activity stays firm. Because liquidity isn’t confirming, prefer evidence of fresh demand before chasing moves.
Gauge maps the trend signal to a 0–100 scale.
How to read this — Range-bound conditions; conviction is limited until a break or acceleration emerges.
Wait for a directional break or improving acceleration.
Price is below fair value; potential upside if momentum constructive.
Conclusion
Positive setup. ★★★★☆ confidence. Price window: 0. Trend: Range / Neutral; gauge 48. In combination, liquidity diverges from price.
- Price holds above 8w & 26w averages
- Constructive moving-average stack
- Low return volatility supports durability
- Liquidity diverges from price
Why: Price window 0.14% over 8w. Return volatility 0.09%. Volume trend falling. Liquidity divergence with price. Trend state range / neutral. MA stack constructive. 4–8w crossover bullish. Momentum neutral and rising. Valuation supportive skew.
Tip: Most metrics include a hover tooltip where they appear in the report.