NexPoint Real Estate Finance, Inc.
NREF NYSE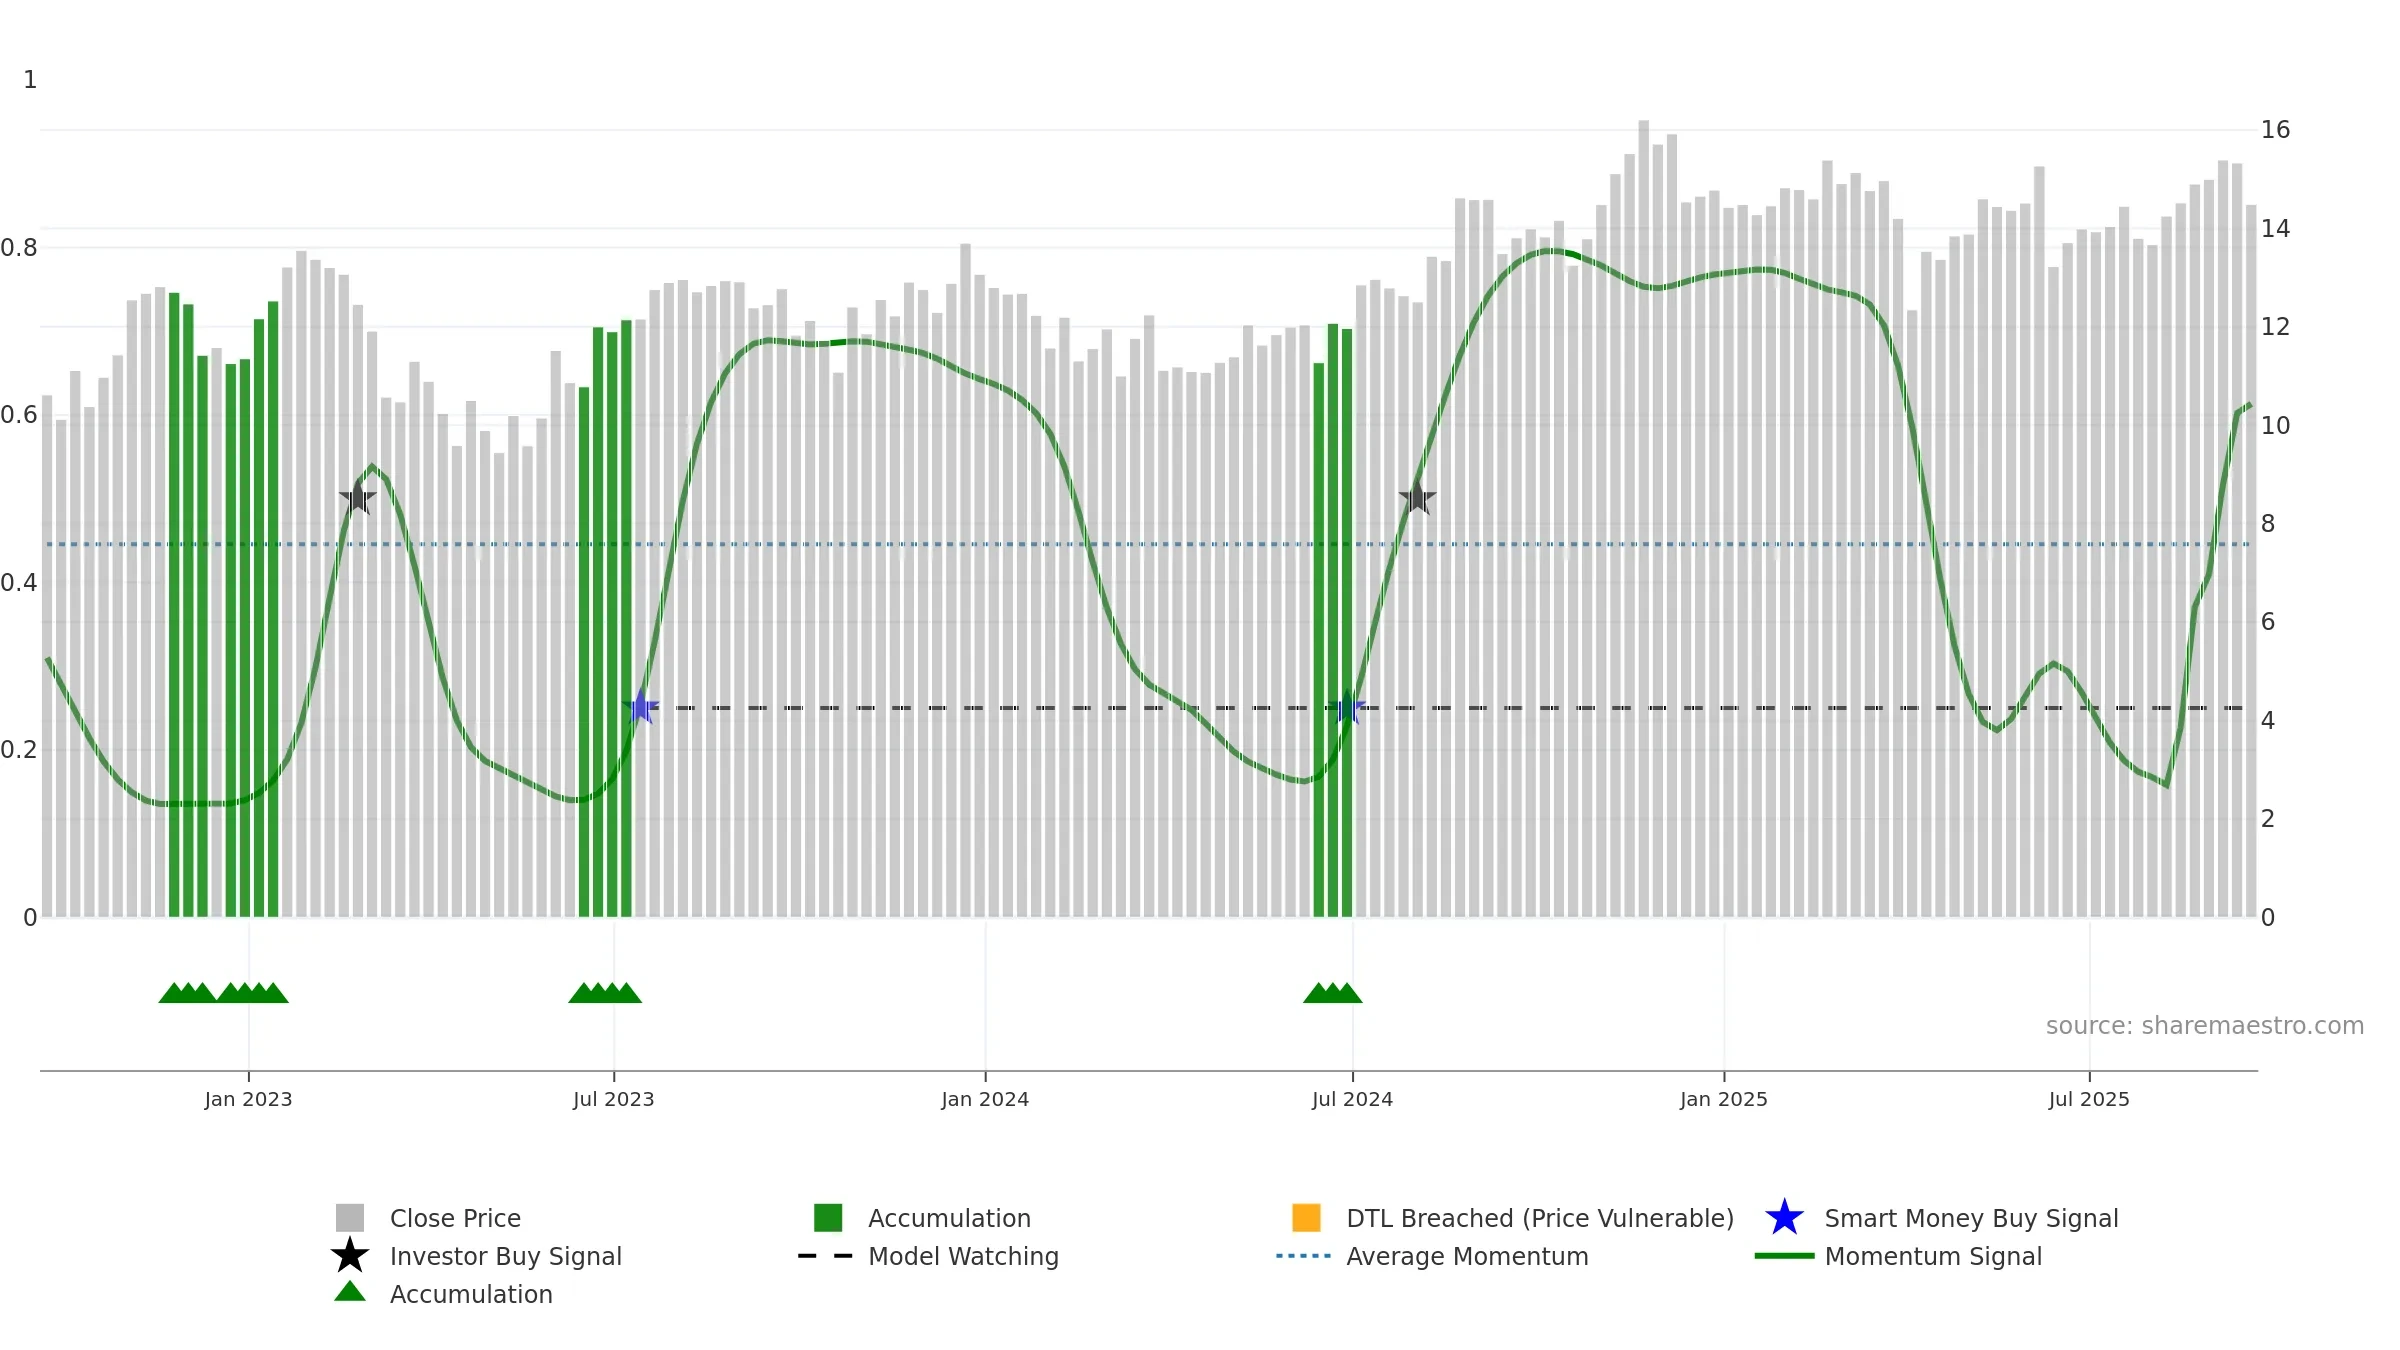
Weekly Summary
NexPoint Real Estate Finance, Inc. closed at 14.4900 (1.90% WoW) . Data window ends Fri, 19 Sep 2025.
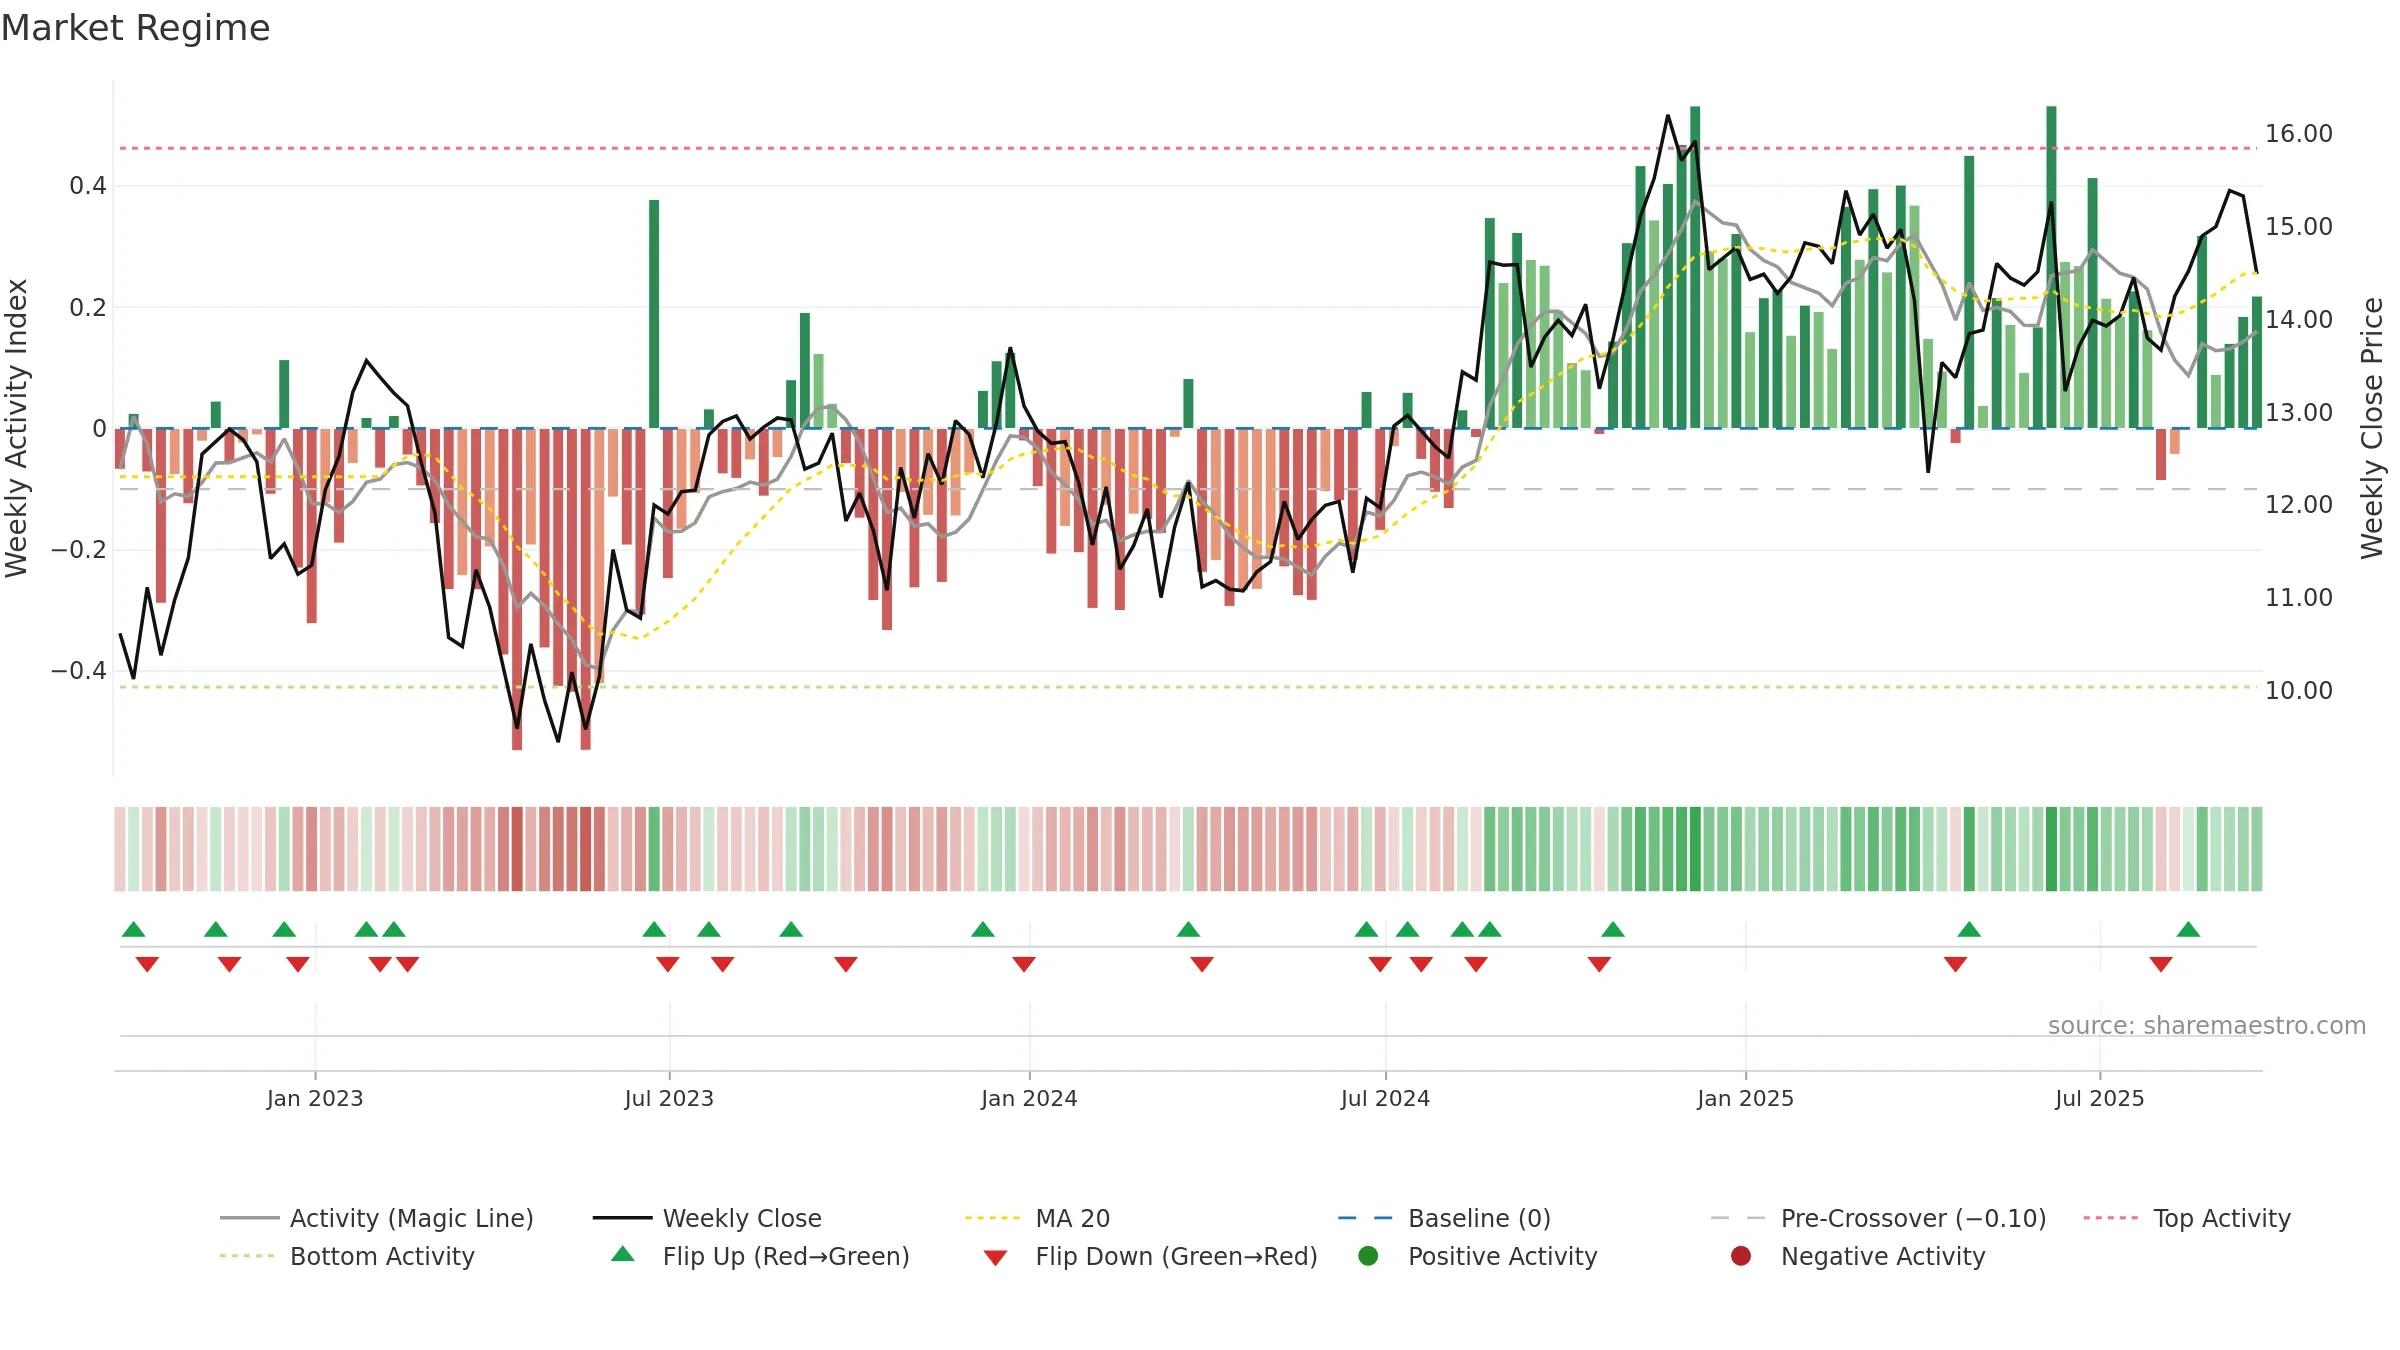
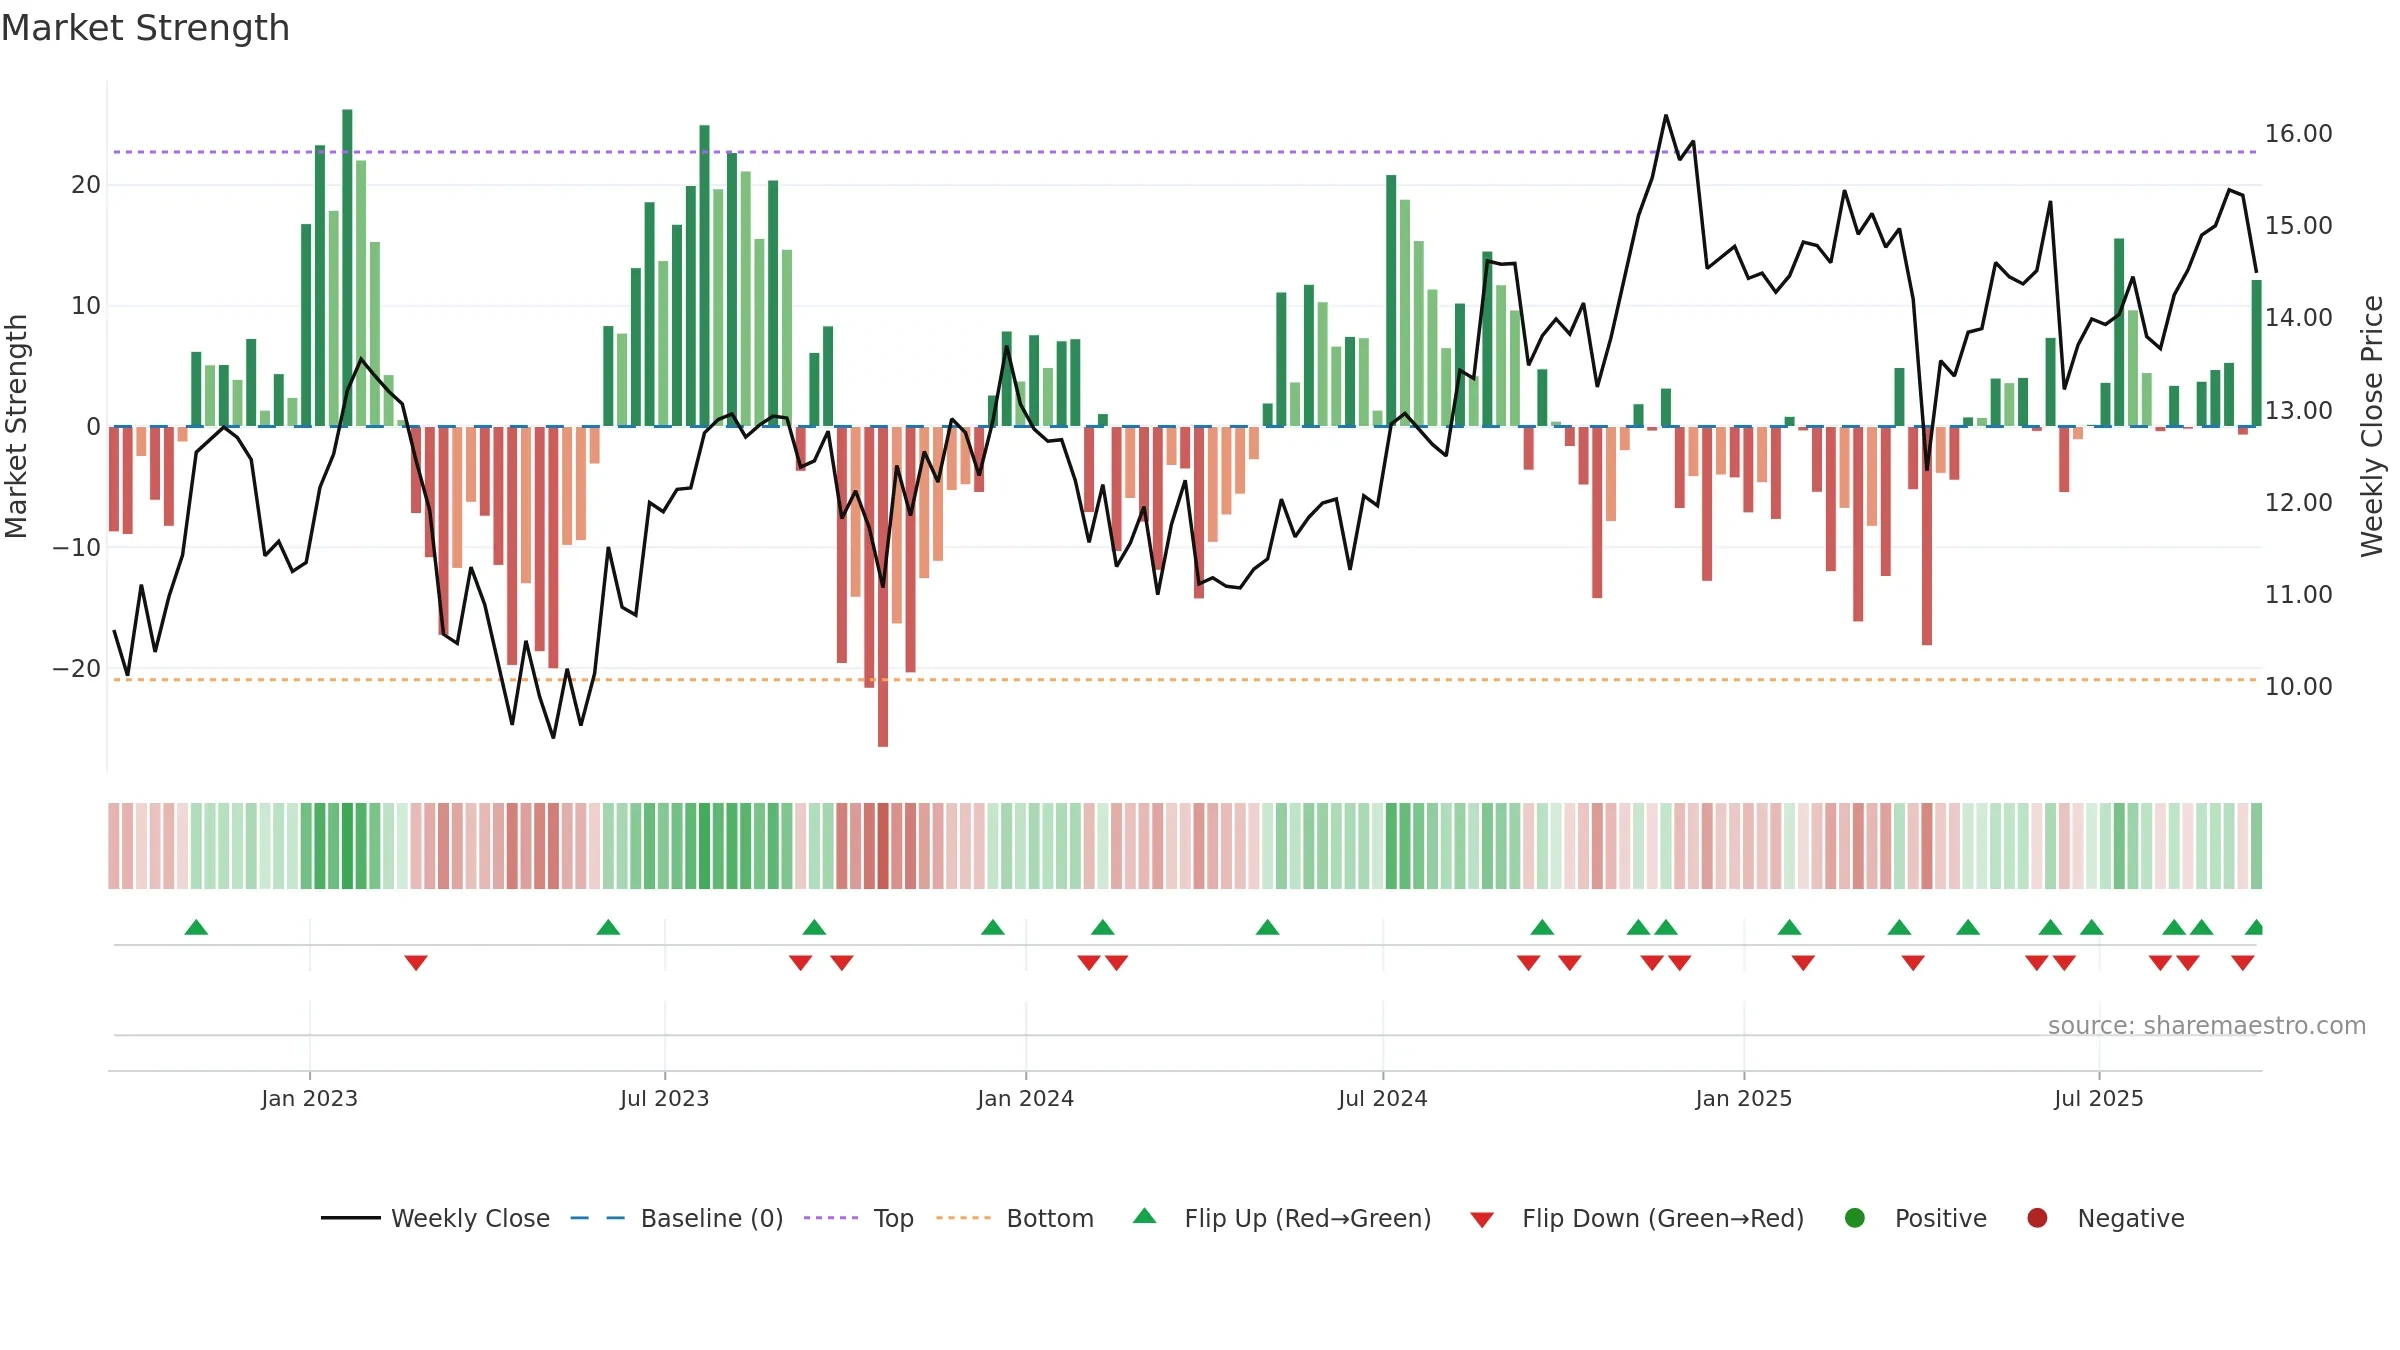
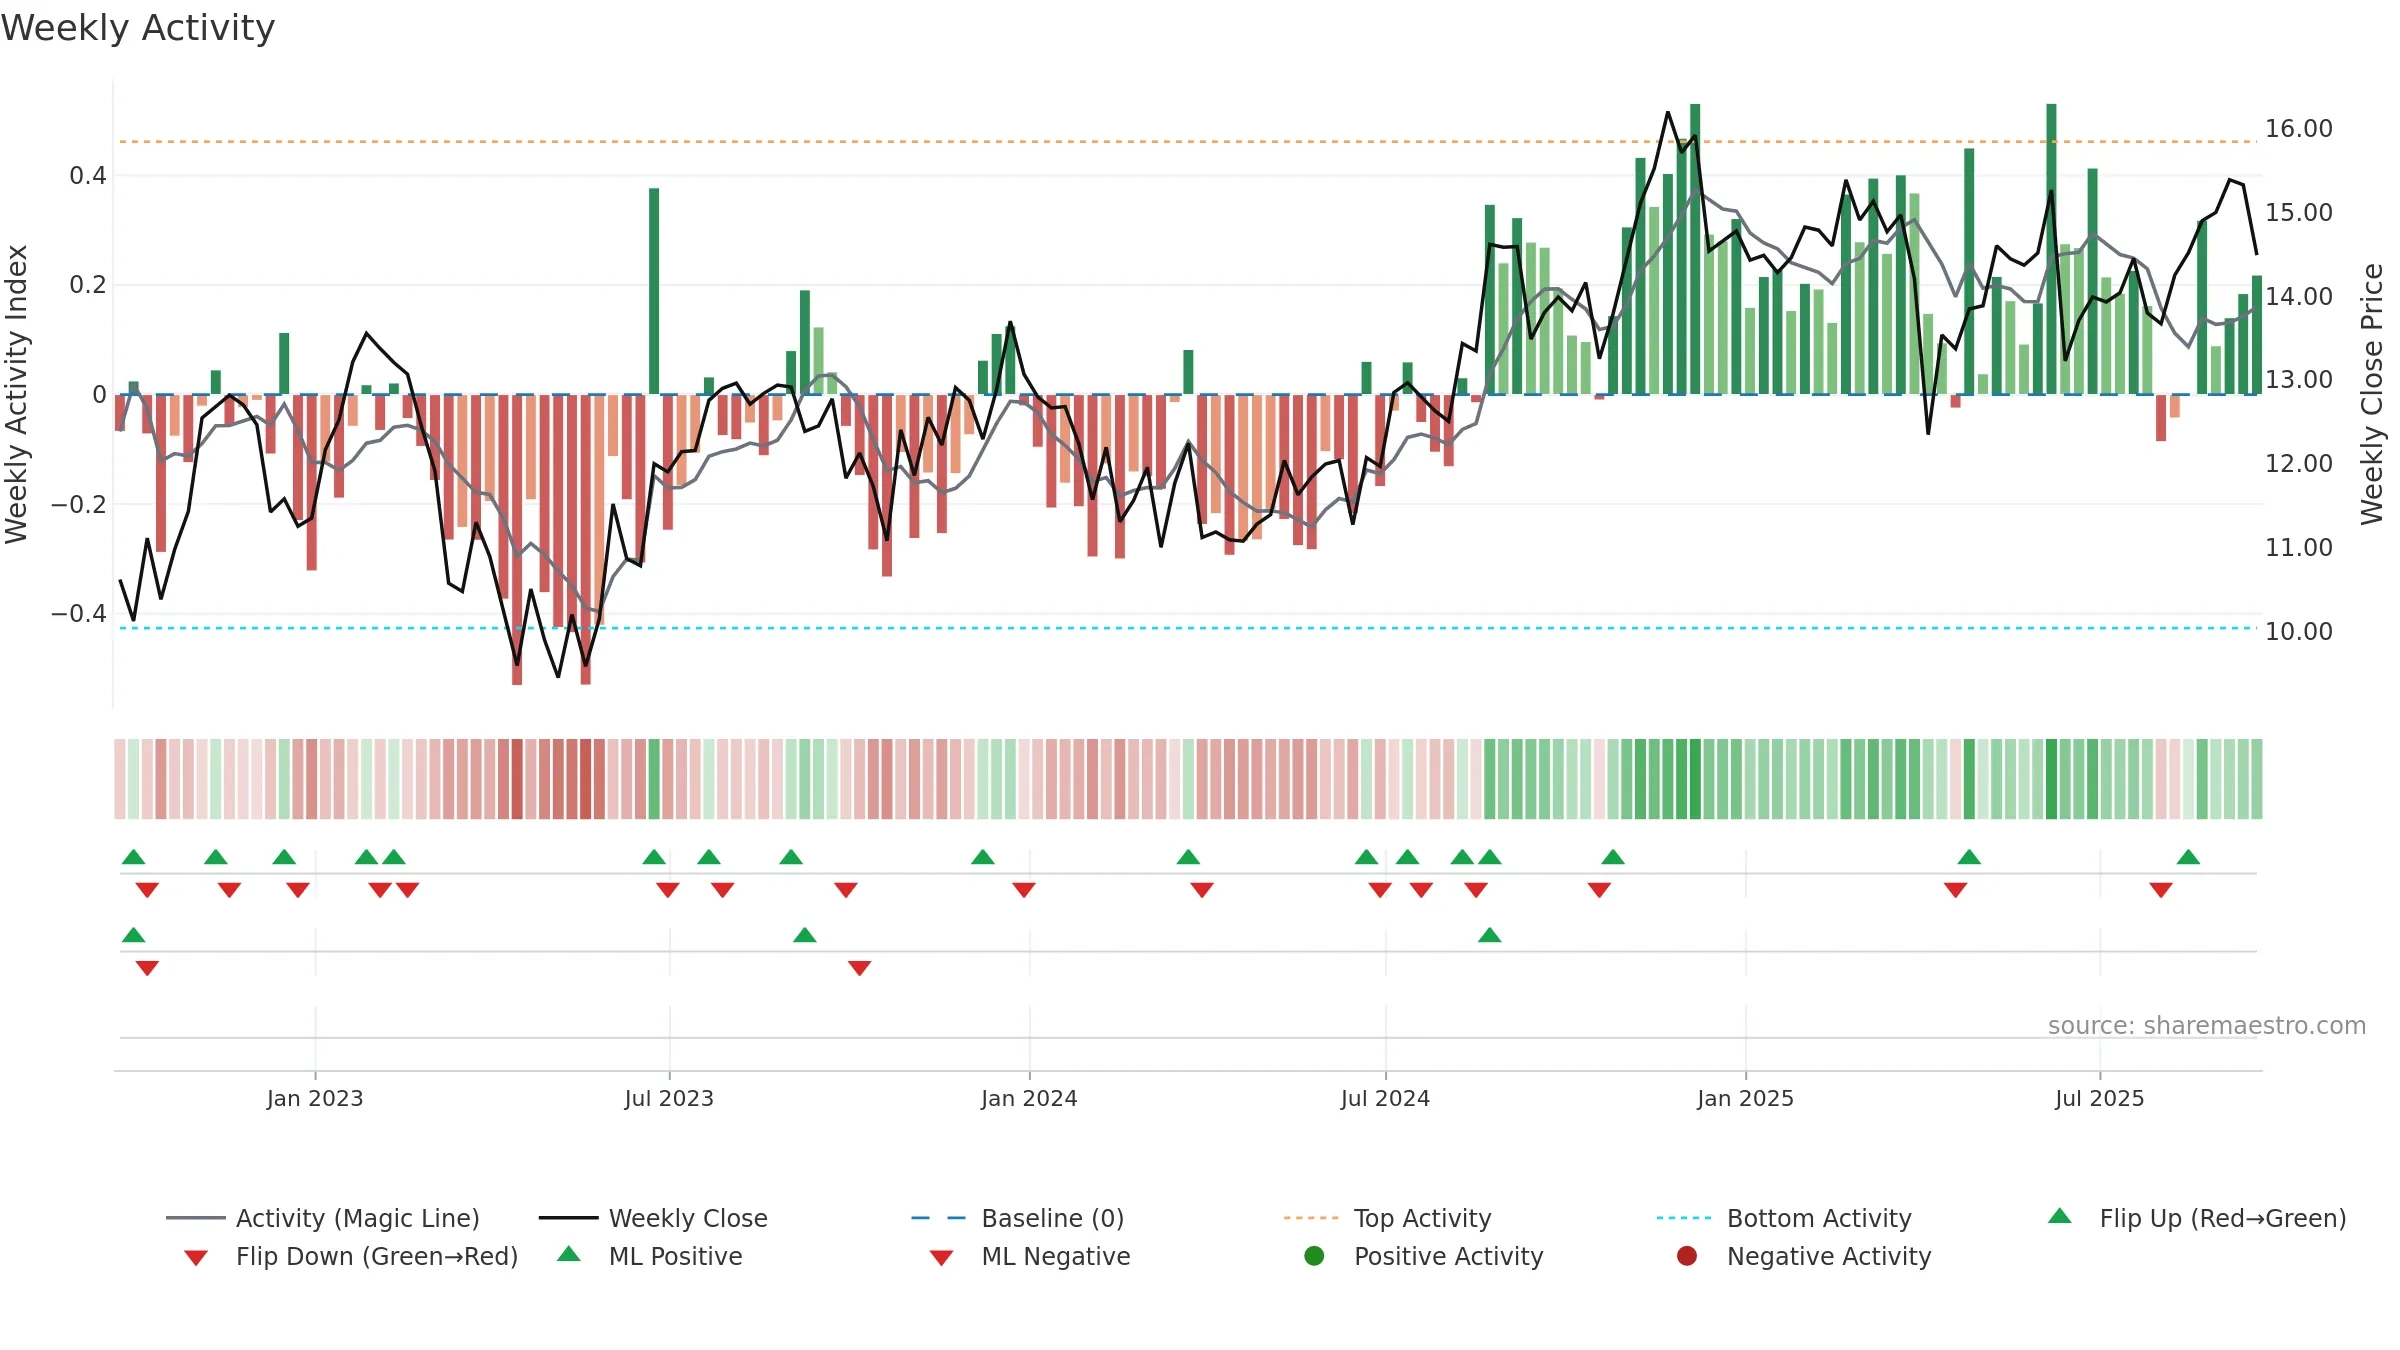
How to read this — Price slope is upward, indicating persistent buying over the window. Low weekly volatility favours steadier follow-through. Volume and price are moving in the same direction — a constructive confirmation. Returns are positively correlated with volume — strength tends to arrive on higher activity. Constructive MA stack supports the up-drift; pullbacks may find support at the 8–13 week region.
Up-slope supports buying interest; pullbacks may be contained if activity stays firm.
Gauge maps the trend signal to a 0–100 scale.
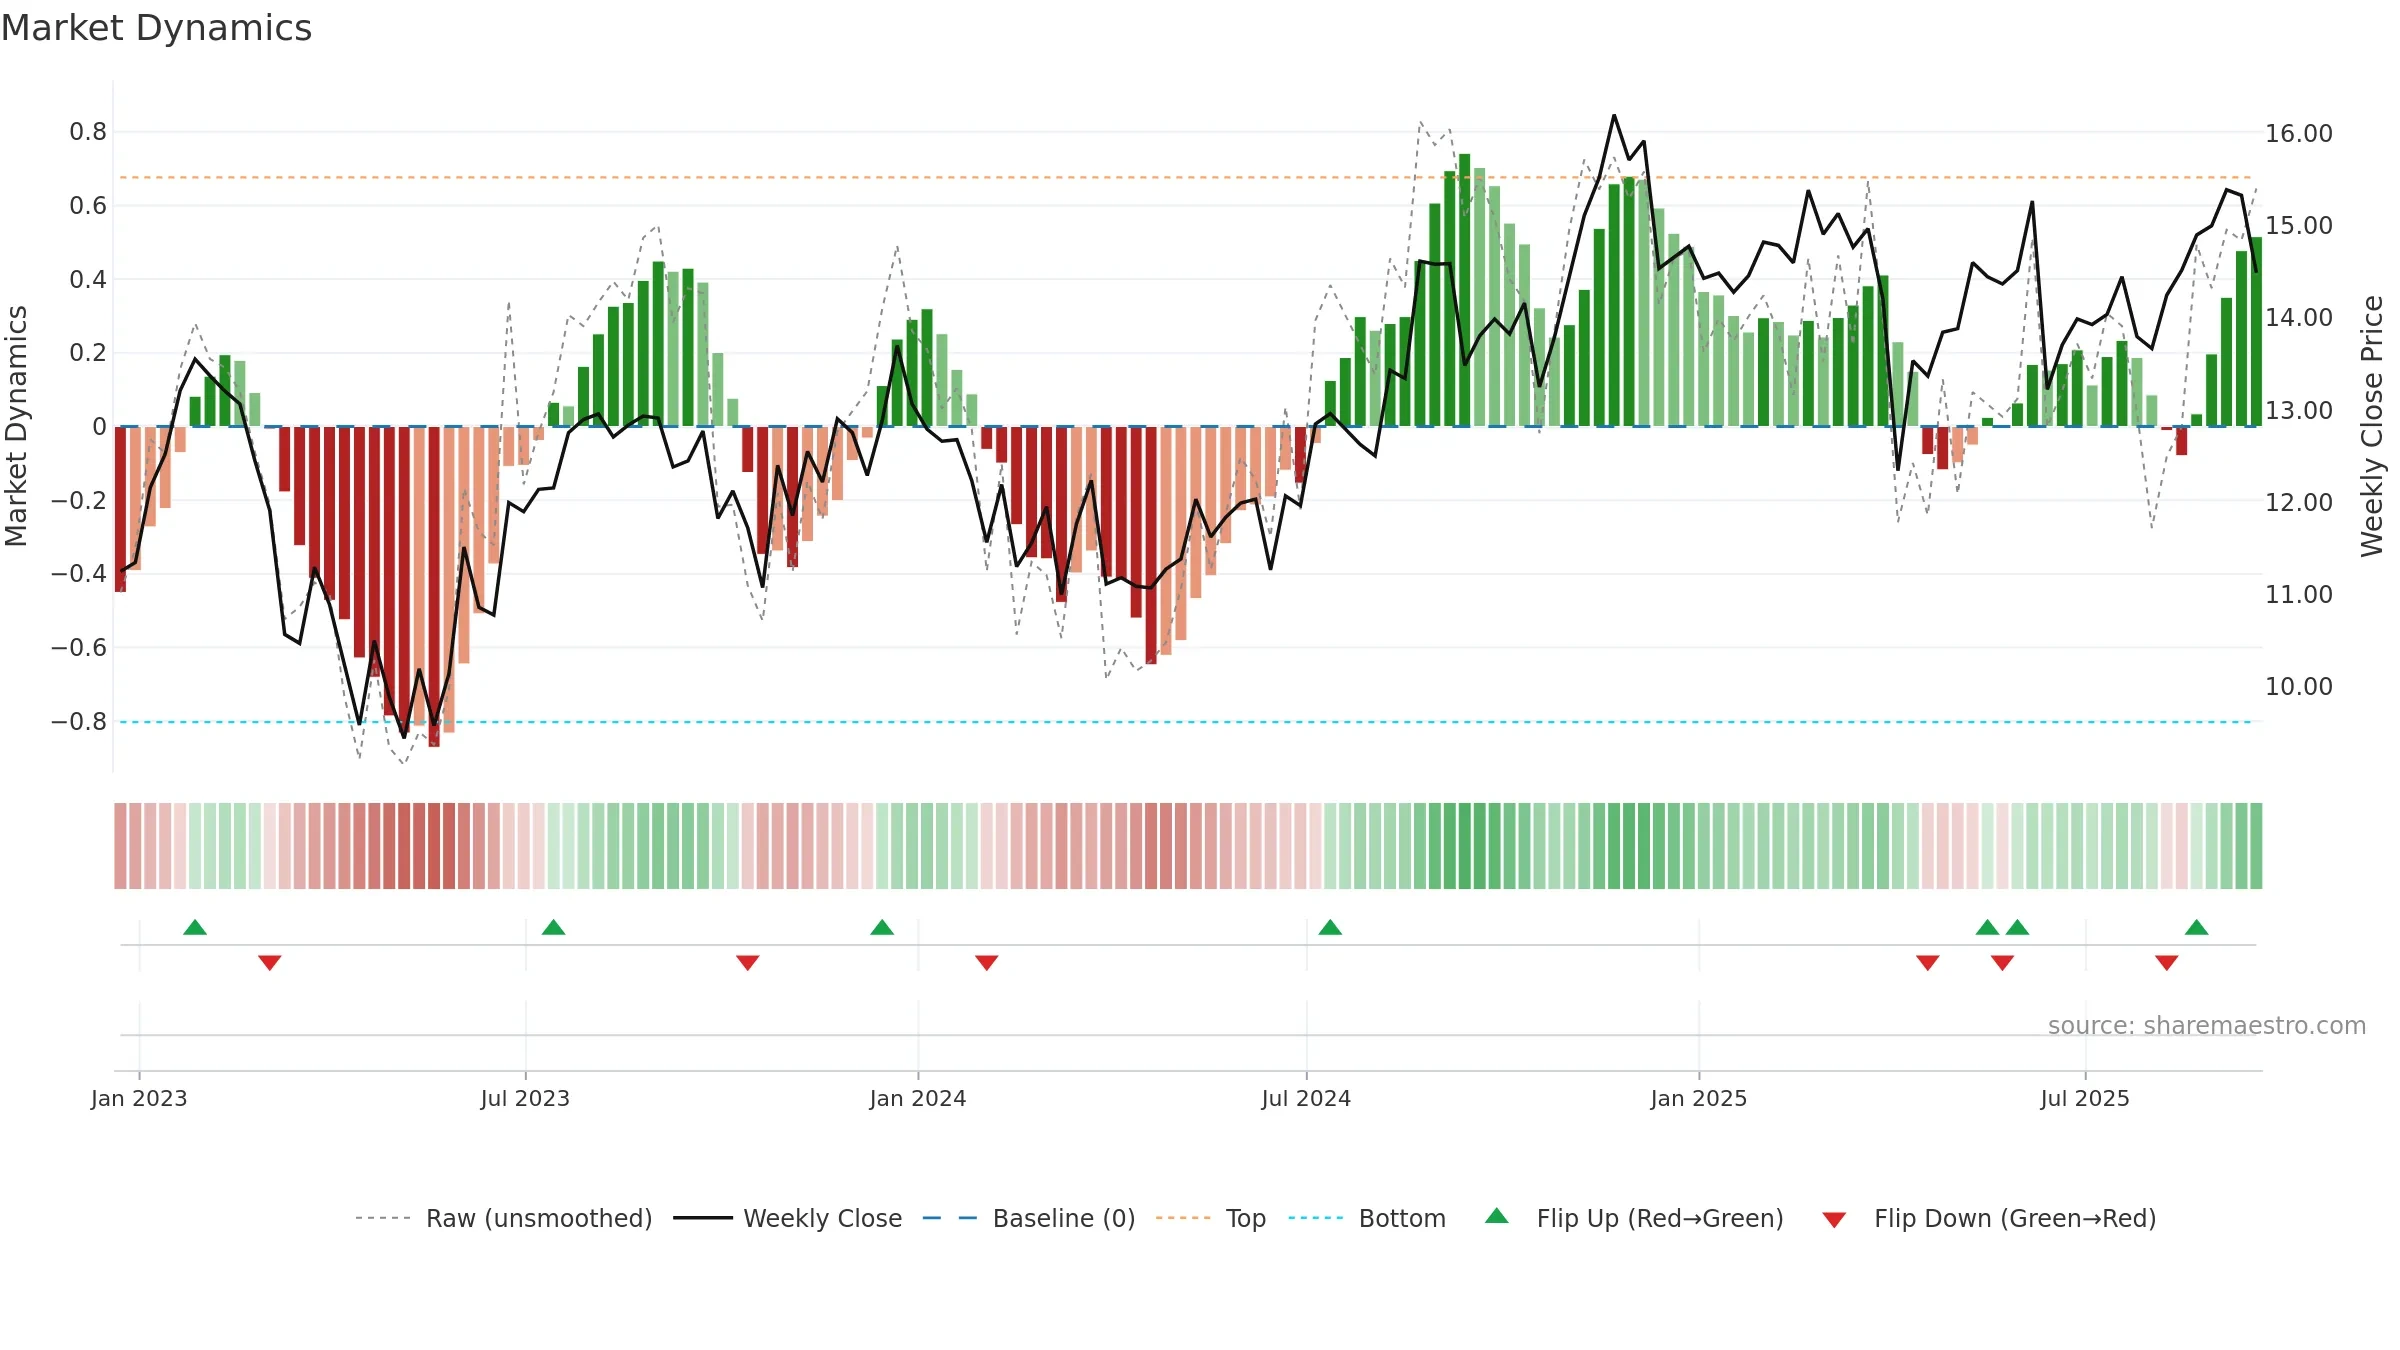
How to read this — High gauge and rising momentum — buyers in control.
Bias remains higher; pullbacks could be buyable if participation holds.

Relative strength is Negative
(< 0%, underperforming).
Latest MRS: -5.72% (week ending Fri, 19 Sep 2025).
Slope: Rising over 8w.
Notes:
- Below zero line indicates relative weakness vs benchmark.
- MRS slope rising over ~8 weeks.
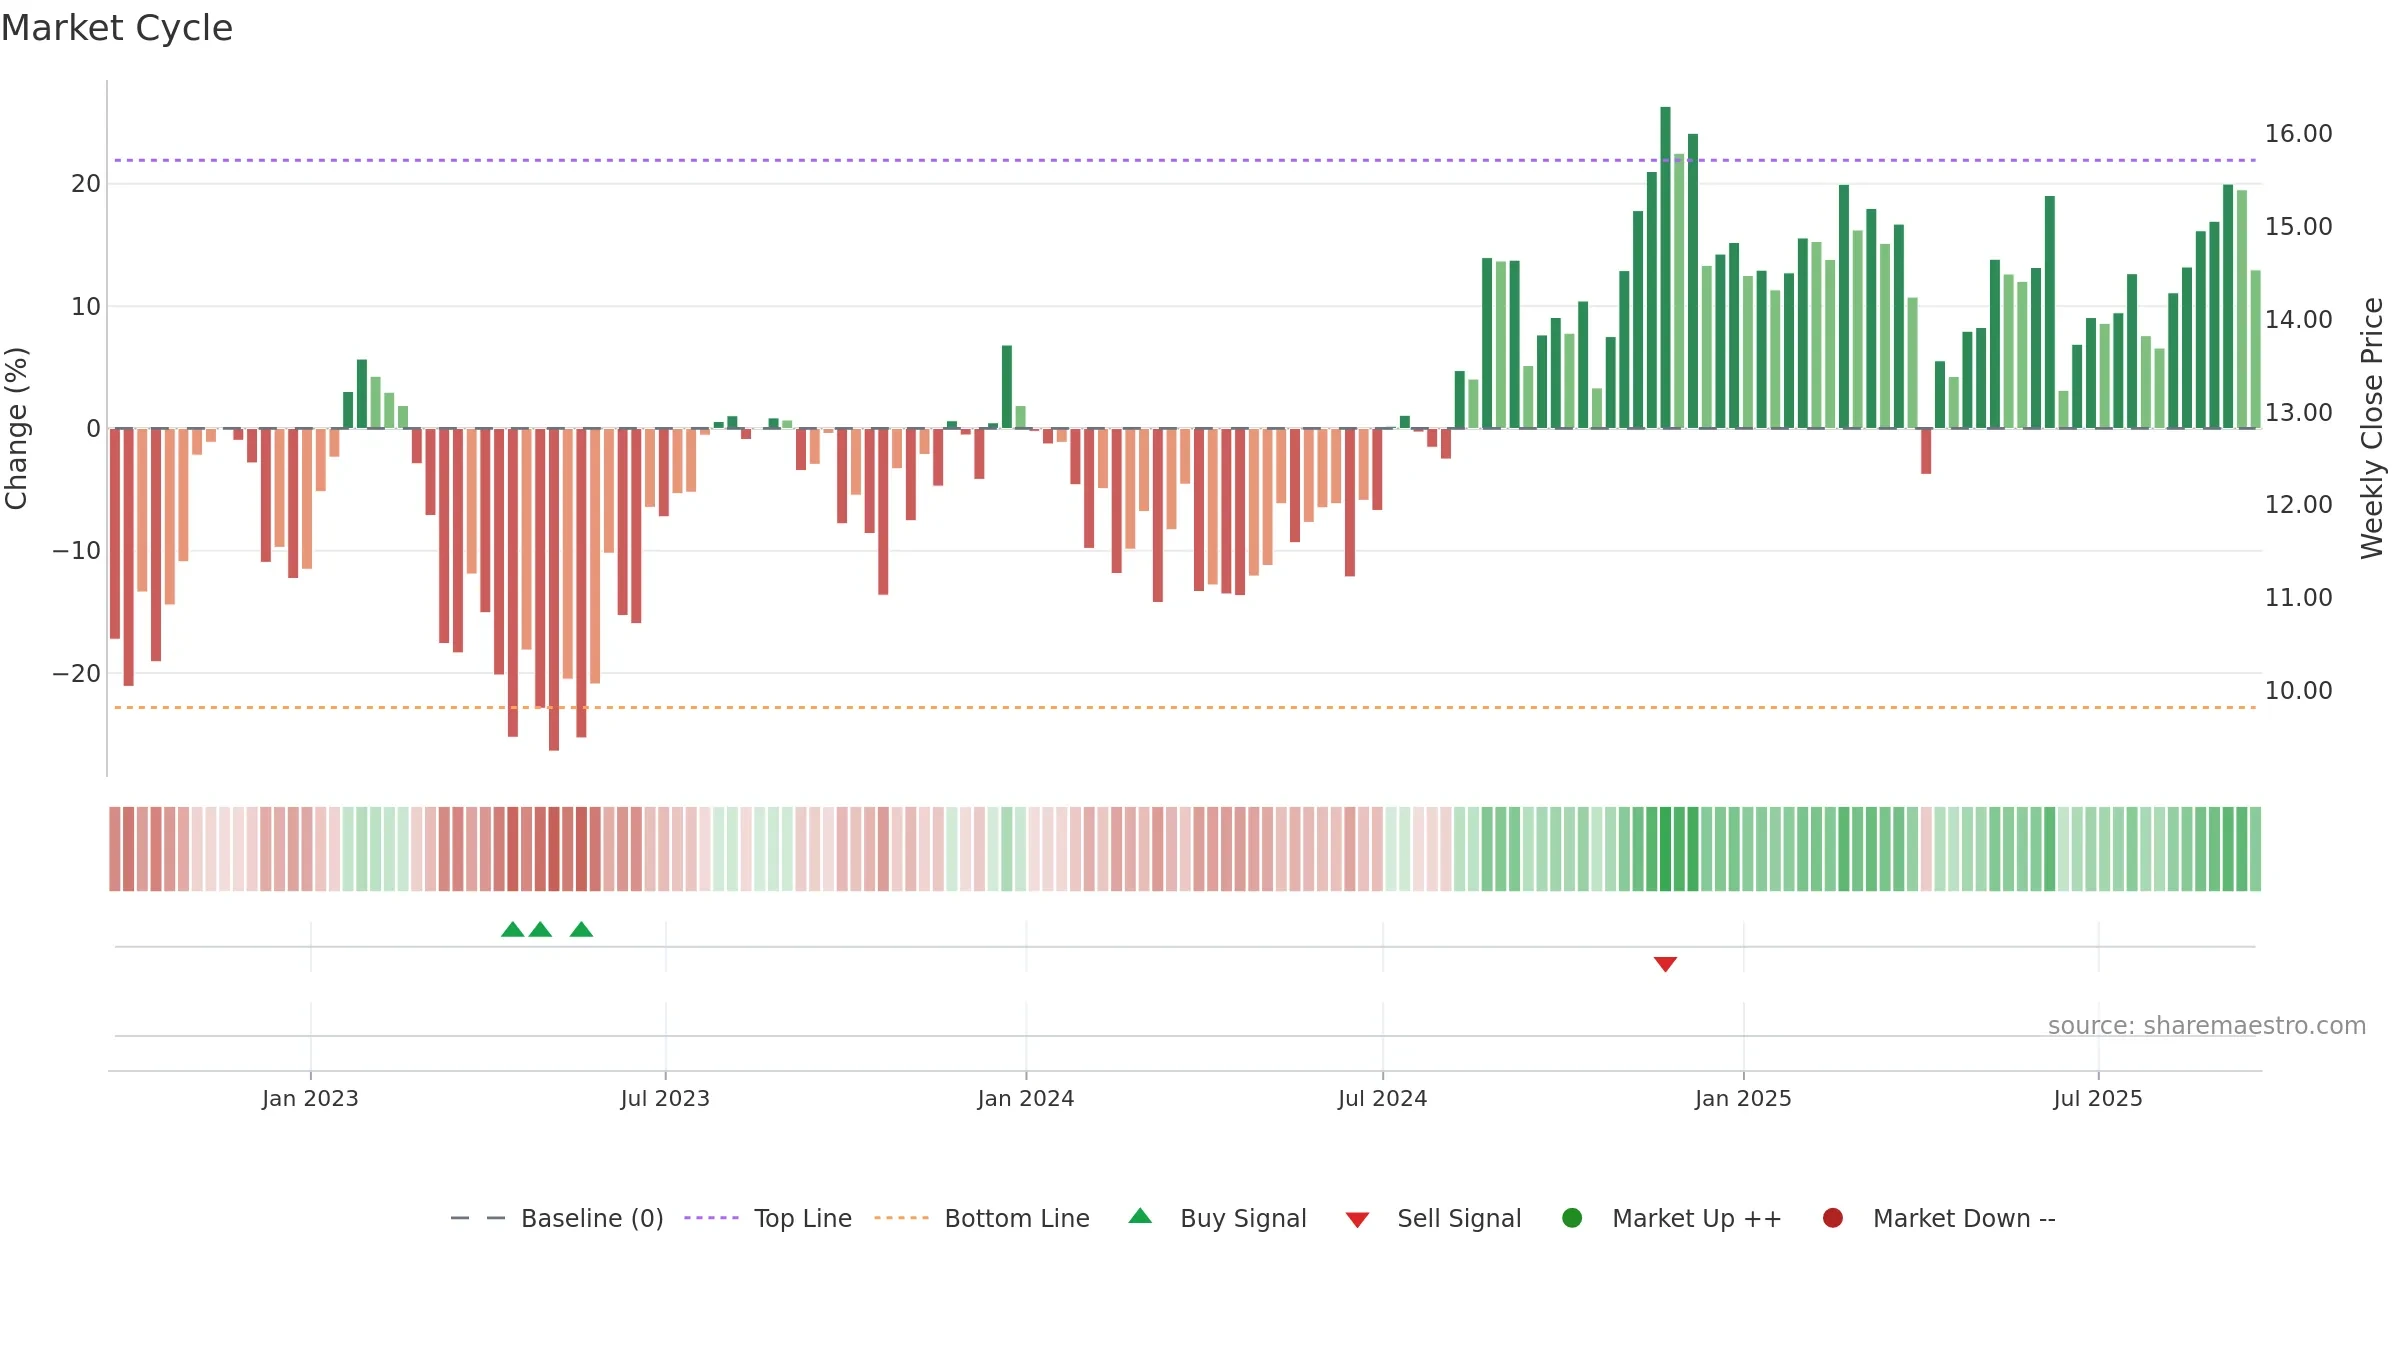
Conclusion
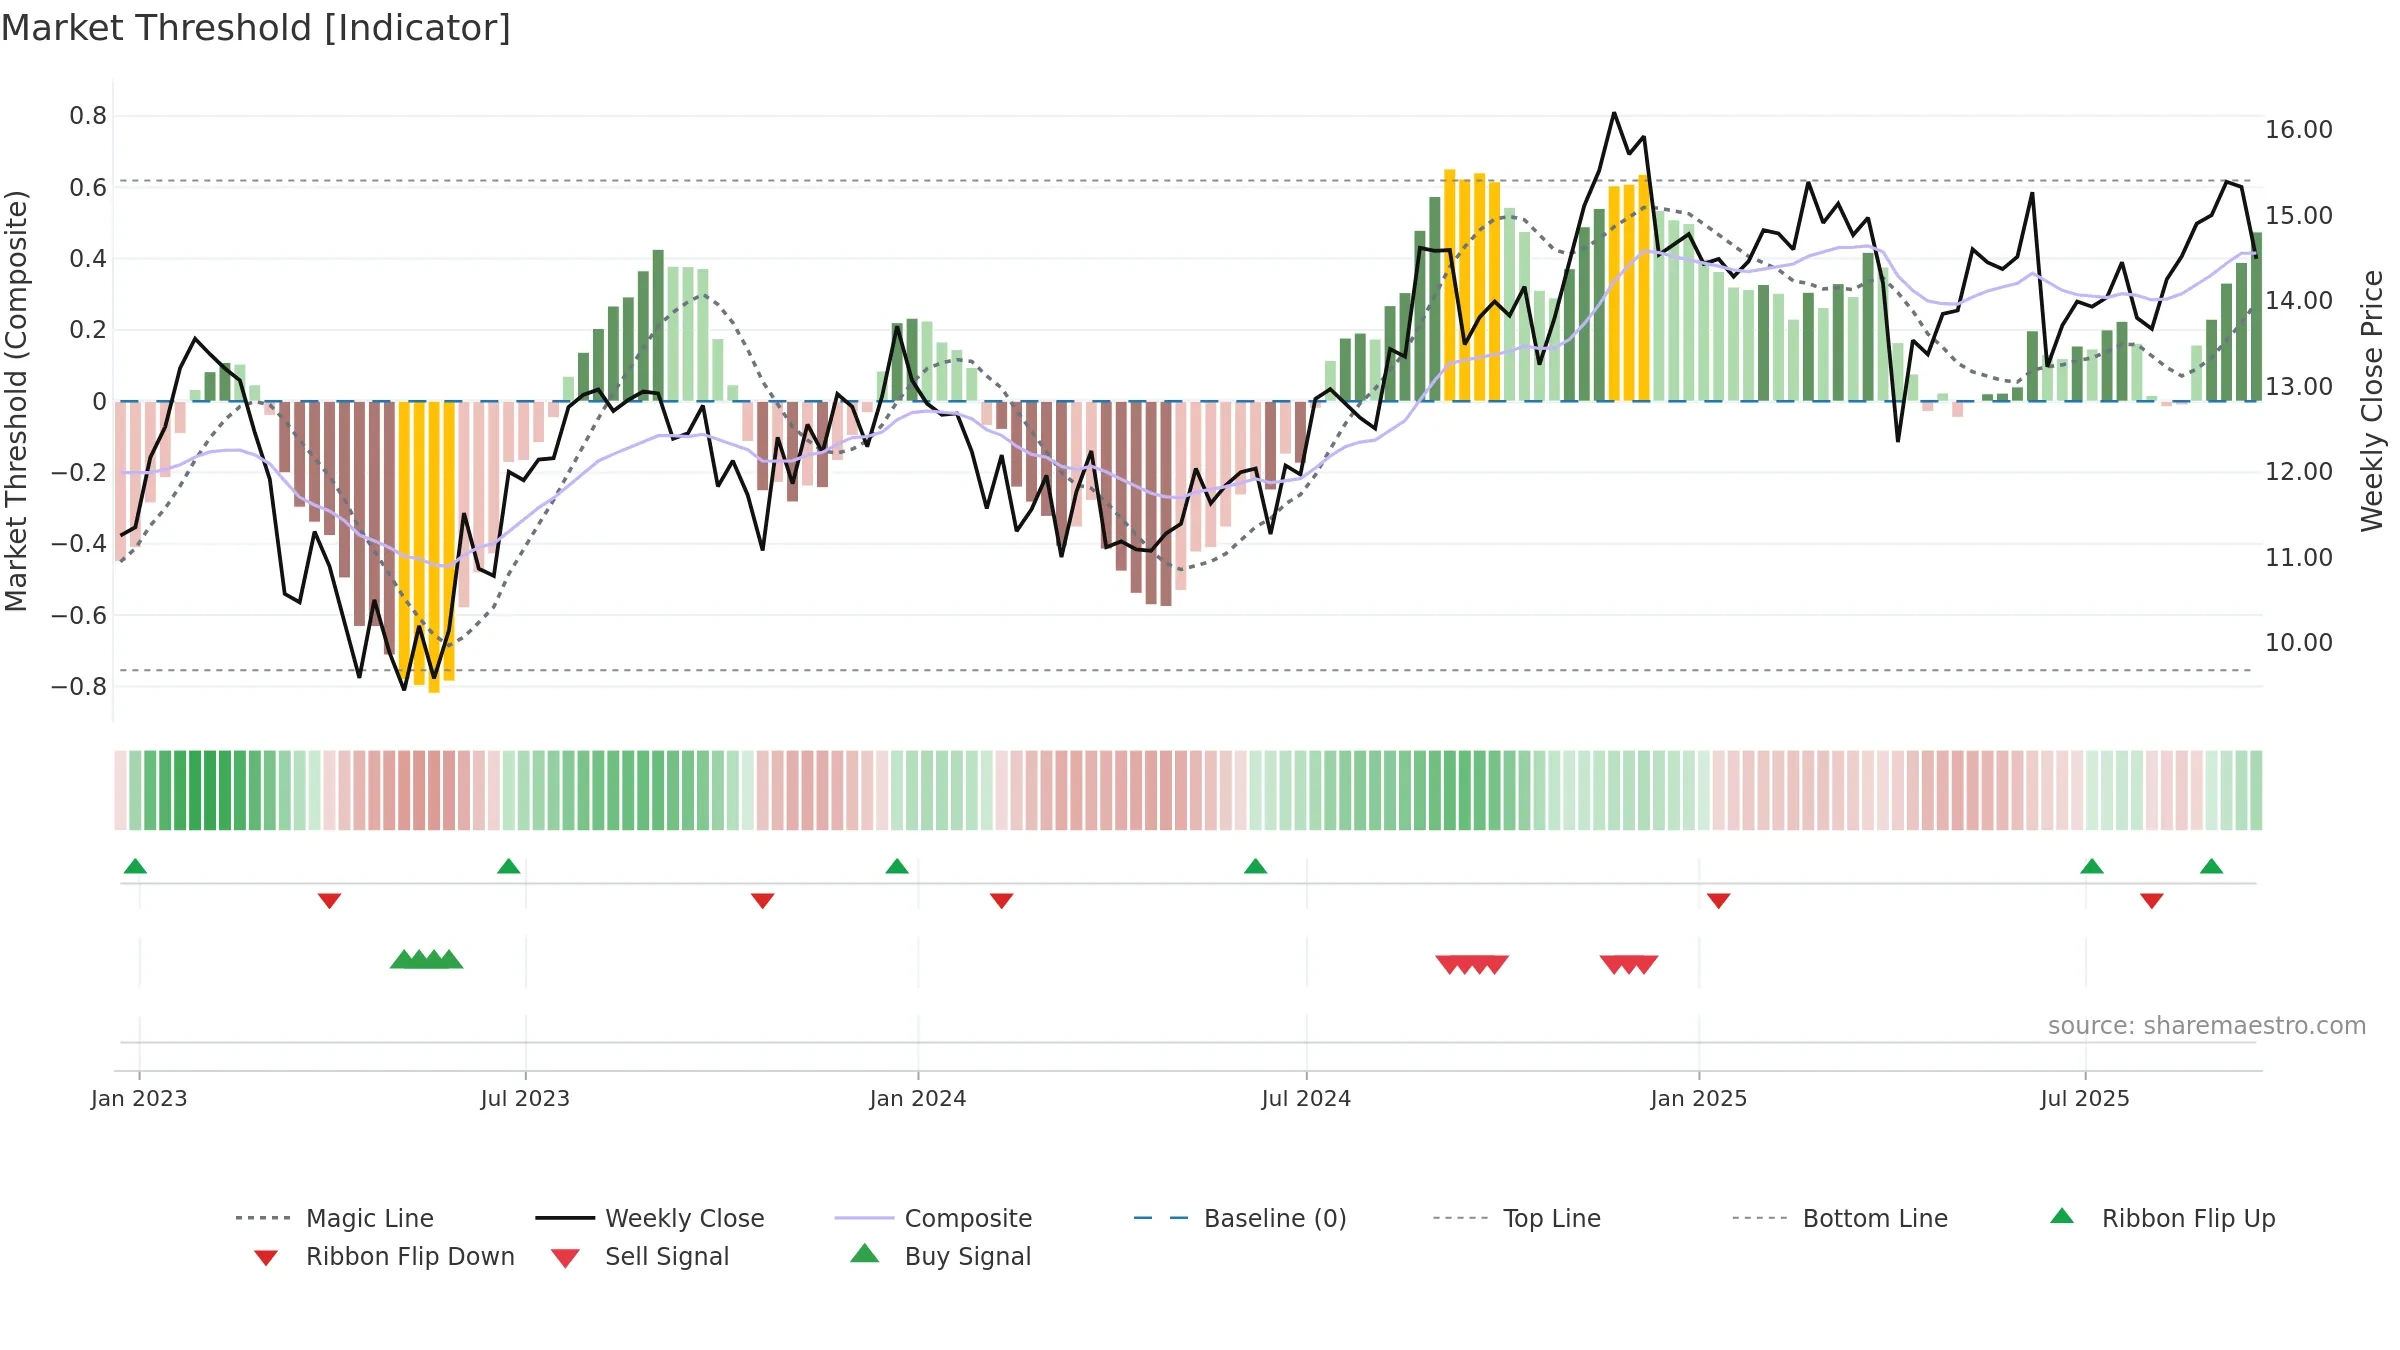
Positive setup. ★★★★☆ confidence. Trend: Strong Uptrend · 6.00% over window · vol 0.97% · liquidity convergence · posture mixed
- High gauge with rising momentum (strong uptrend)
- Momentum is bullish and rising
- Constructive moving-average stack
- Liquidity confirms the price trend
- Price is not above key averages
Why: Price window 6.00% over w. Close is -5.85% below the prior-window high. Return volatility 0.97%. Volume trend rising. Liquidity convergence with price. Trend state strong uptrend. MA stack constructive. Momentum bullish and rising.
Tip: Most metrics include a hover tooltip where they appear in the report.