AMD Industries Limited
AMDIND NSE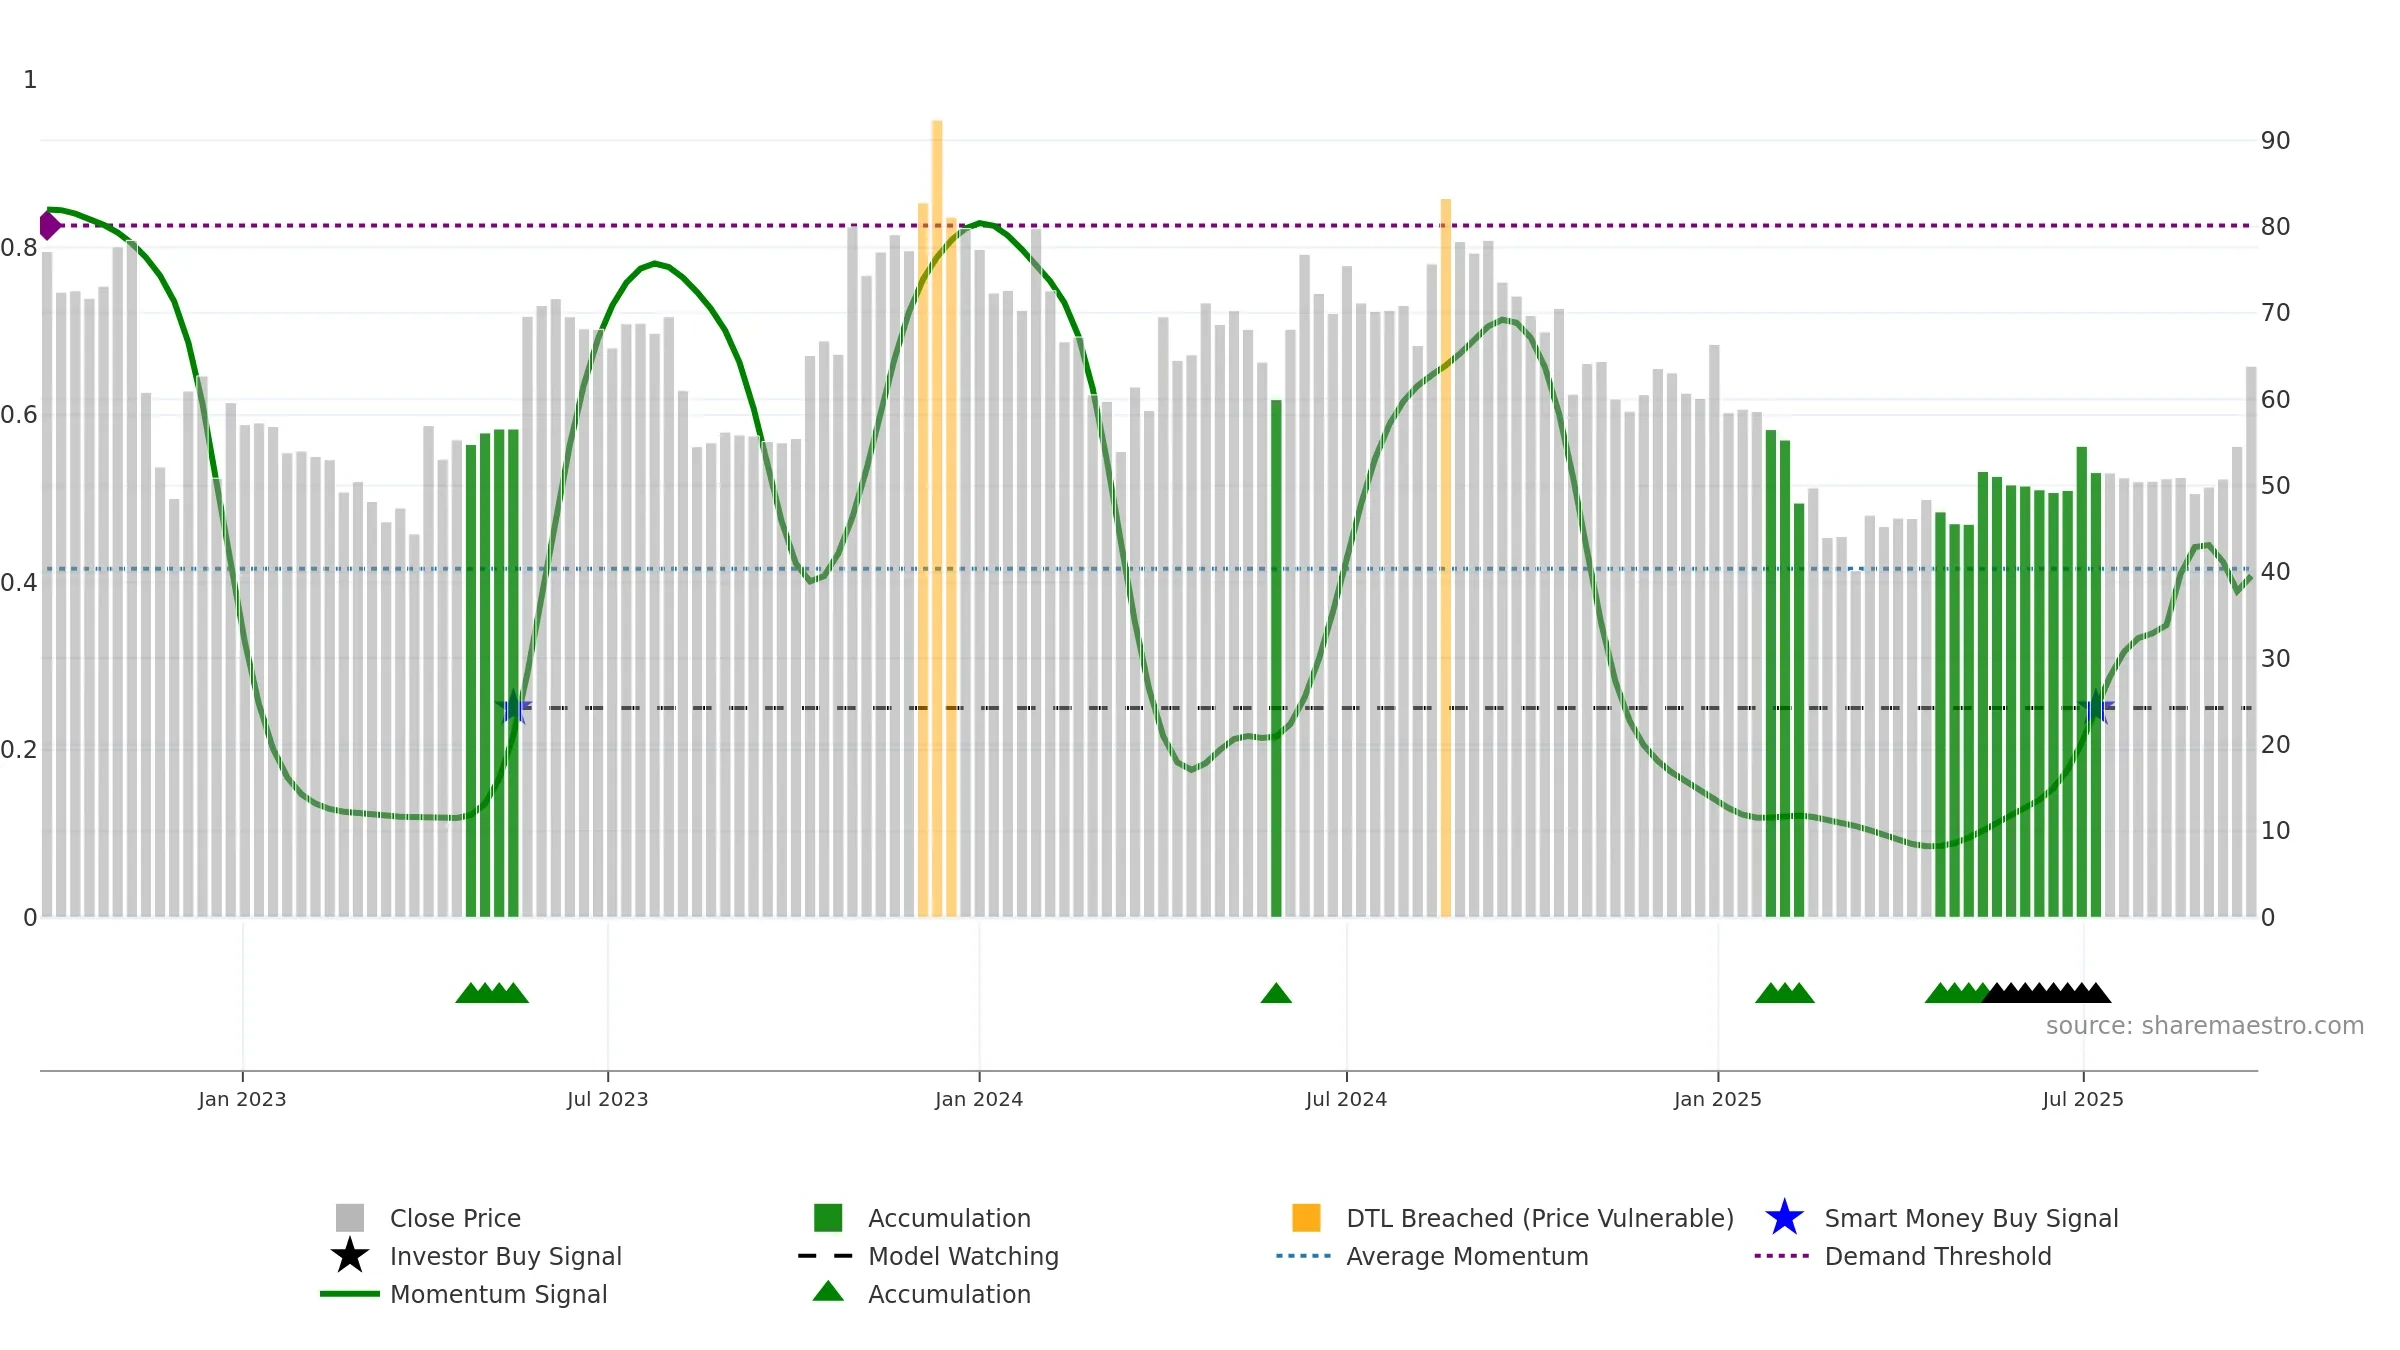
Weekly Summary
AMD Industries Limited closed at 63.8300 (10.82% WoW) . Data window ends Mon, 22 Sep 2025.
How to read this — Price slope is upward, indicating persistent buying over the window. Elevated weekly volatility increases whipsaw risk. Volume and price are moving in the same direction — a constructive confirmation. Returns are positively correlated with volume — strength tends to arrive on higher activity. Price is stretched above its baseline; consolidation risk rises if activity fades. Distance to baseline is narrowing — reverting closer to its fair-value track. Constructive MA stack supports the up-drift; pullbacks may find support at the 8–13 week region. Price holds above key averages, indicating constructive participation.
Up-slope supports buying interest; pullbacks may be contained if activity stays firm.
Gauge maps the trend signal to a 0–100 scale.
How to read this — Range-bound conditions; conviction is limited until a break or acceleration emerges. Sub-0.40 print confirms downside control.
Wait for a directional break or improving acceleration.

Relative strength is Positive
(> 0%, outperforming).
Latest MRS: 2.56% (week ending Fri, 19 Sep 2025).
Slope: Rising over 8w.
Notes:
- Holding above the zero line indicates relative bid.
- MRS slope rising over ~8 weeks.
Conclusion
Positive setup. ★★★★☆ confidence. Price window: 26. Trend: Range / Neutral; gauge 40. In combination, liquidity confirms the move.
- Price holds above 8w & 26w averages
- Constructive moving-average stack
- Liquidity confirms the price trend
- Solid multi-week performance
- High return volatility raises whipsaw risk
- Sub-0.40 print confirms bear control
Why: Price window 26.40% over 8w. Close is 17.03% above the prior-window high. Return volatility 5.40%. Volume trend rising. Liquidity convergence with price. Trend state range / neutral. MA stack constructive. Momentum neutral and rising.
Tip: Most metrics include a hover tooltip where they appear in the report.