Cheer Time Enterprise Co., Ltd
3229 TPE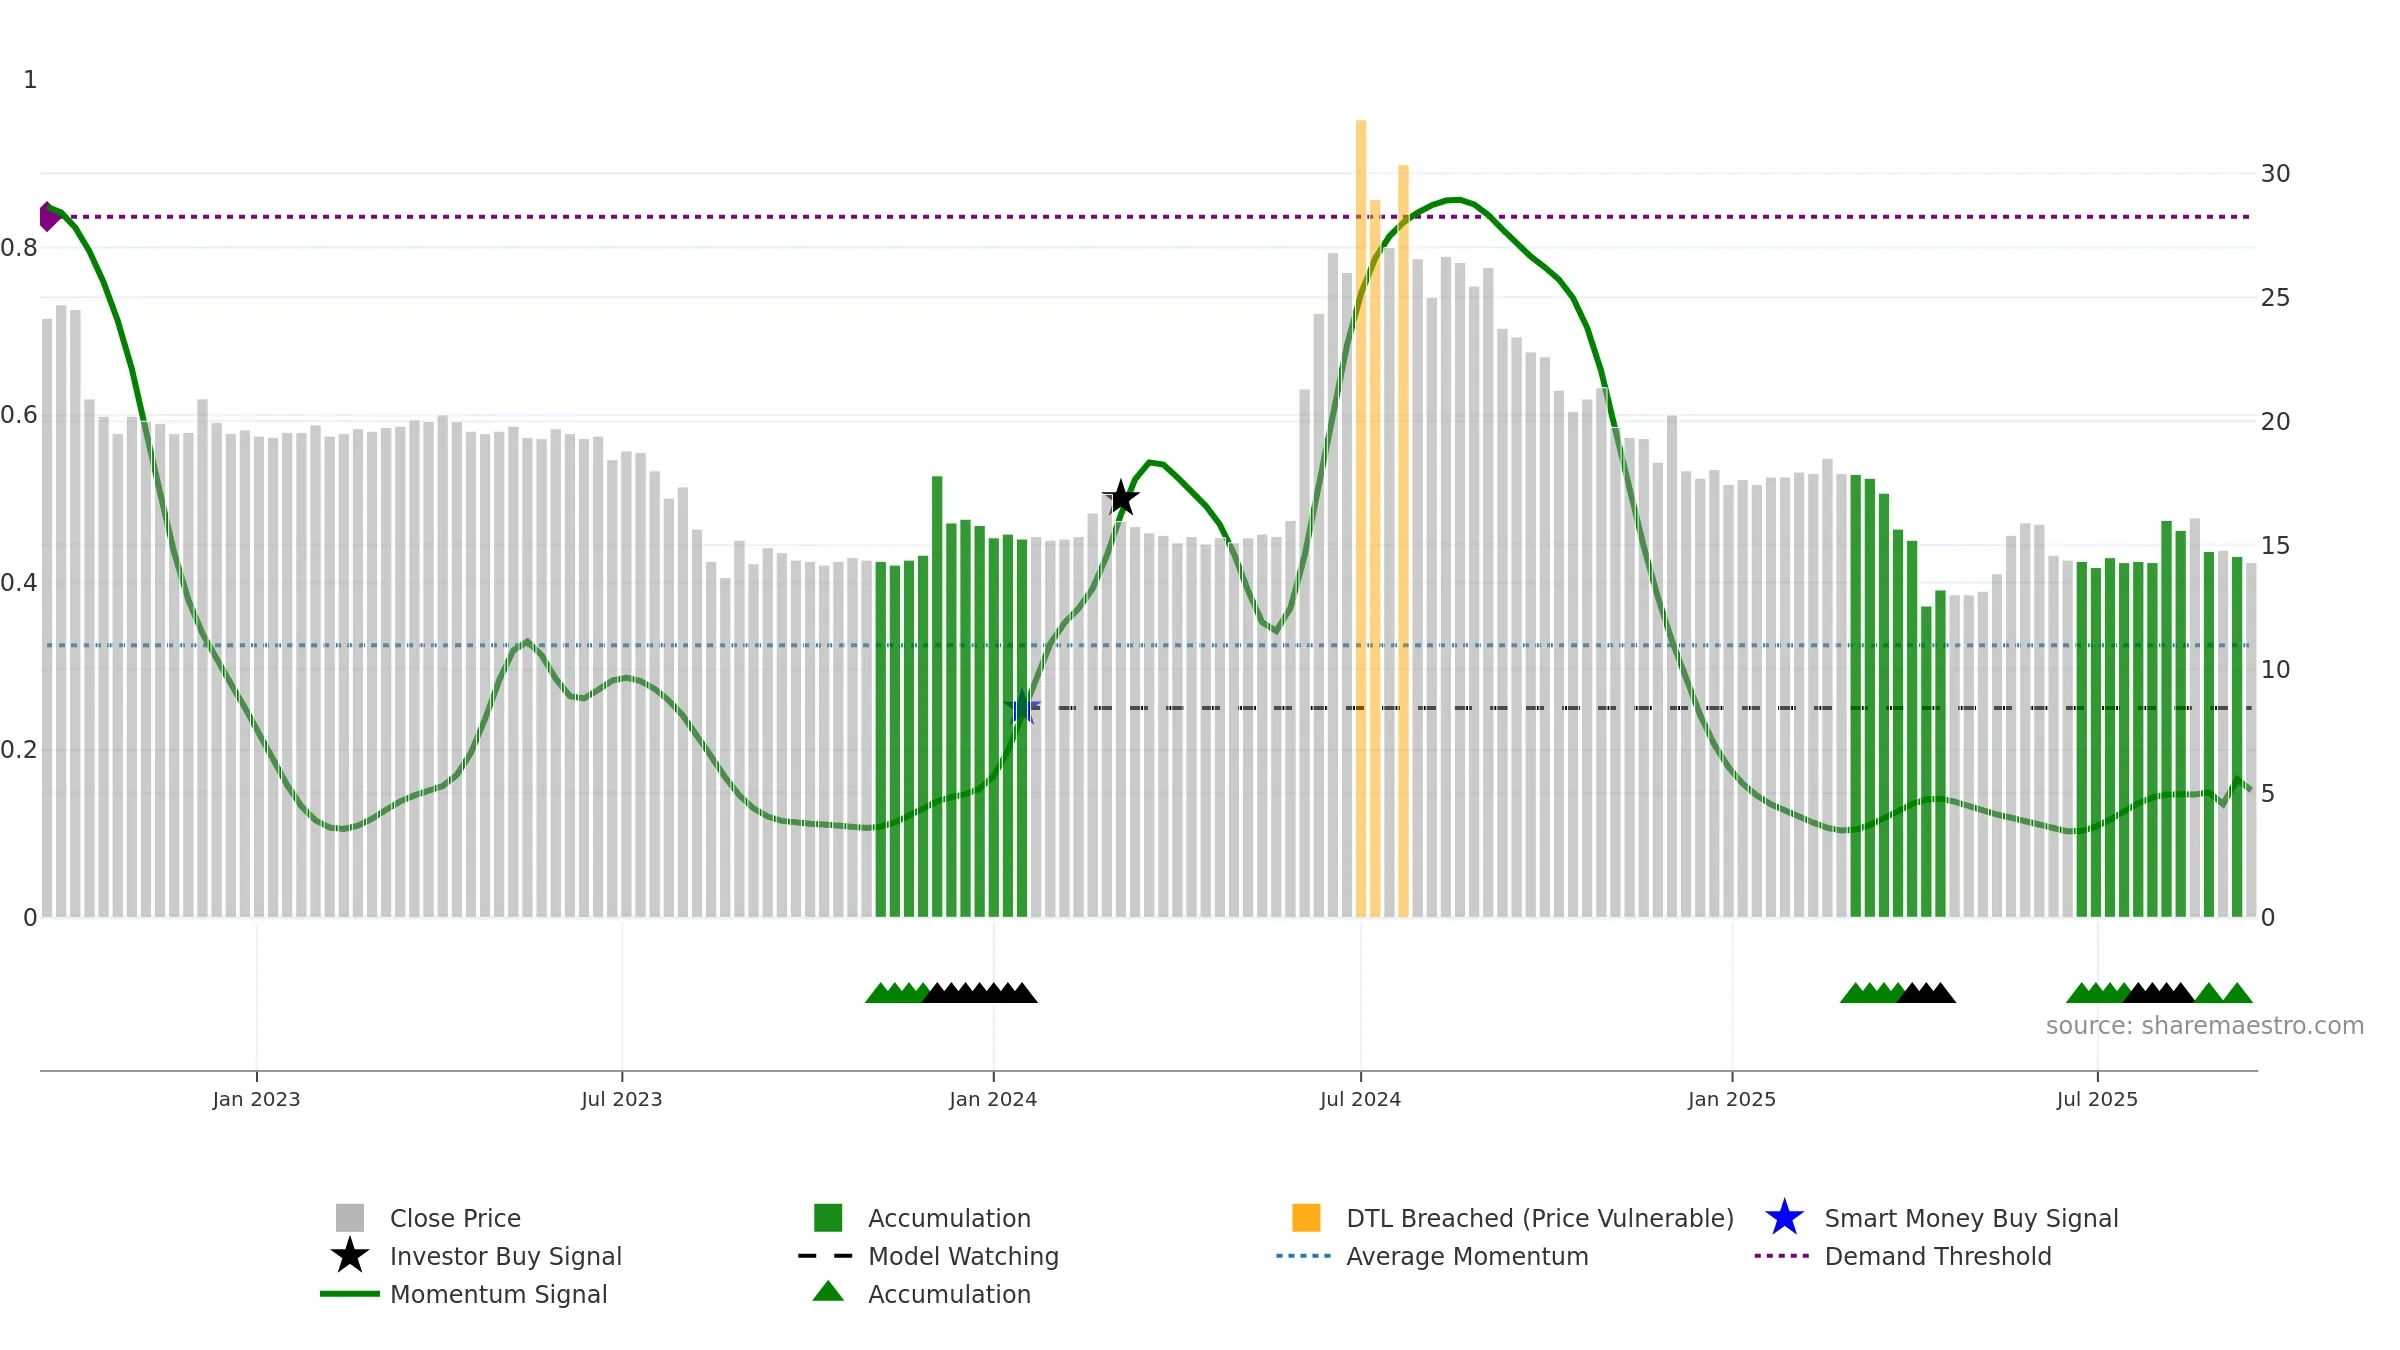
Weekly Report
Cheer Time Enterprise Co., Ltd closed at 14.3000 (0.35% WoW) . Data window ends Mon, 15 Sep 2025.
How to read this — Price slope is downward, indicating persistent supply pressure. Low weekly volatility favours steadier follow-through. Volume and price are moving in the same direction — a constructive confirmation. Distance to baseline is narrowing — reverting closer to its fair-value track. Price sits below key averages, keeping pressure on the tape.
Down-slope argues for patience; rallies can fade sooner unless participation improves.
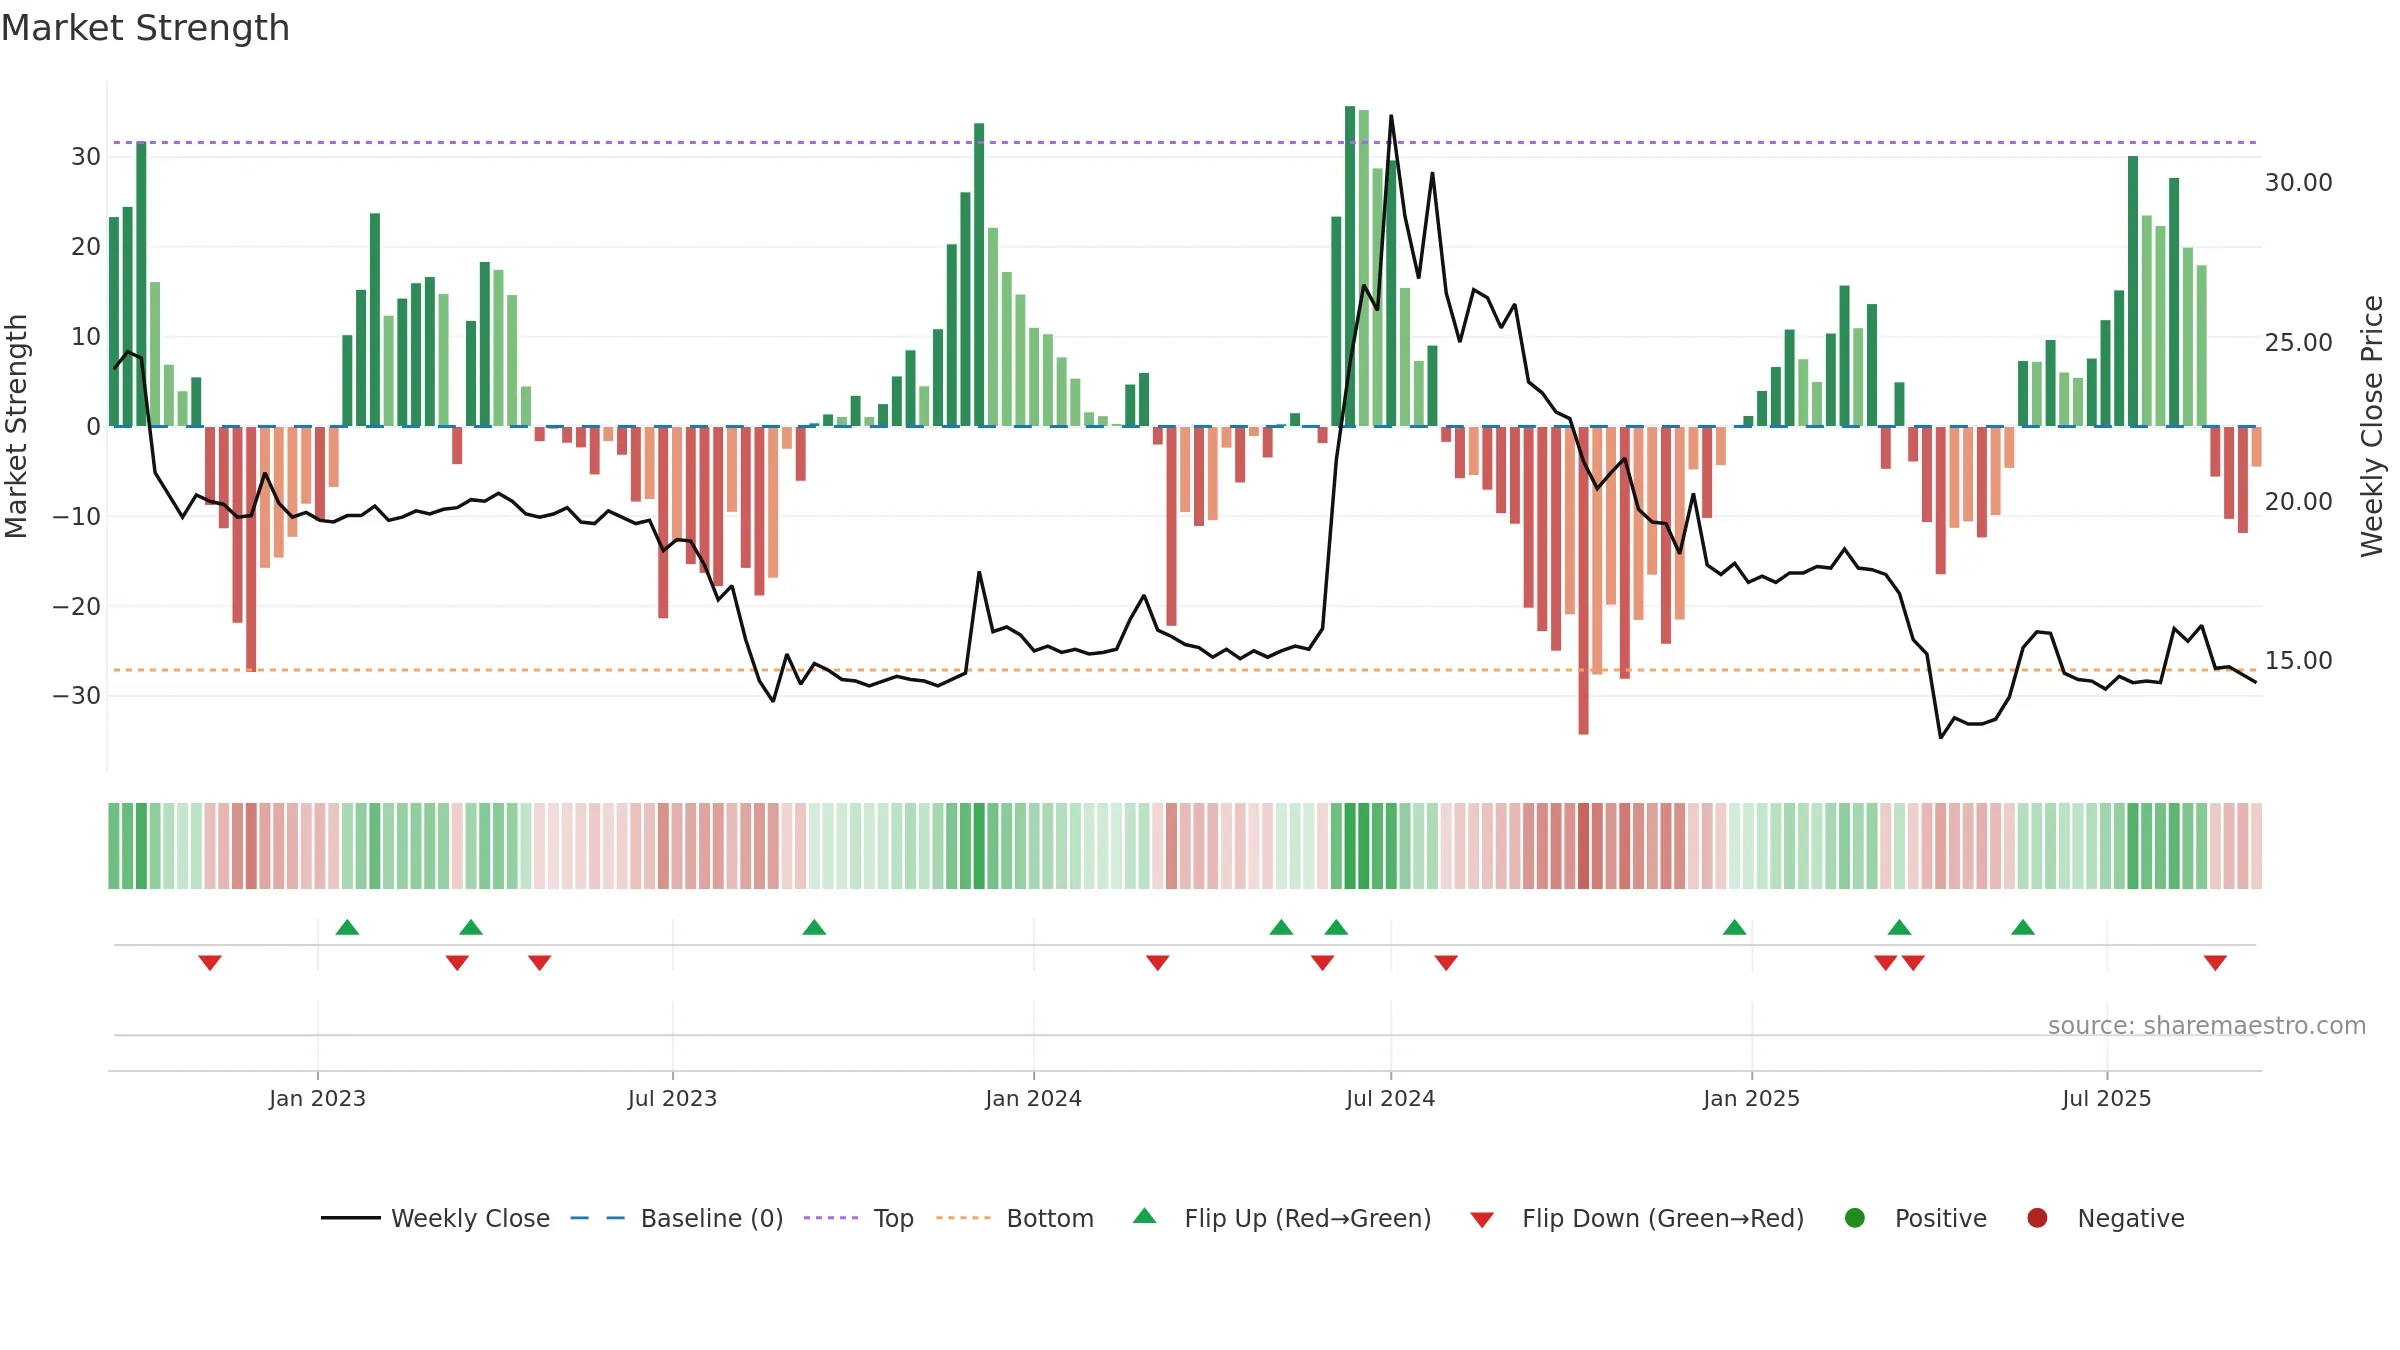
Gauge maps the trend signal to a 0–100 scale.
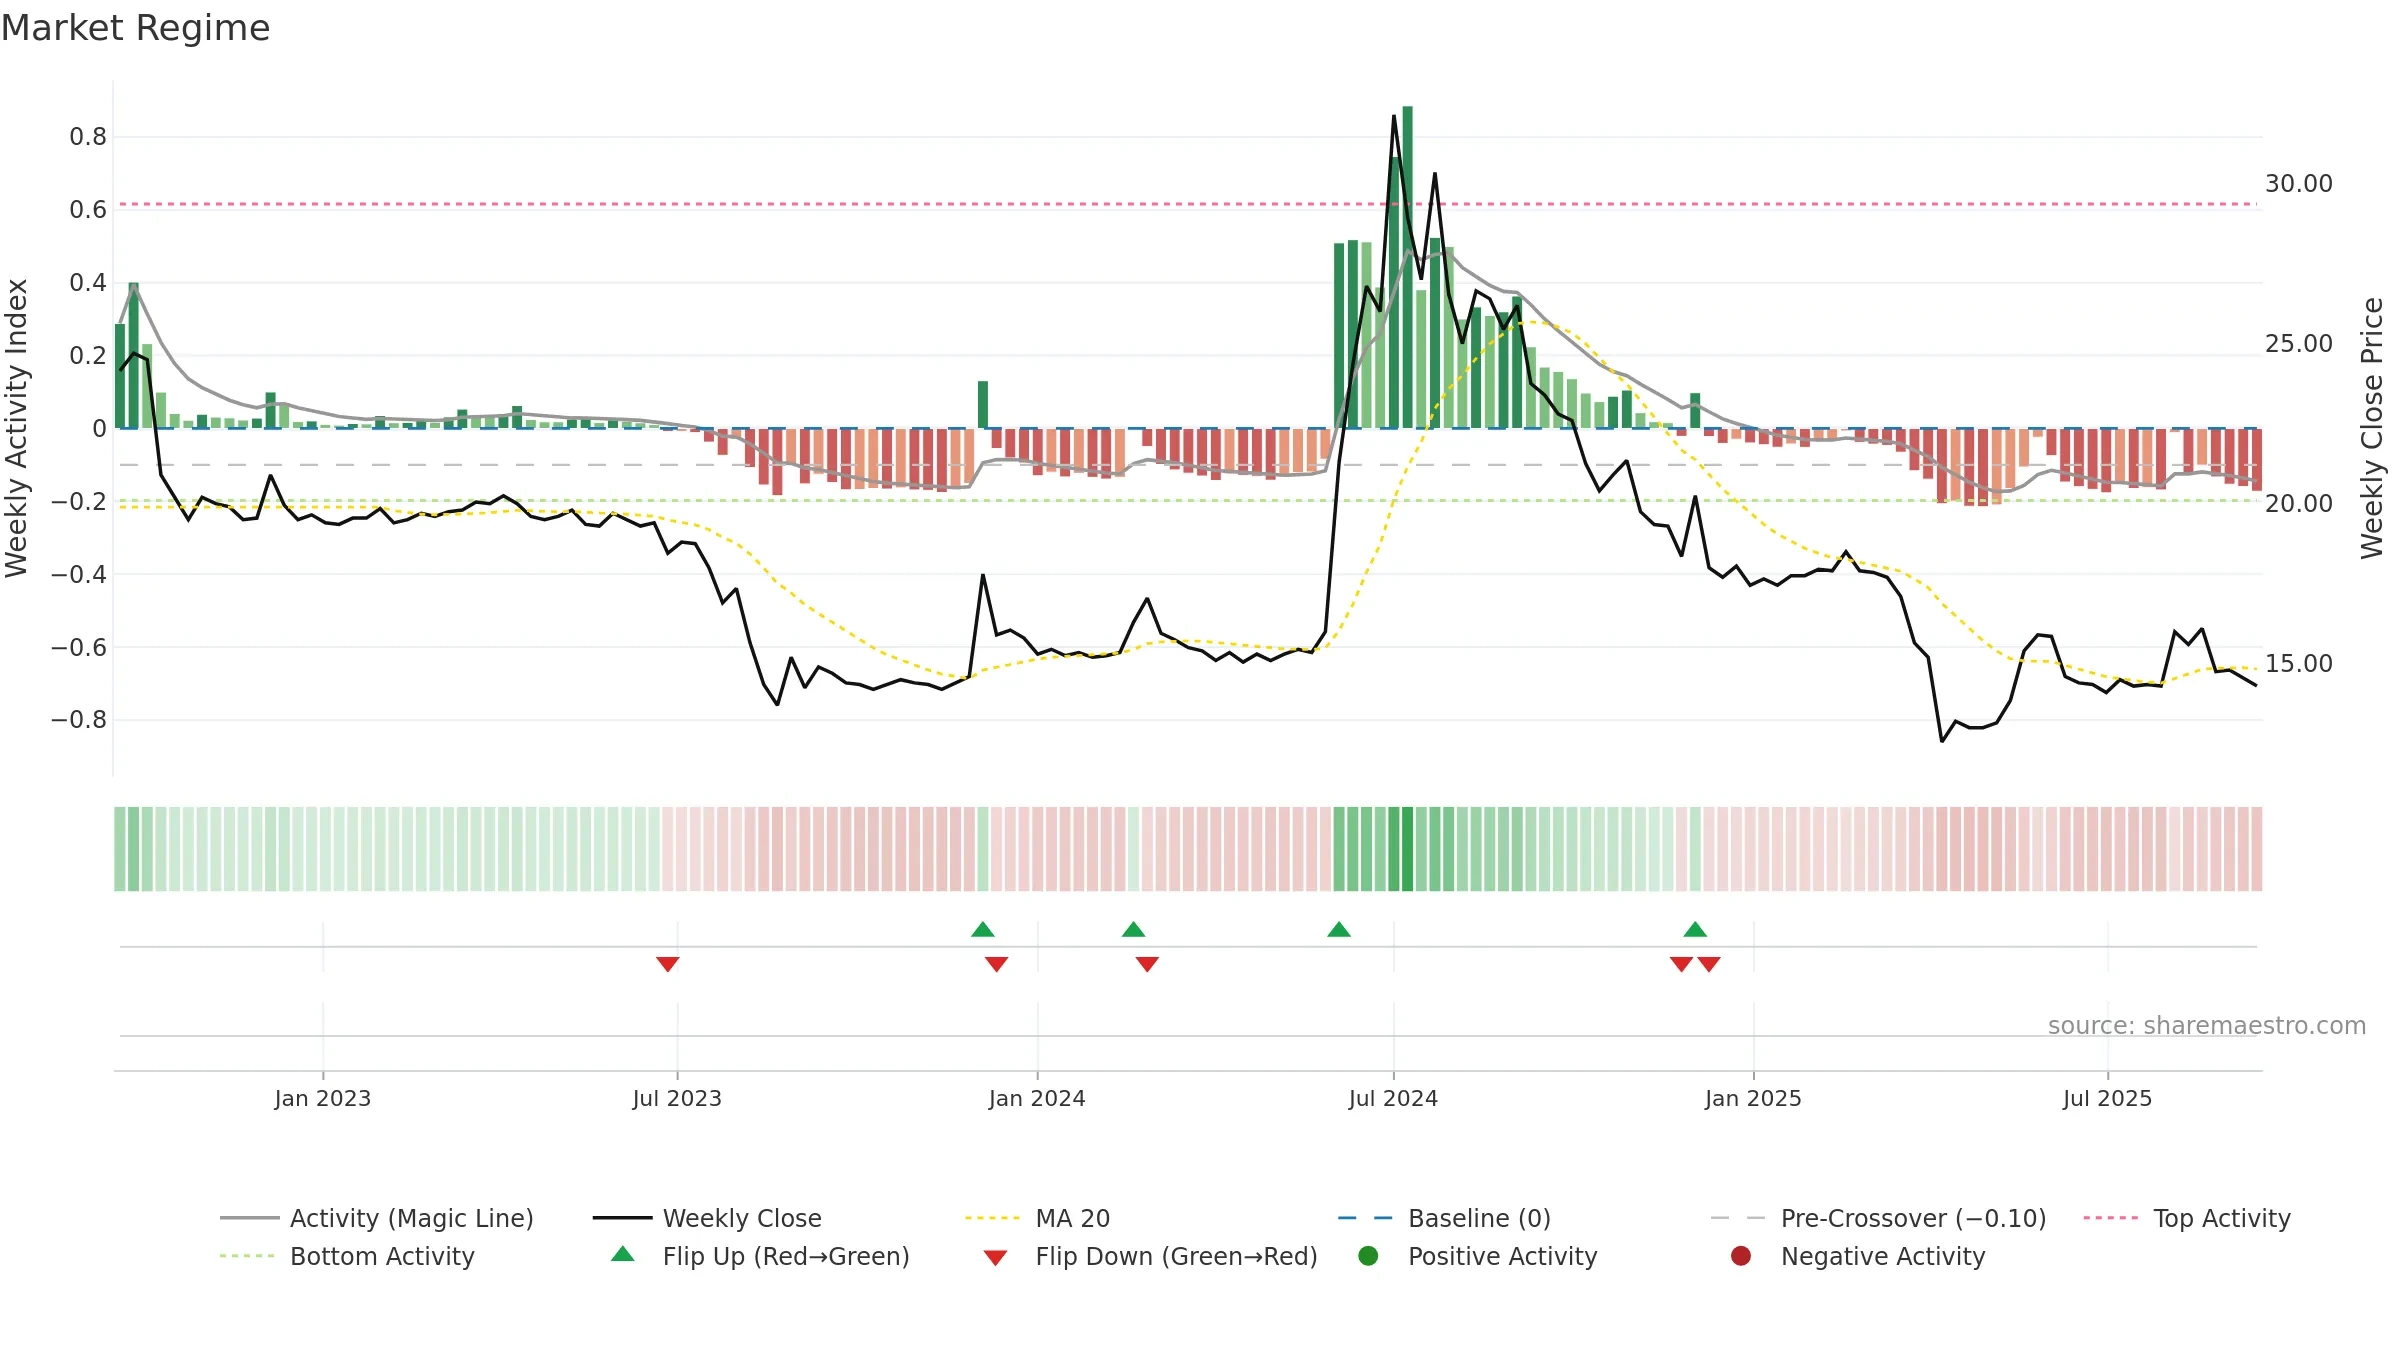
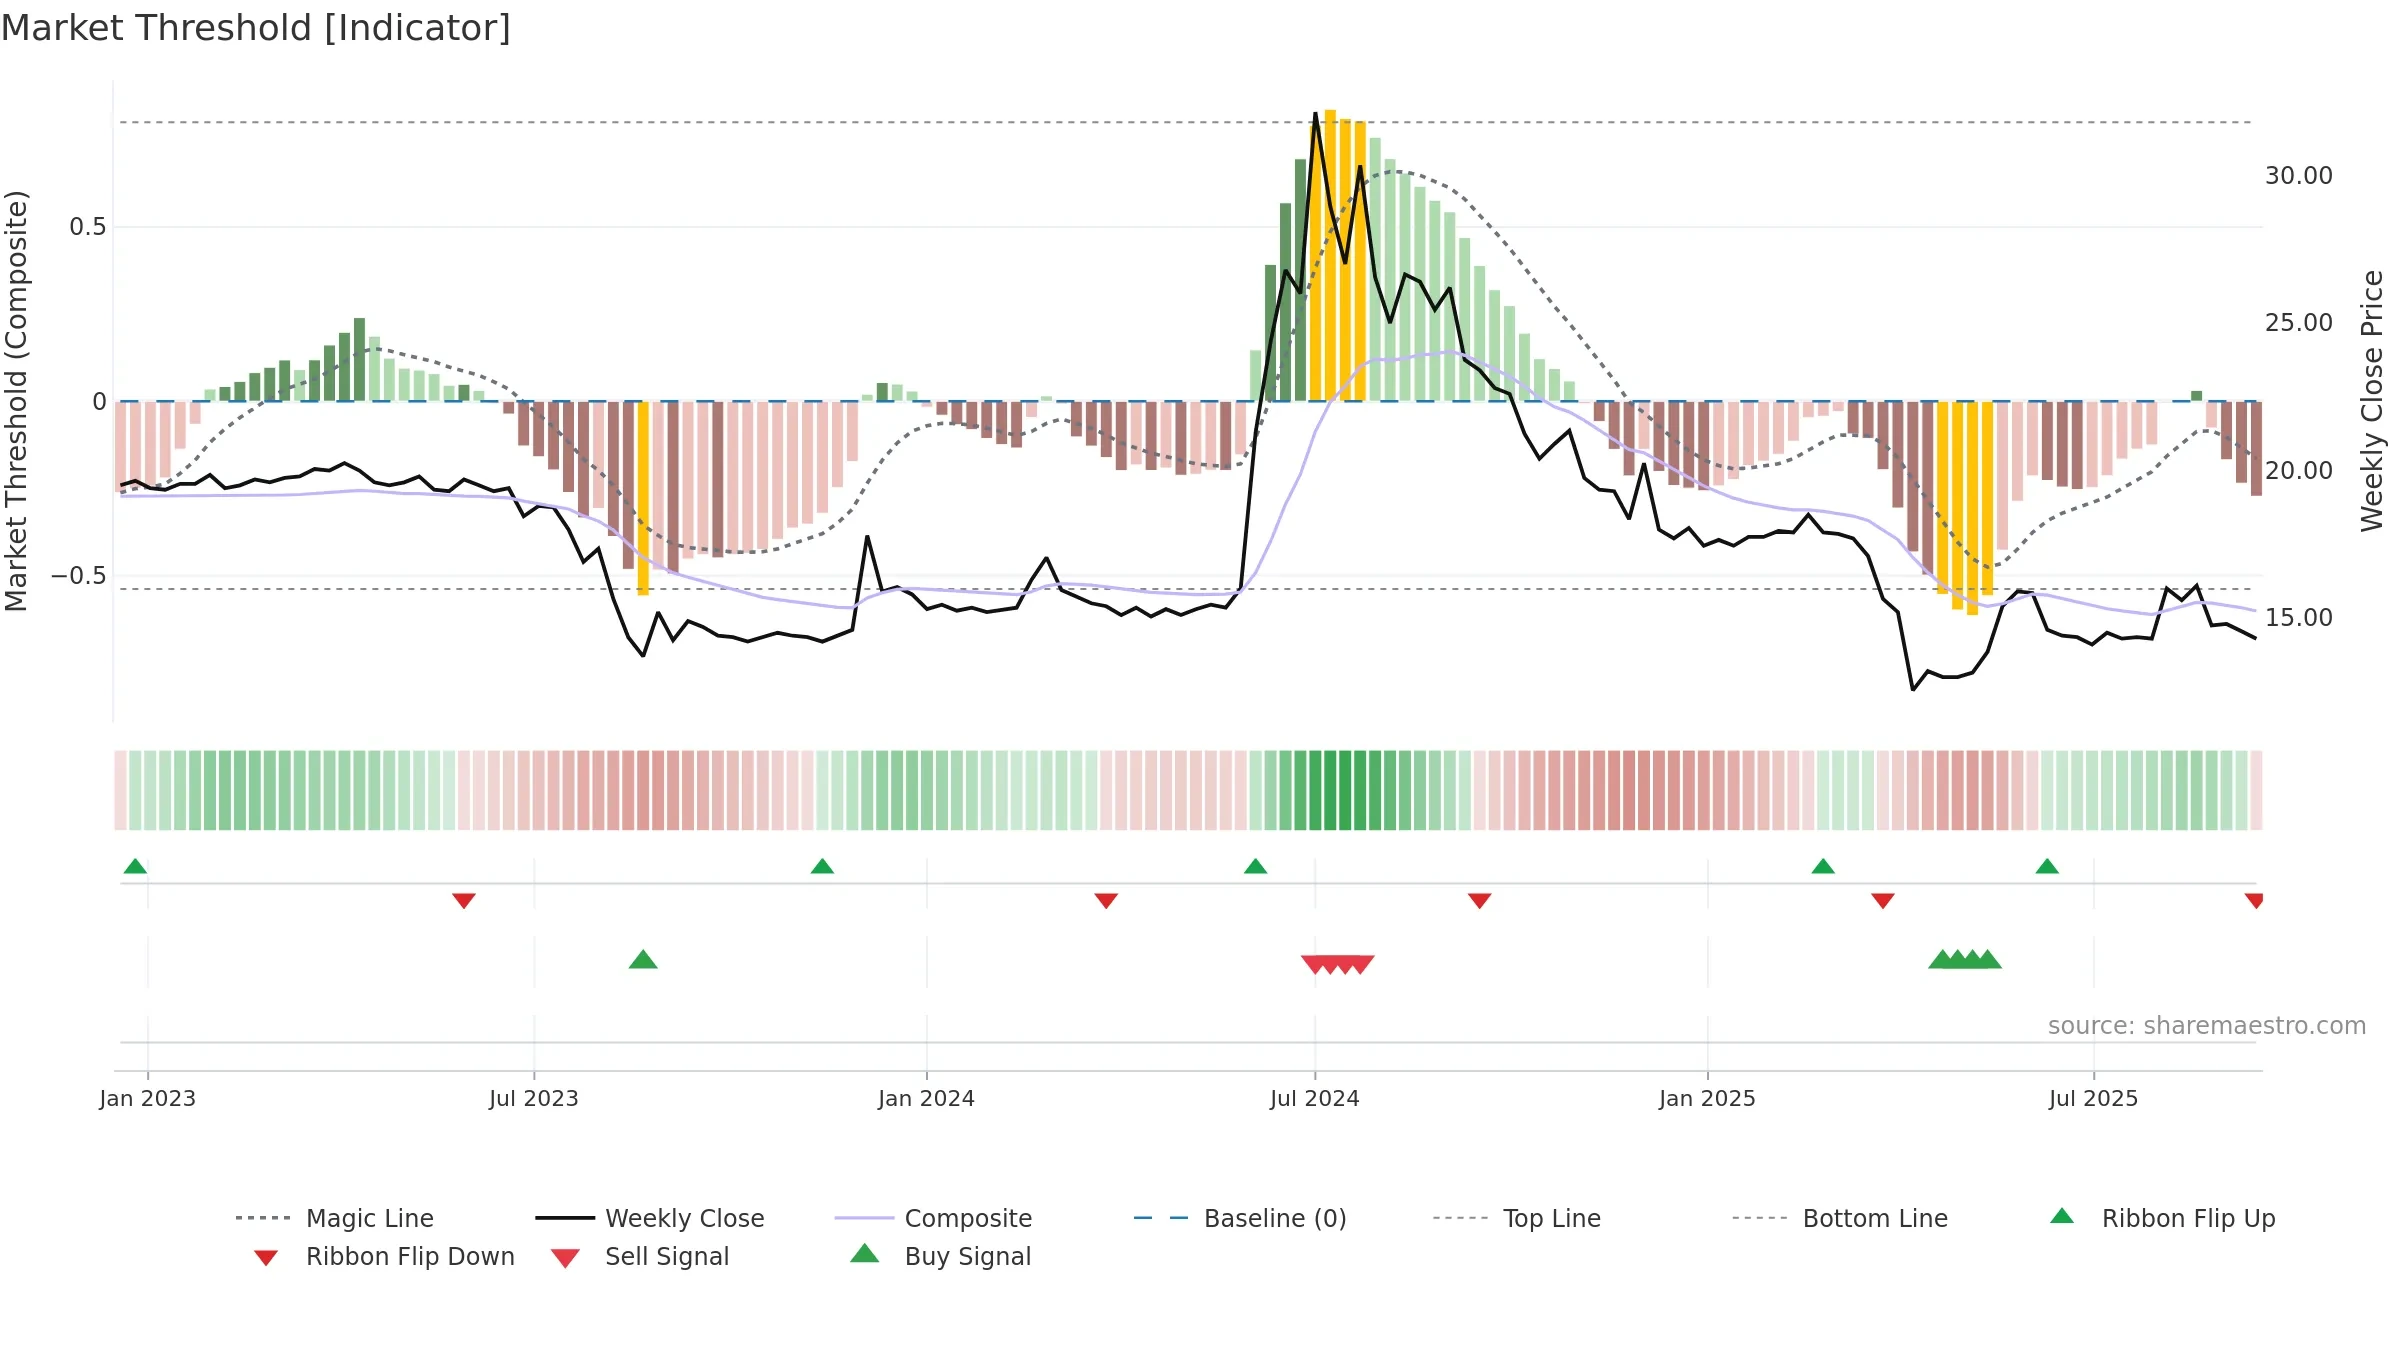
How to read this — Range-bound conditions; conviction is limited until a break or acceleration emerges.
Wait for a directional break or improving acceleration.
Conclusion
Neutral setup. ★★★☆☆ confidence. Price window: 0. Trend: Range / Neutral; gauge 15. In combination, liquidity confirms the move.
- Liquidity confirms the price trend
- Low return volatility supports durability
- Price is not above key averages
Why: Close is -11.18% below the prior-window high. Return volatility 1.91%. Volume trend falling. Liquidity convergence with price. Trend state range / neutral. Low-regime (≤0.25) upticks 4/7 (57.0%) • Accumulating. Momentum neutral and rising.
Tip: Most metrics include a hover tooltip where they appear in the report.