None
MEDIORG NSE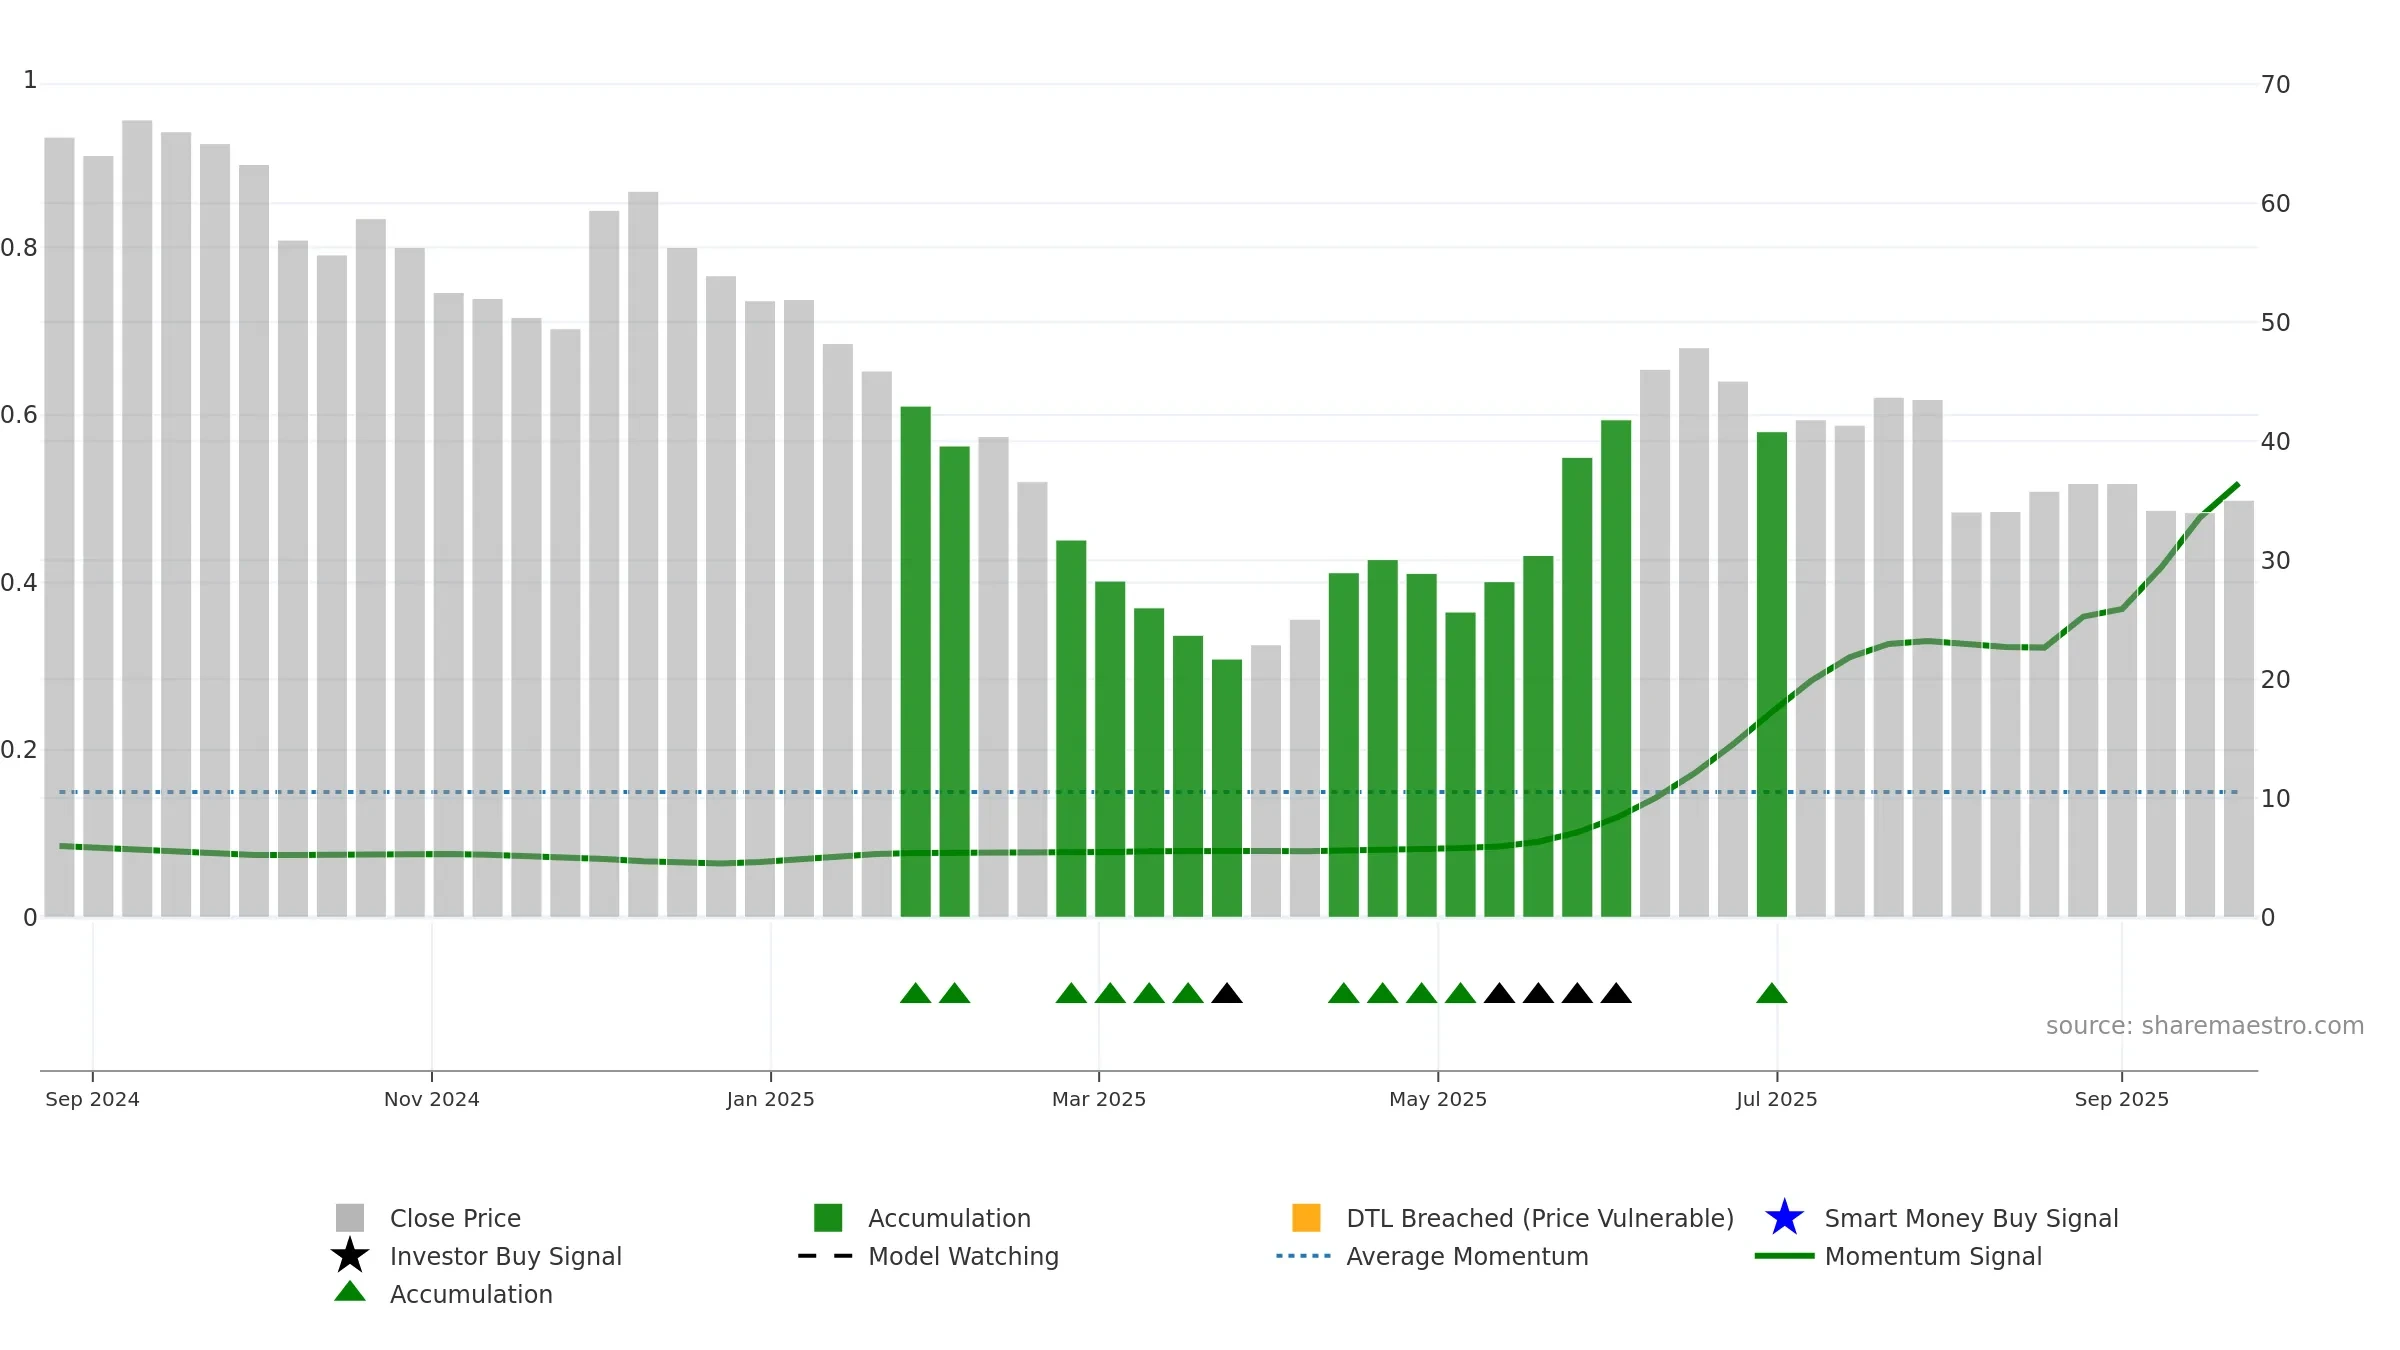

Weekly Summary
None closed at 35.0500 (0.00% WoW) . Data window ends Mon, 22 Sep 2025.
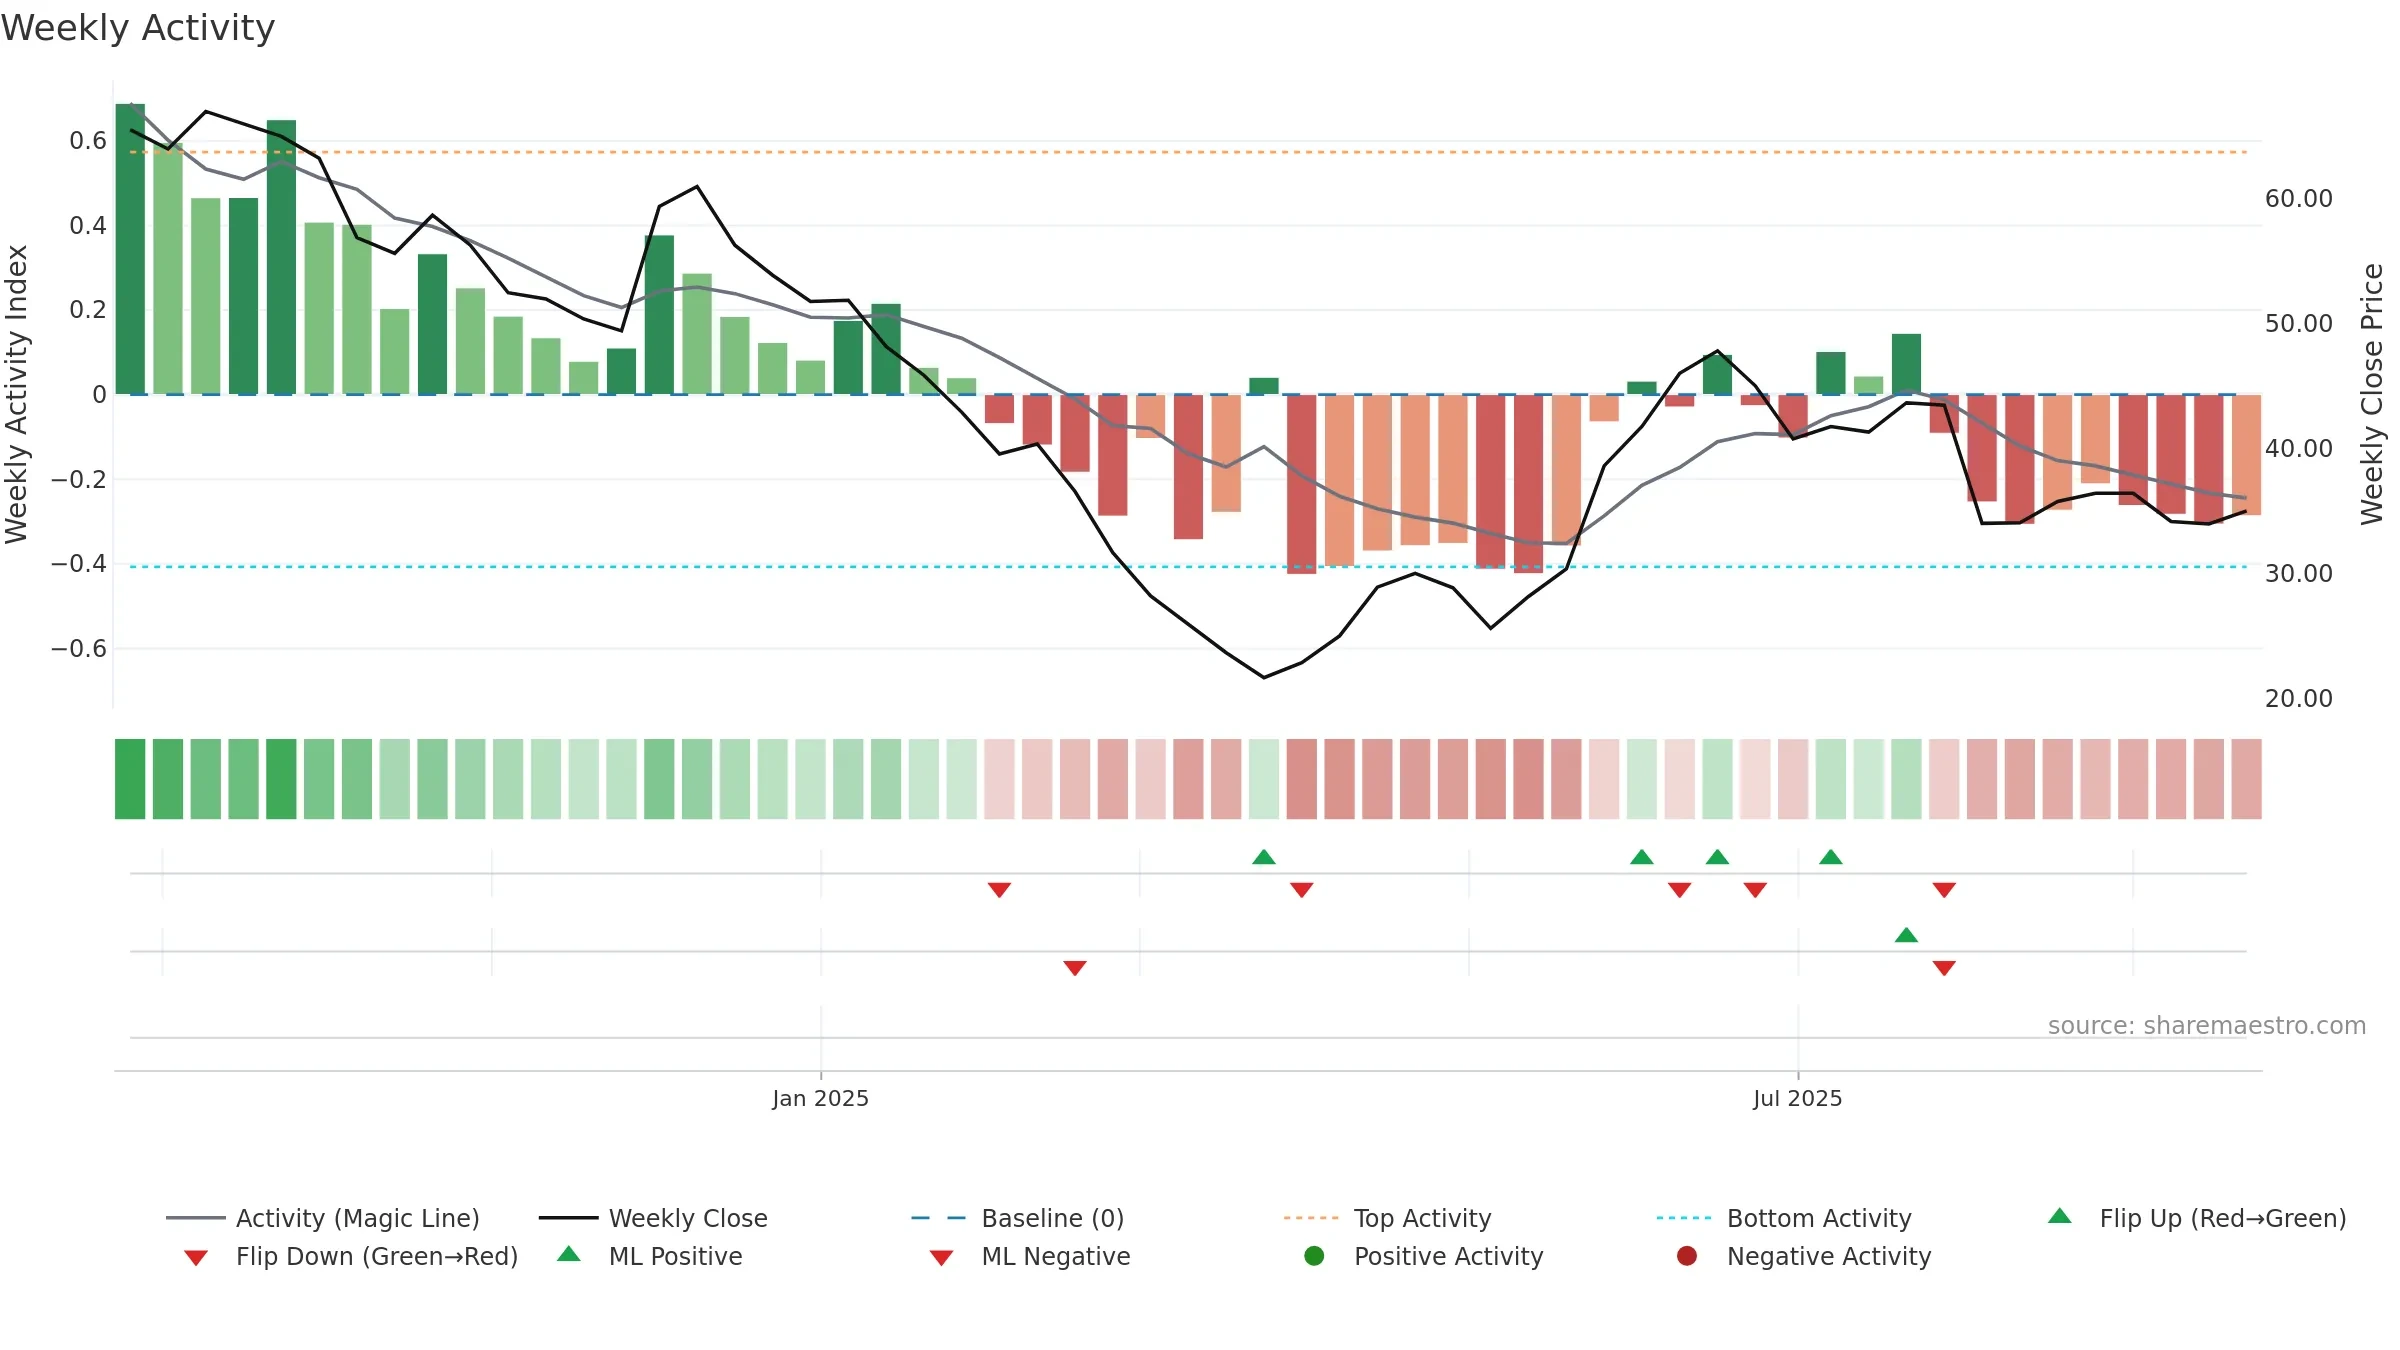
How to read this — Price slope is upward, indicating persistent buying over the window. Elevated weekly volatility increases whipsaw risk. Volume trend diverges from price — watch for fatigue or rotation. Returns are negatively correlated with volume — strength may come on lighter activity.
Up-slope supports buying interest; pullbacks may be contained if activity stays firm. Because liquidity isn’t confirming, prefer evidence of fresh demand before chasing moves.
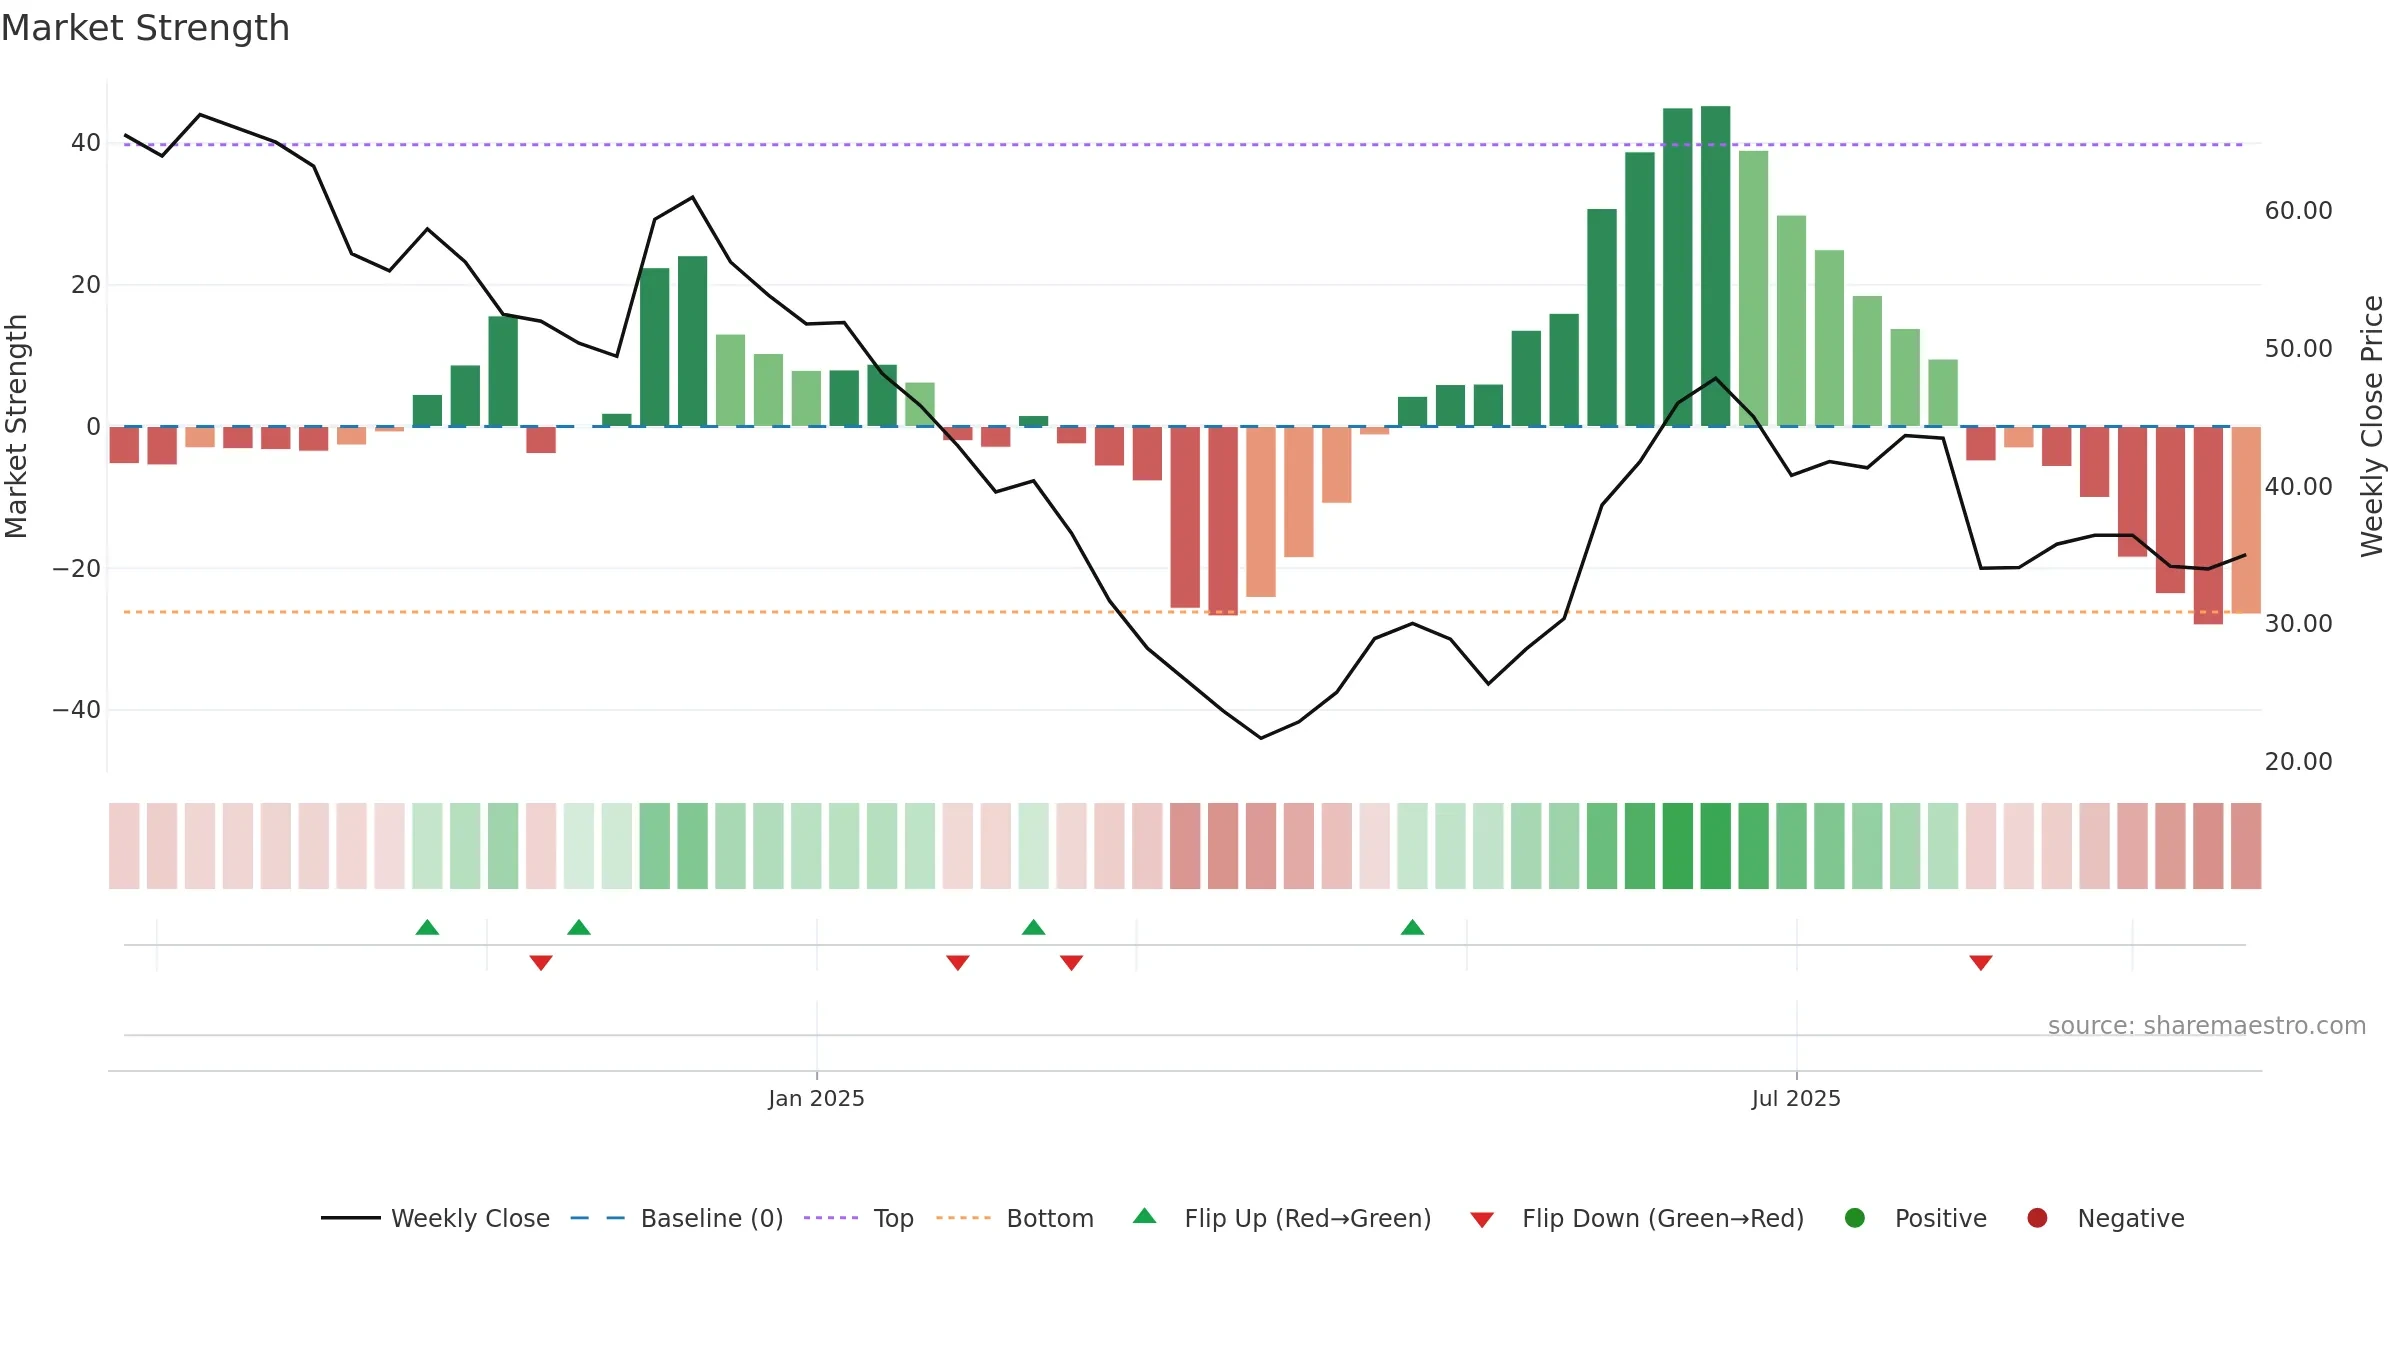
Gauge maps the trend signal to a 0–100 scale.
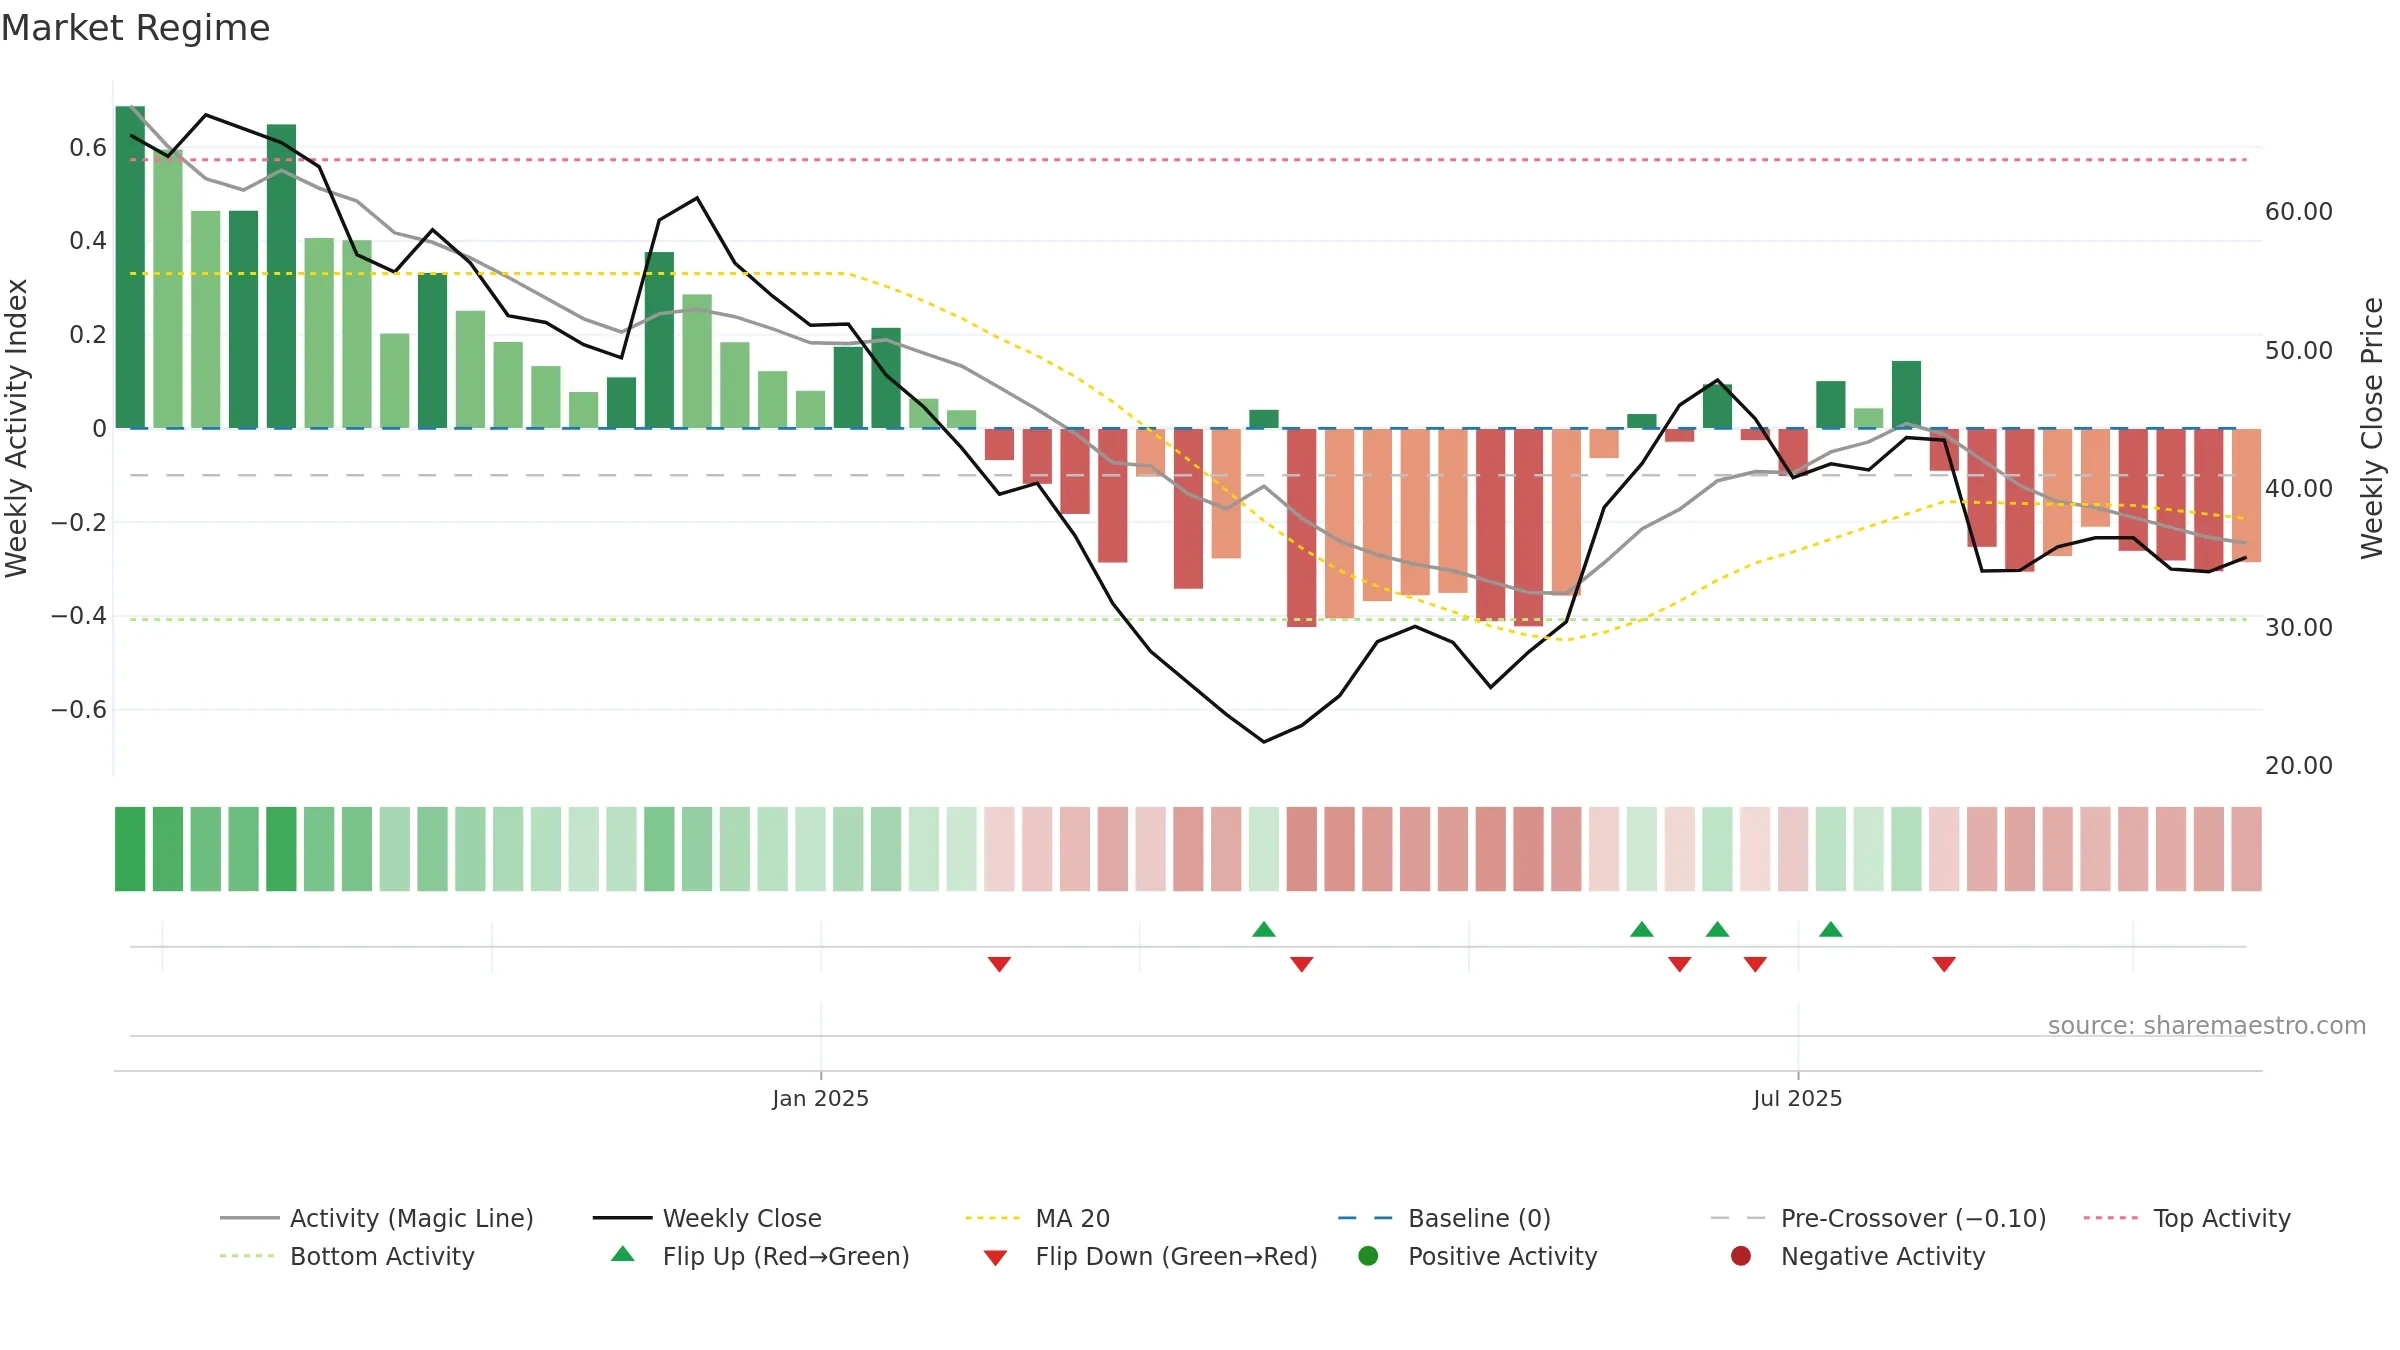
How to read this — Range-bound conditions; conviction is limited until a break or acceleration emerges.
Wait for a directional break or improving acceleration.

Analysis pending – not enough overlapping weekly data with the benchmark.
Conclusion
Negative setup. ★★☆☆☆ confidence. Trend: Range / Neutral · 2.94% over window · vol 6.32% · liquidity divergence · posture mixed
- Price is not above key averages
- Liquidity diverges from price
- High return volatility raises whipsaw risk
Why: Price window 2.94% over w. Close is -3.84% below the prior-window high. Return volatility 6.32%. Volume trend falling. Liquidity divergence with price. Trend state range / neutral. Momentum neutral and rising.
Tip: Most metrics include a hover tooltip where they appear in the report.