TSEC Corporation
6443 TPE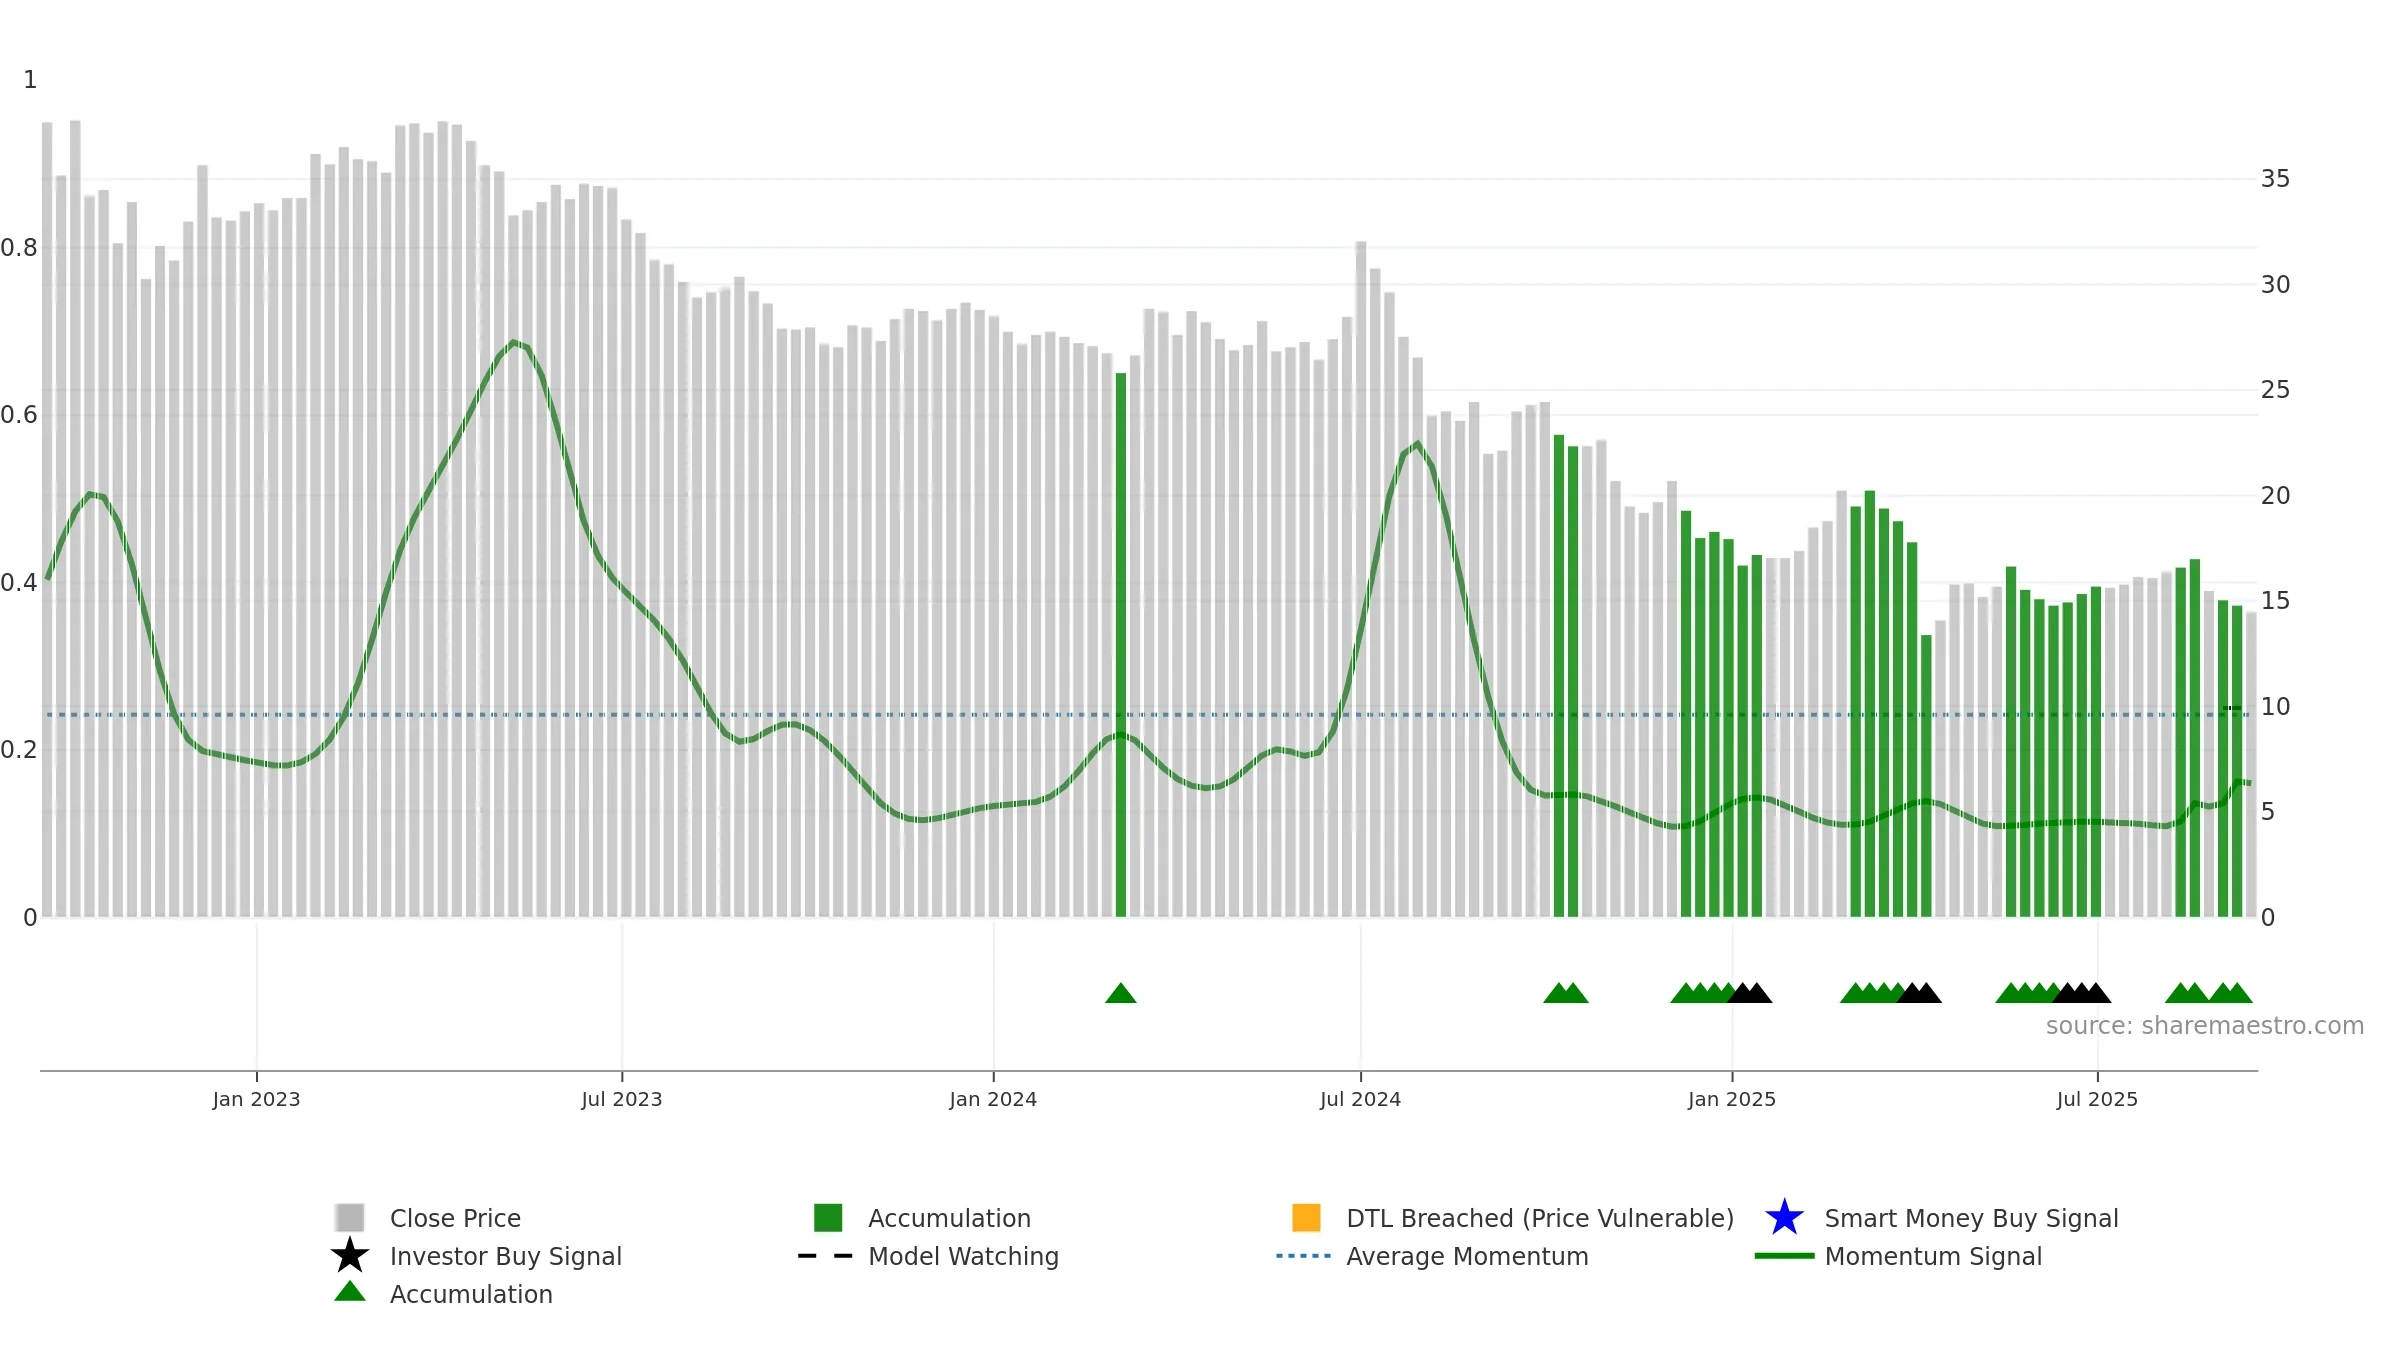
Weekly Report
TSEC Corporation closed at 14.5000 (0.00% WoW) . Data window ends Mon, 15 Sep 2025.
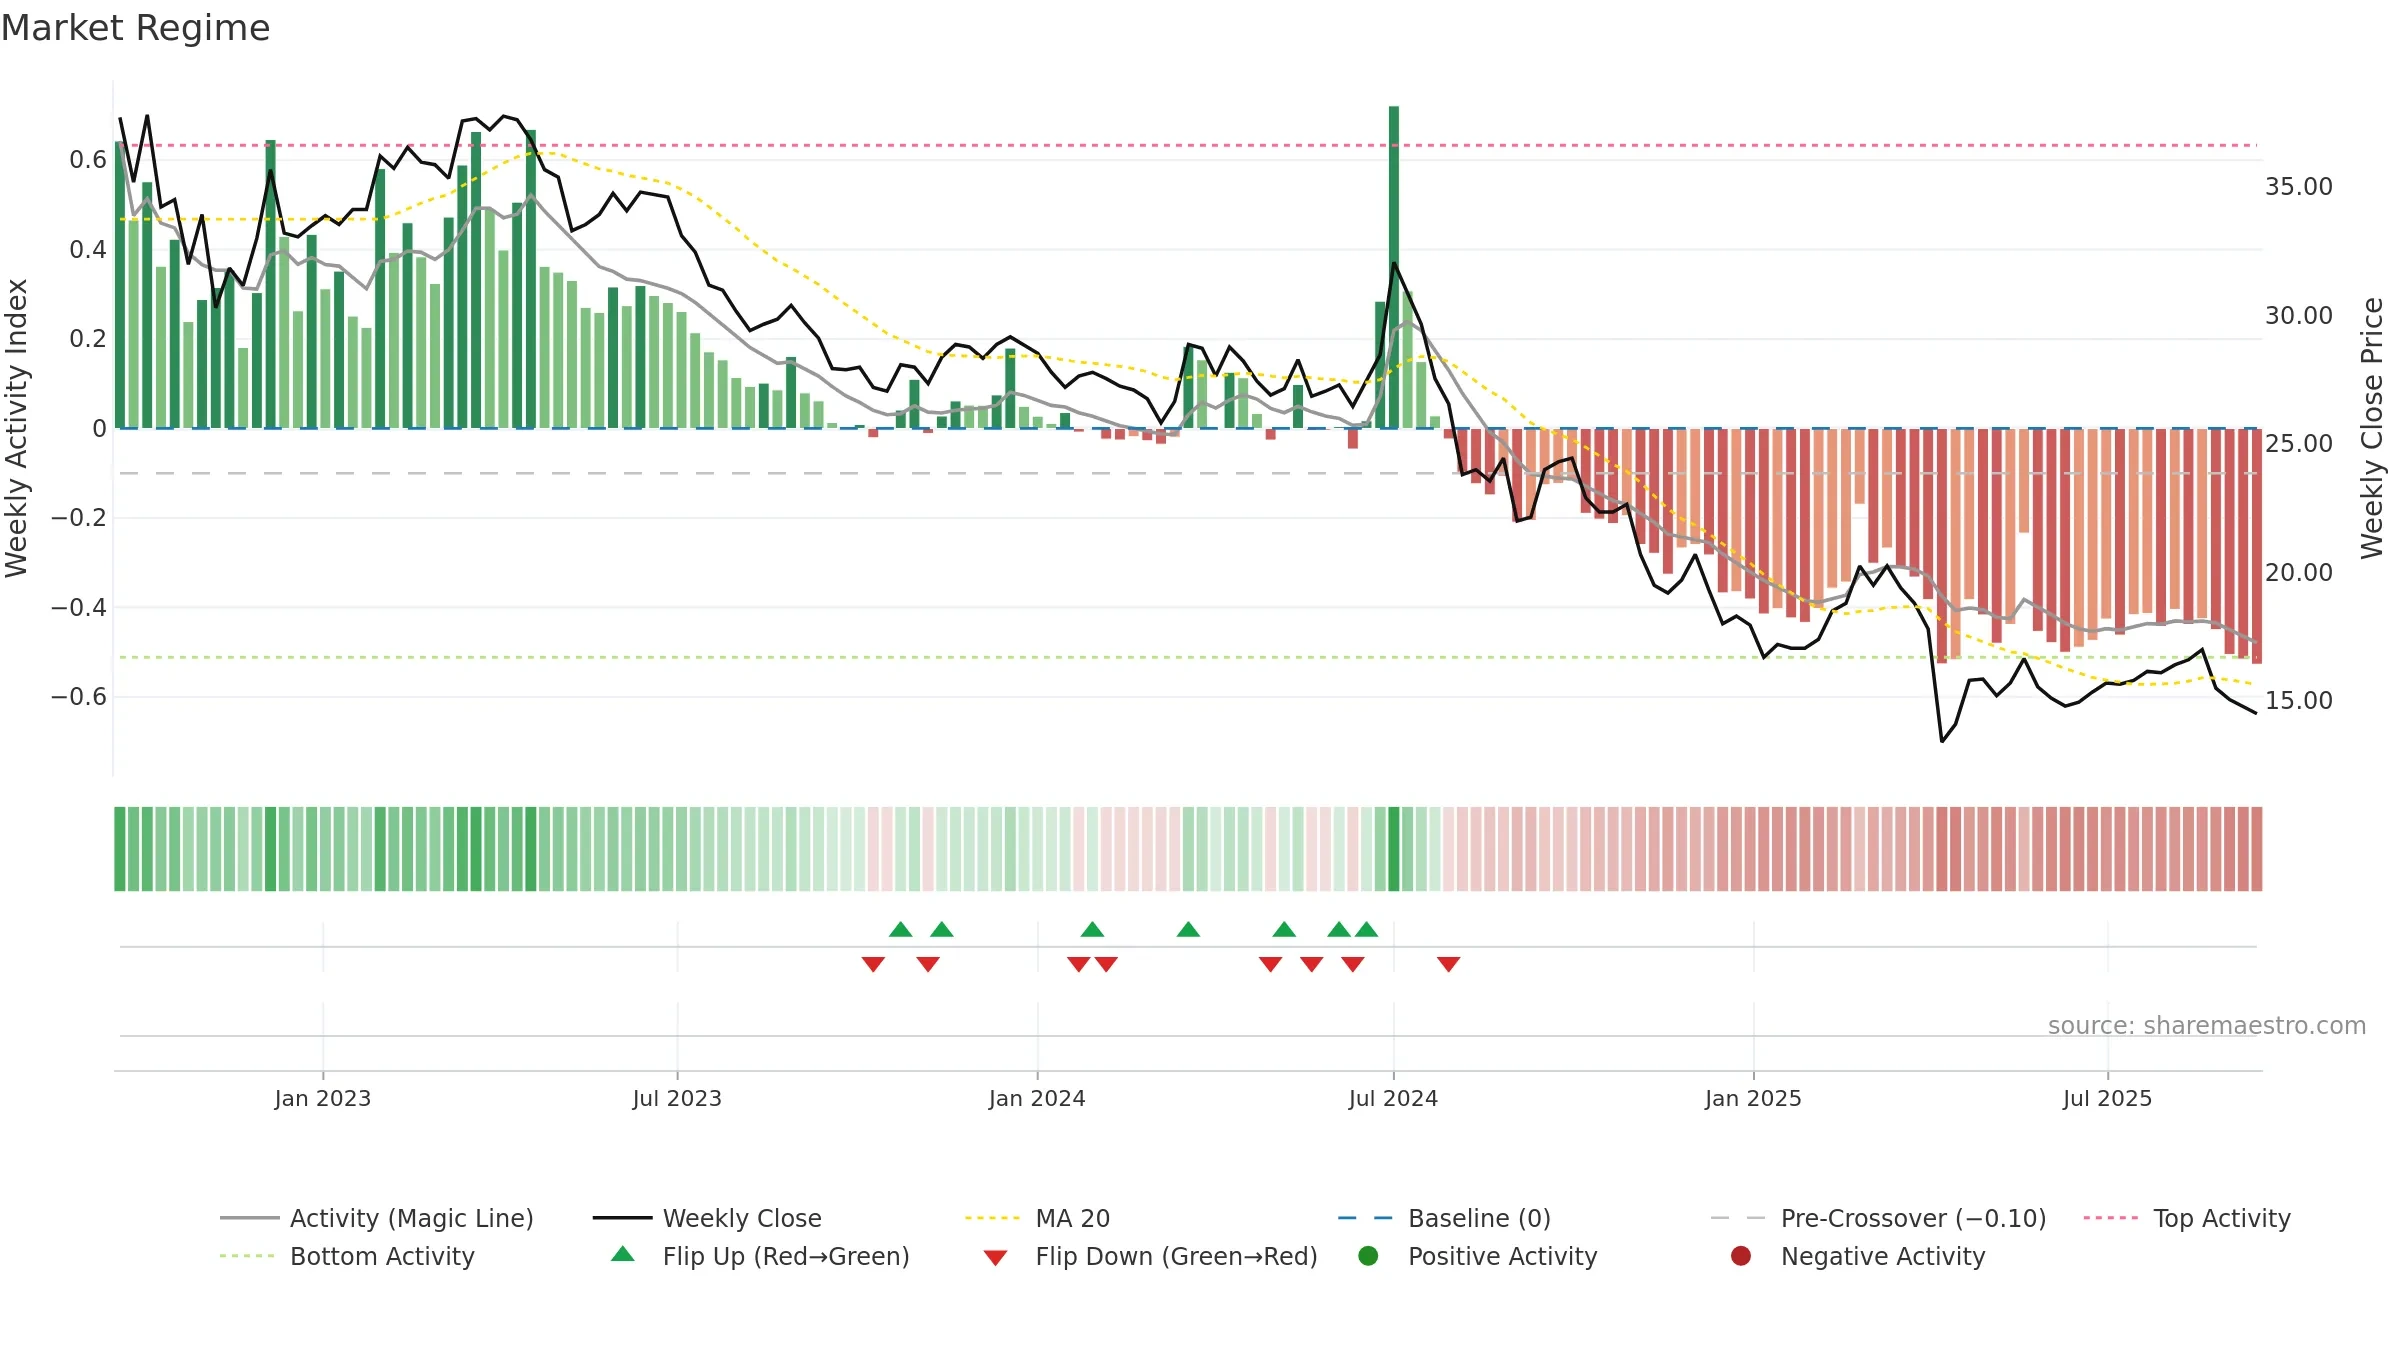
How to read this — Price slope is downward, indicating persistent supply pressure. Low weekly volatility favours steadier follow-through. Volume and price are moving in the same direction — a constructive confirmation. Returns are negatively correlated with volume — strength may come on lighter activity. Price sits below key averages, keeping pressure on the tape.
Down-slope argues for patience; rallies can fade sooner unless participation improves.
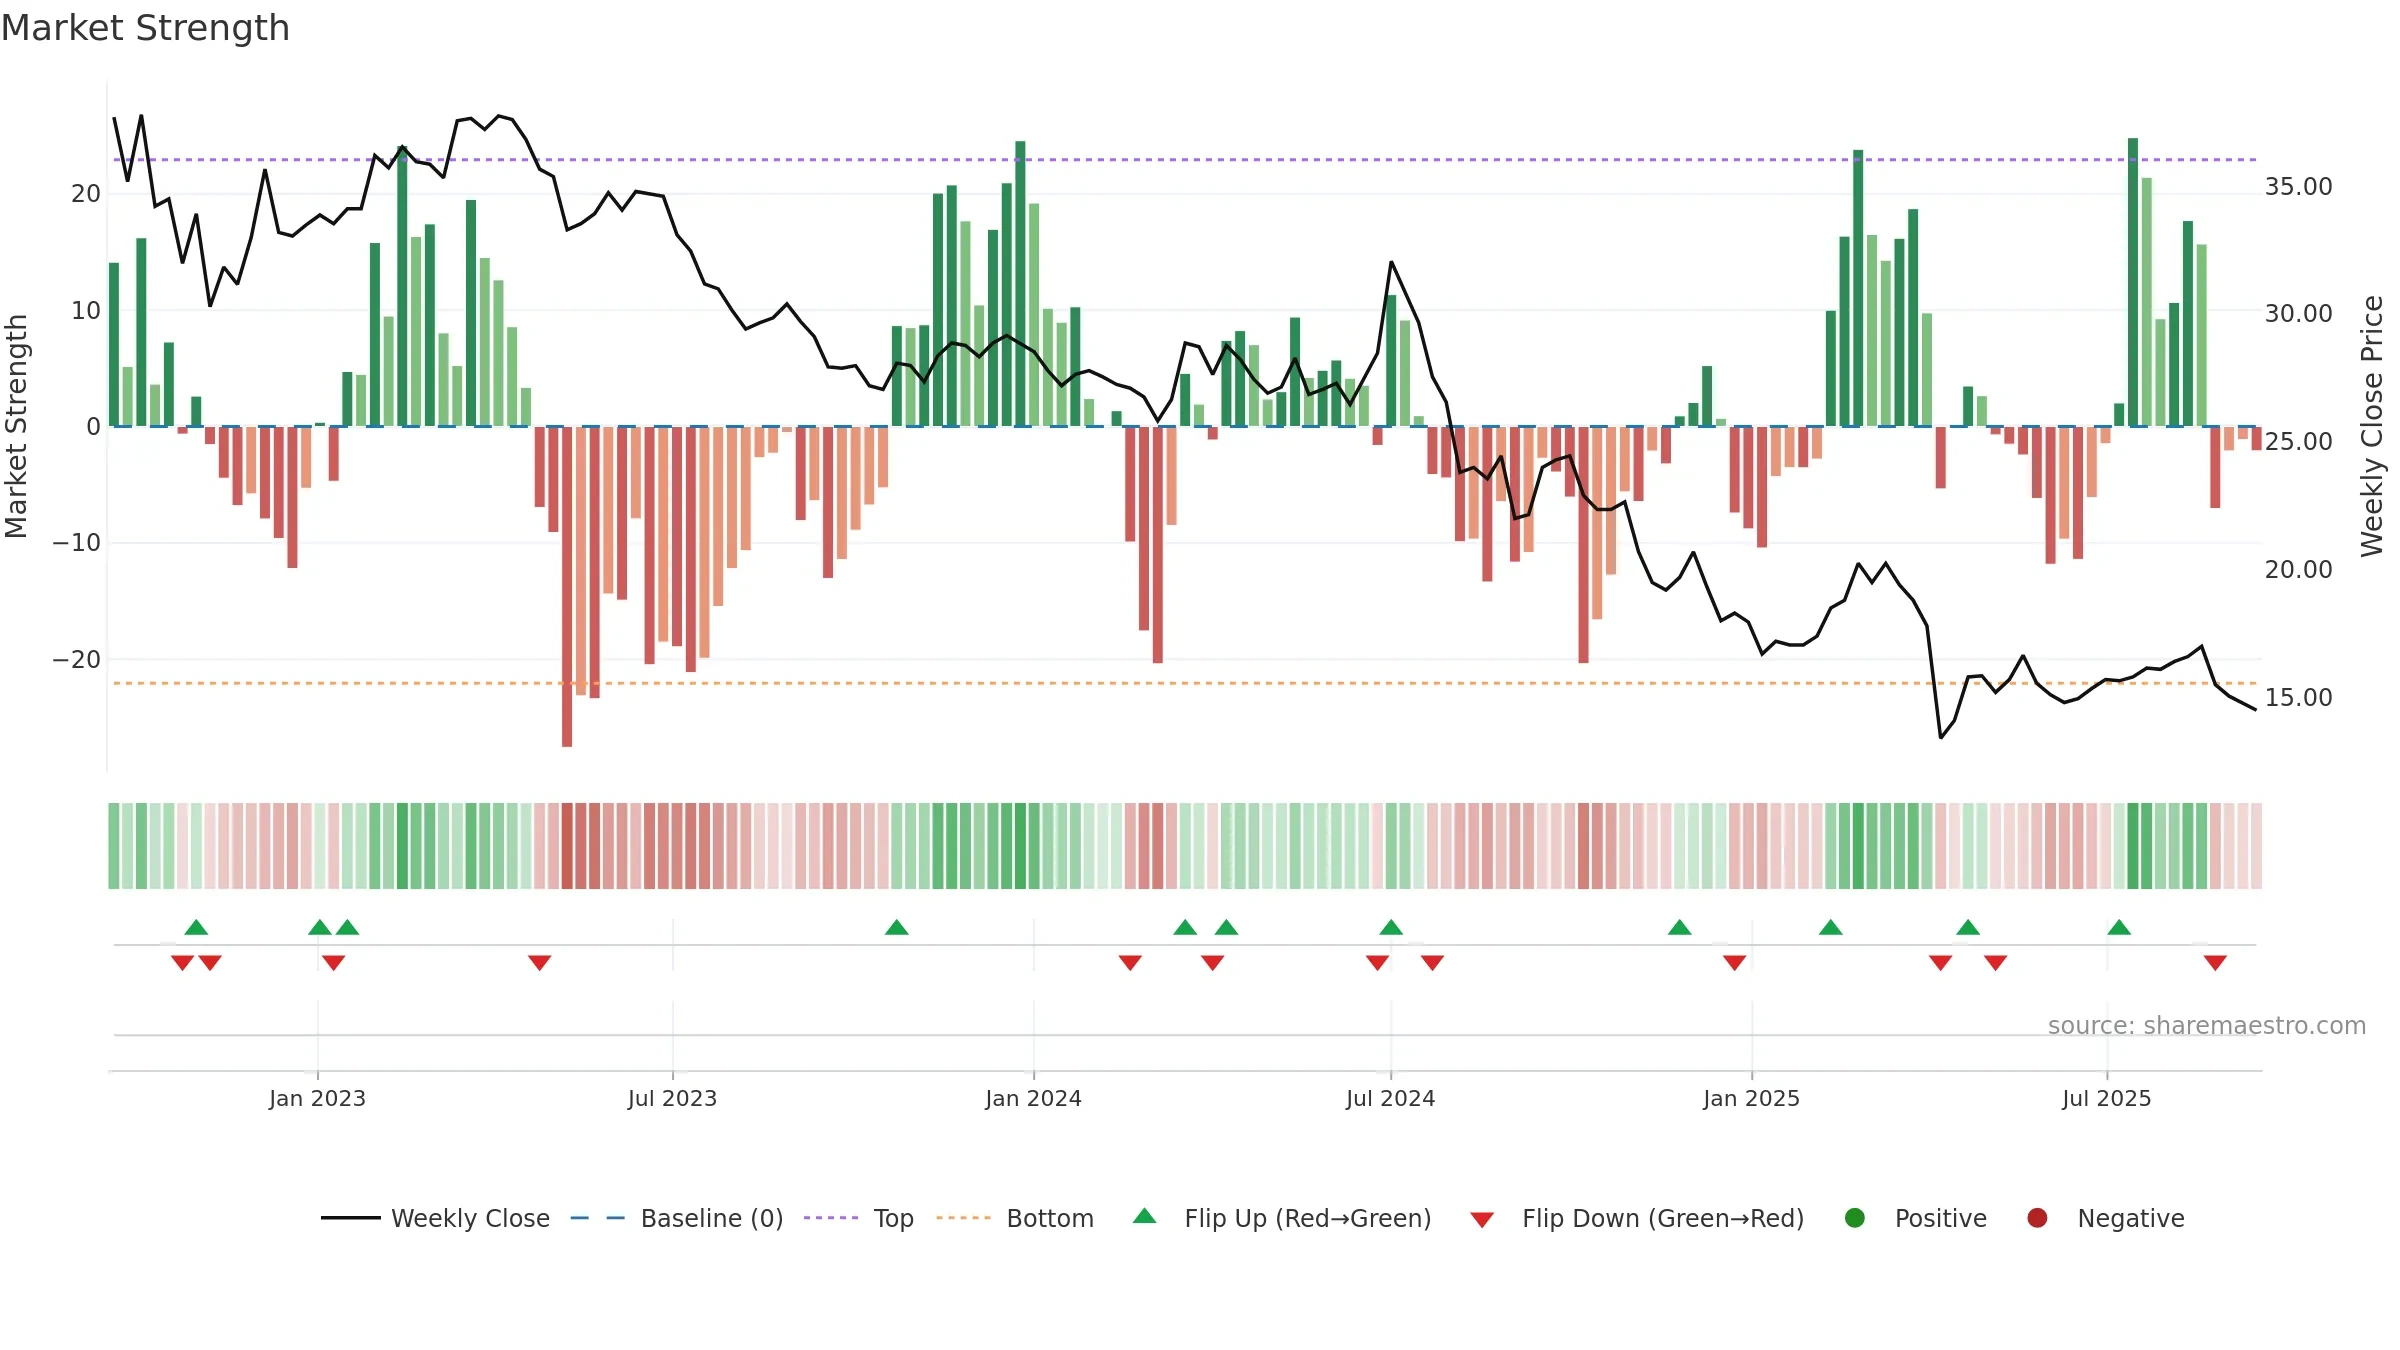
Gauge maps the trend signal to a 0–100 scale.
How to read this — Bearish backdrop but short-term momentum is improving; confirmation still needed.
Early improvement — look for a reclaim of 0.50→0.60 to validate.
The flag is positive: favourable upside skew with supportive conditions.
Conclusion
Positive setup. ★★★★☆ confidence. Price window: -9. Trend: Bottoming Attempt; gauge 16. In combination, liquidity confirms the move.
- Early improvement from bearish zone (bottoming attempt)
- Liquidity confirms the price trend
- Low return volatility supports durability
- Price is not above key averages
- Negative multi-week performance
Why: Price window -9.94% over 8w. Close is -14.71% below the prior-window high. Return volatility 1.79%. Volume trend falling. Liquidity convergence with price. Trend state bottoming attempt. Low-regime (≤0.25) upticks 4/7 (57.0%) • Accumulating. Momentum neutral and rising. Valuation stance positive.
Tip: Most metrics include a hover tooltip where they appear in the report.