Hangzhou Tigermed Consulting Co., Ltd
3347 HKG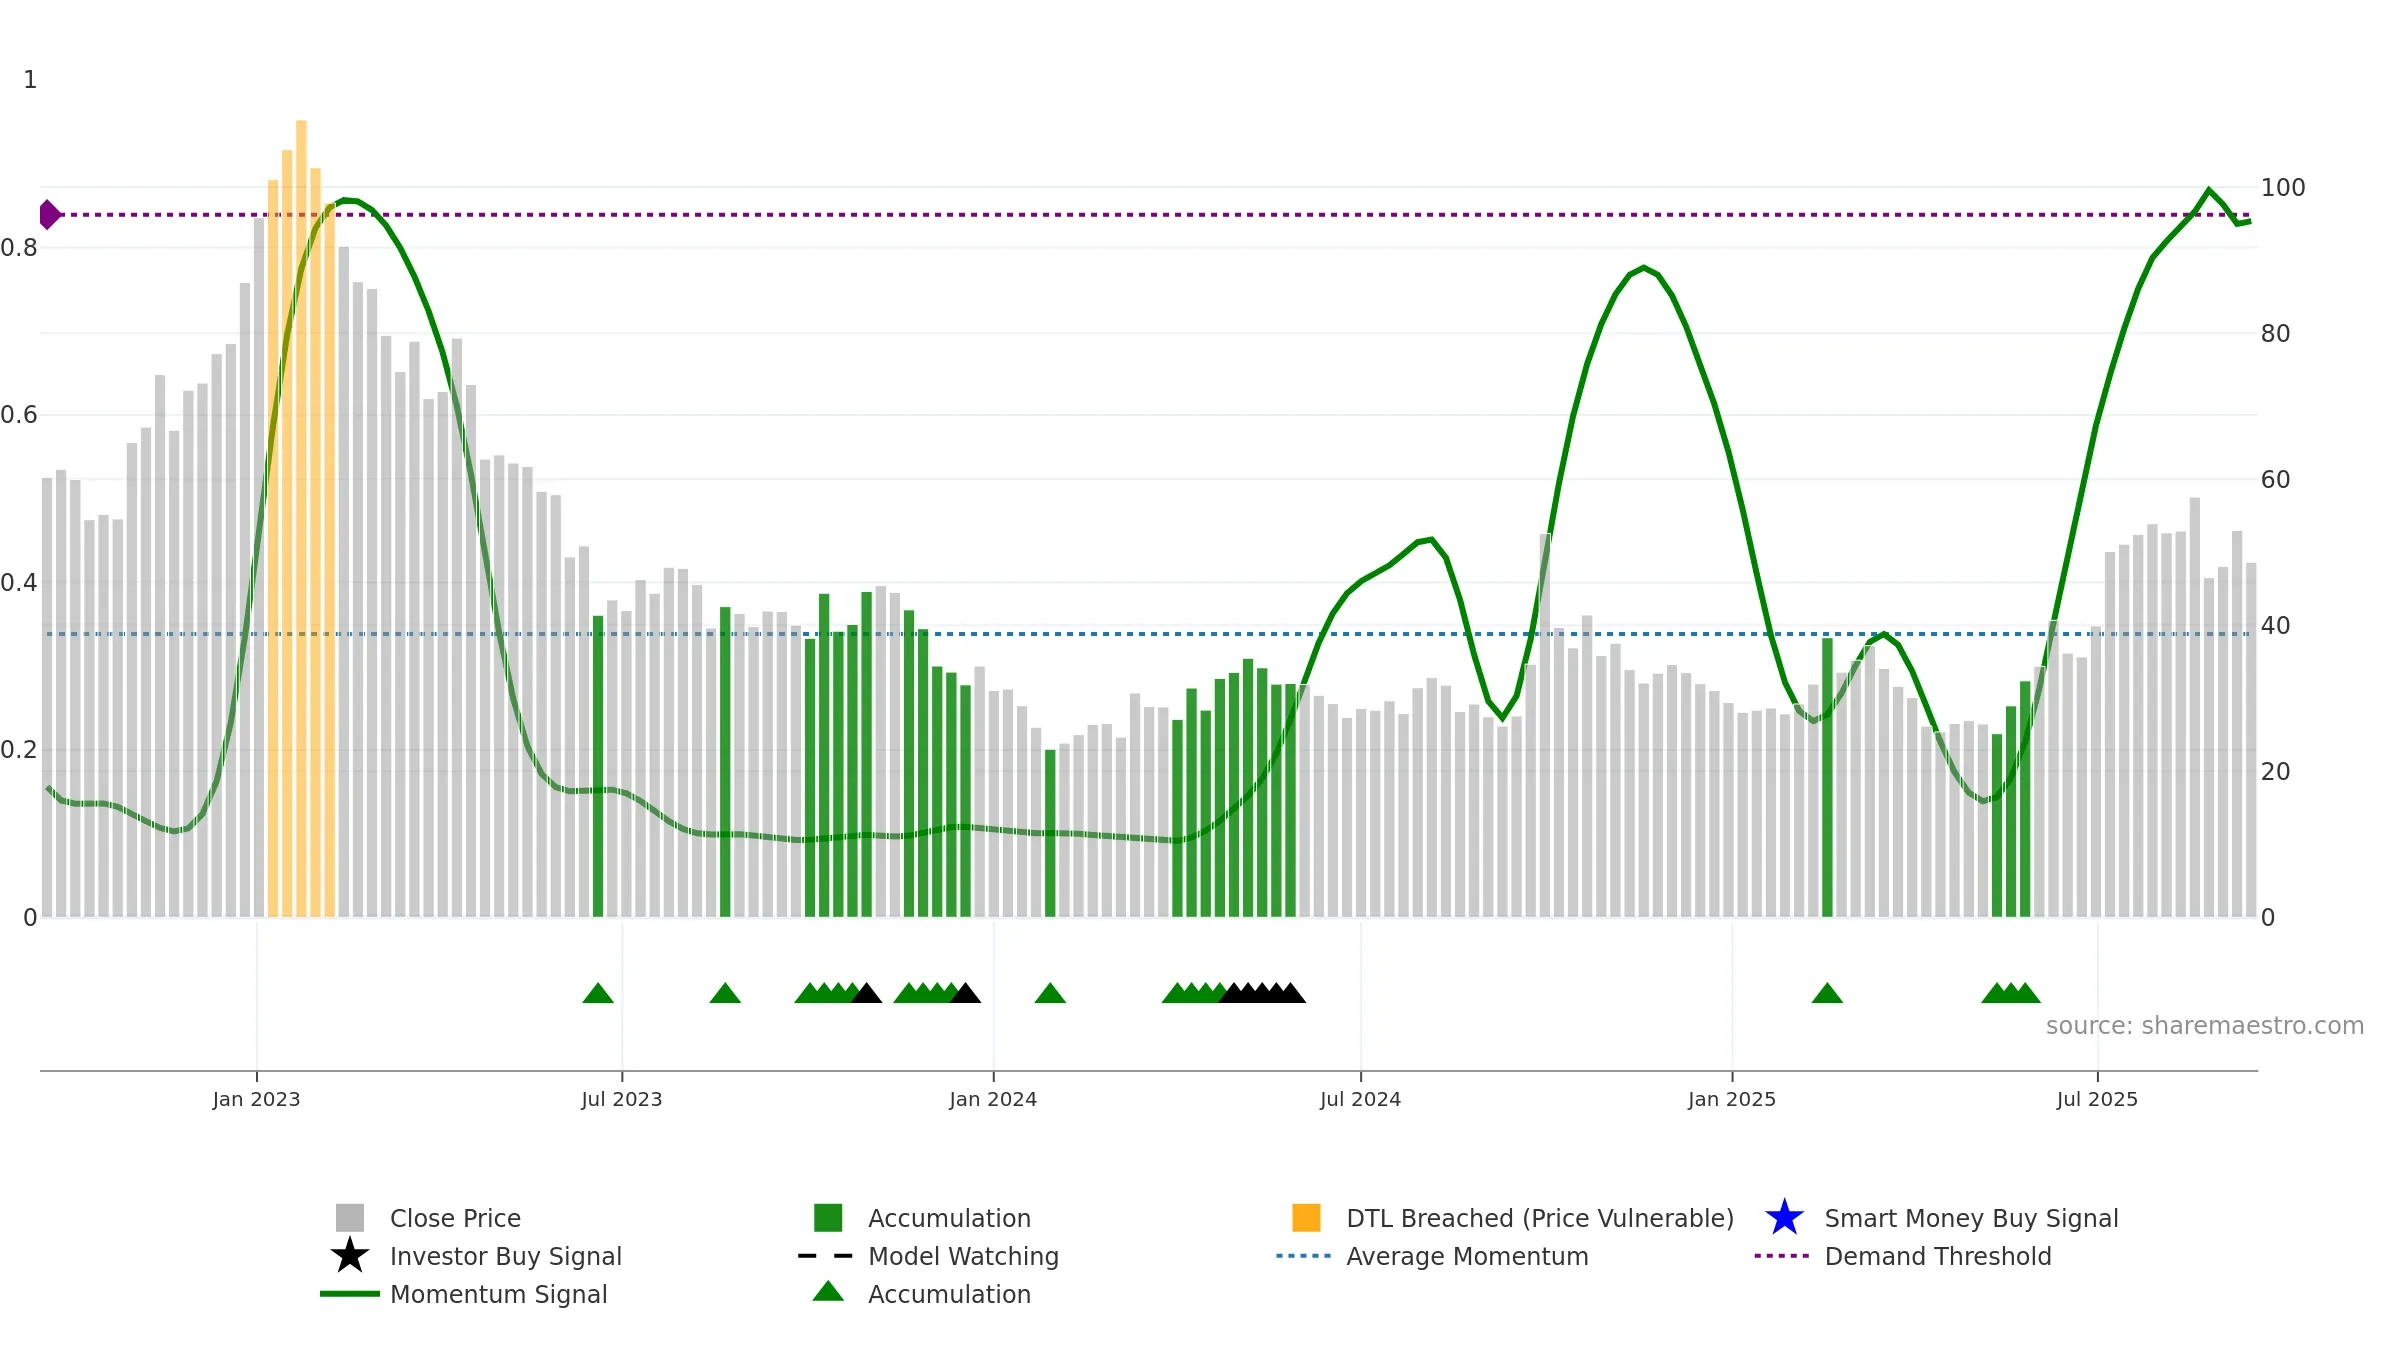
Weekly Report
Hangzhou Tigermed Consulting Co., Ltd closed at 48.6200 (0.29% WoW) . Data window ends Mon, 15 Sep 2025.
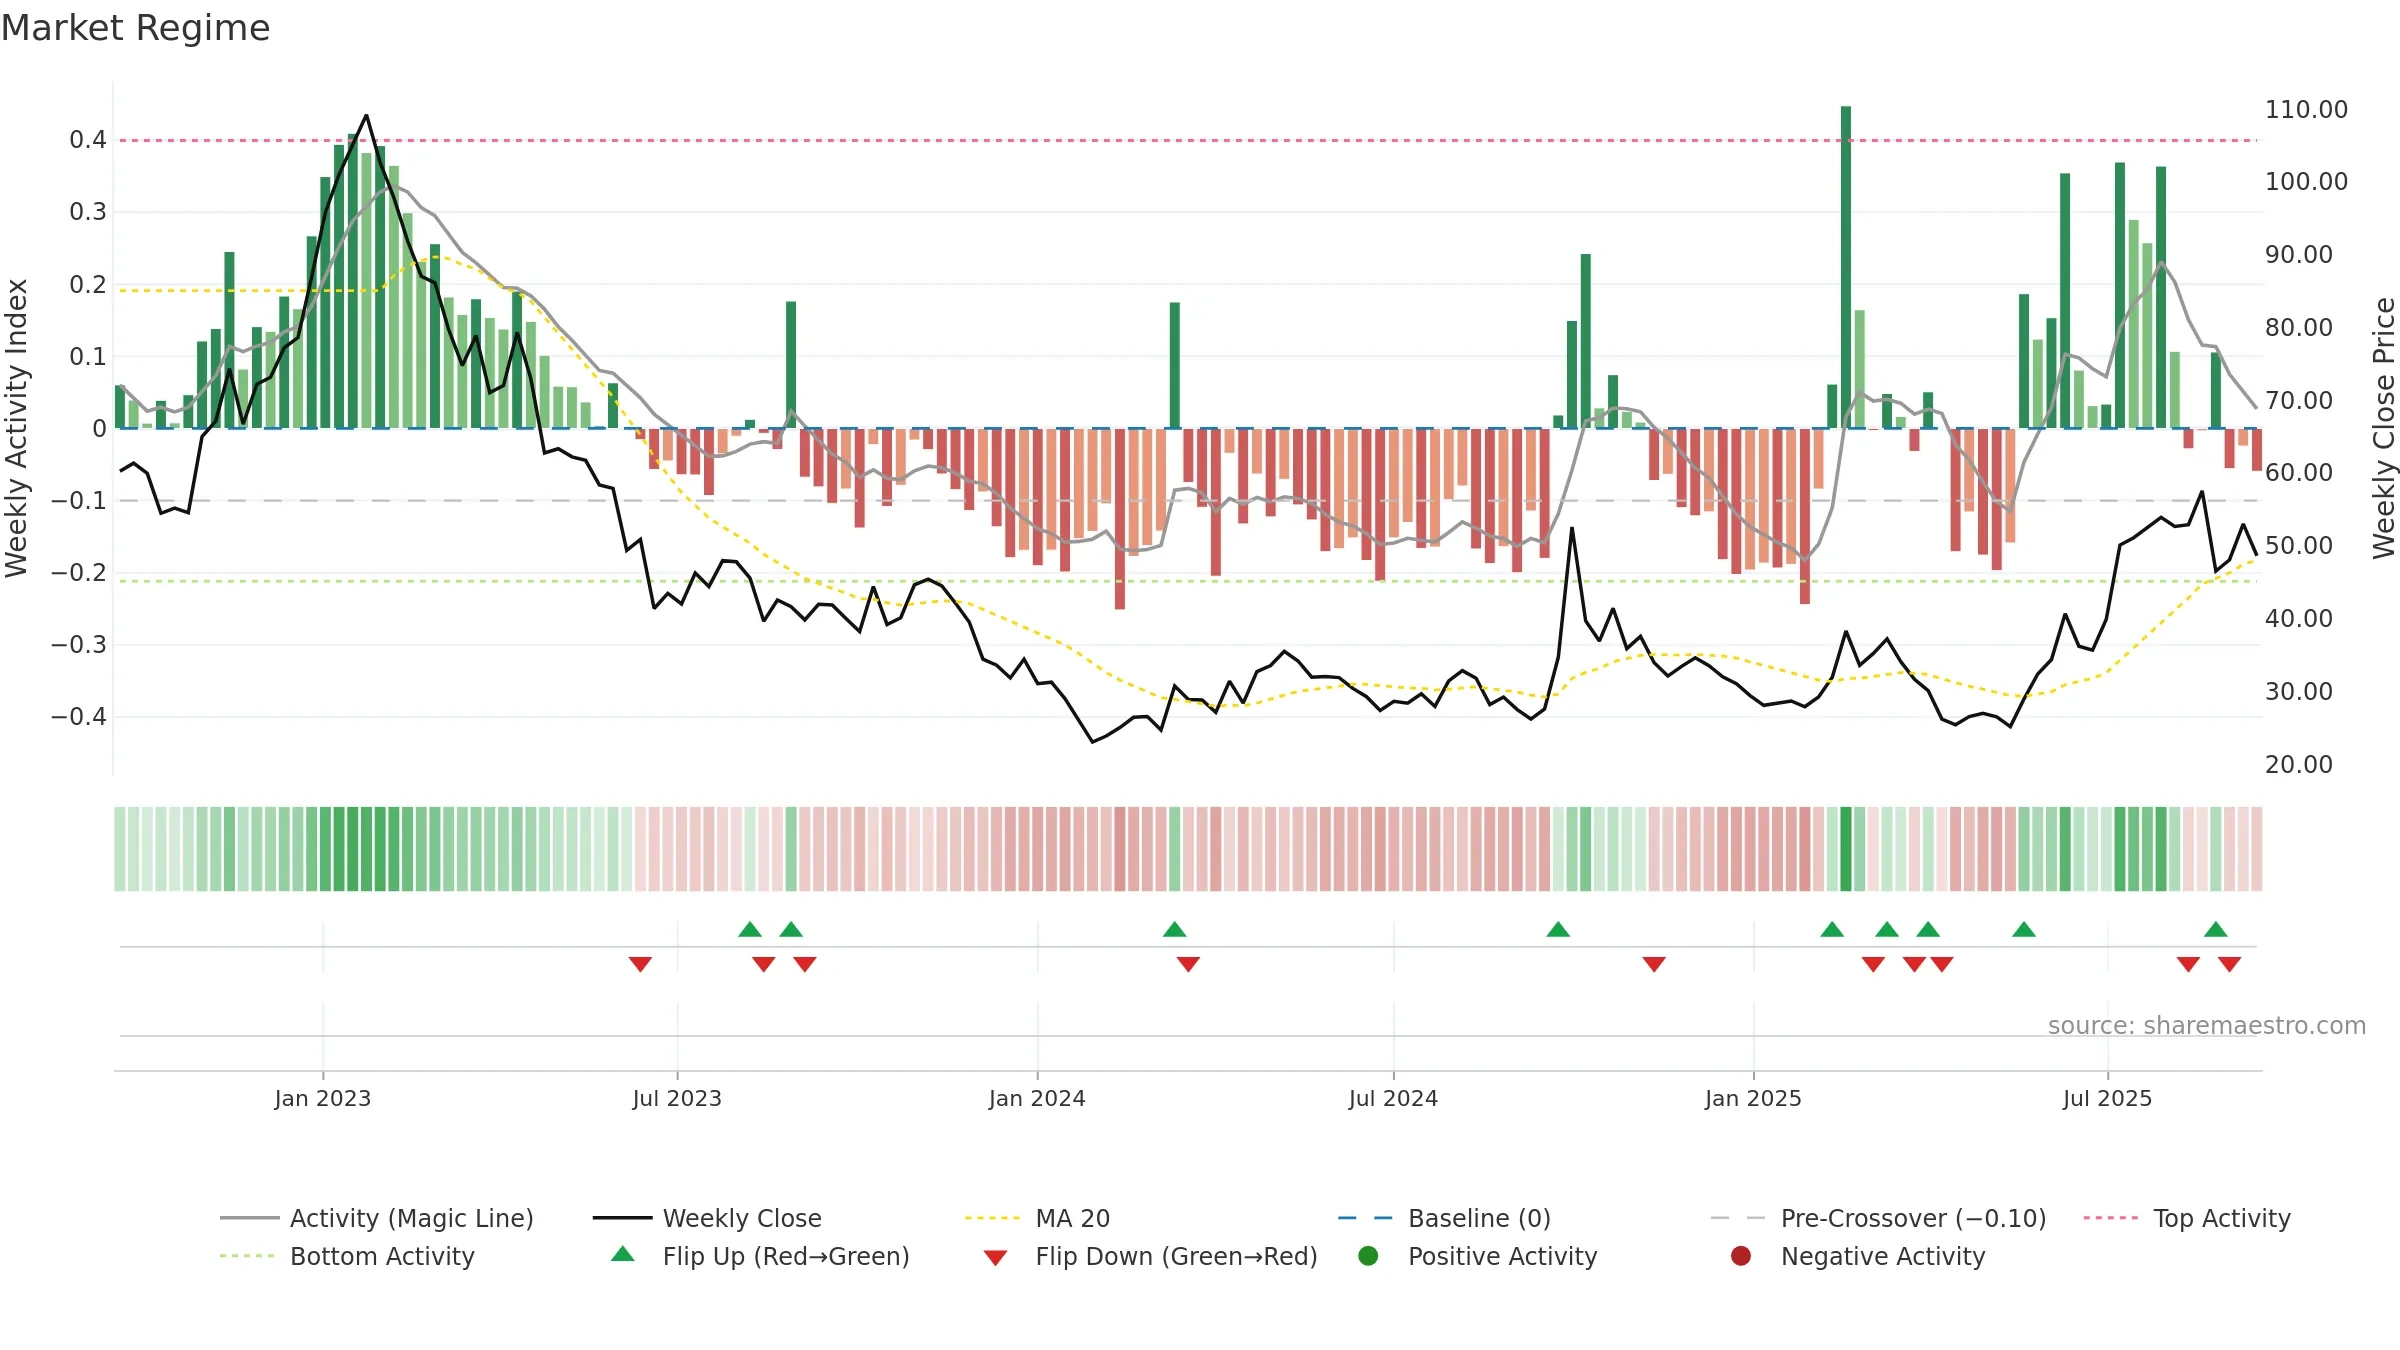
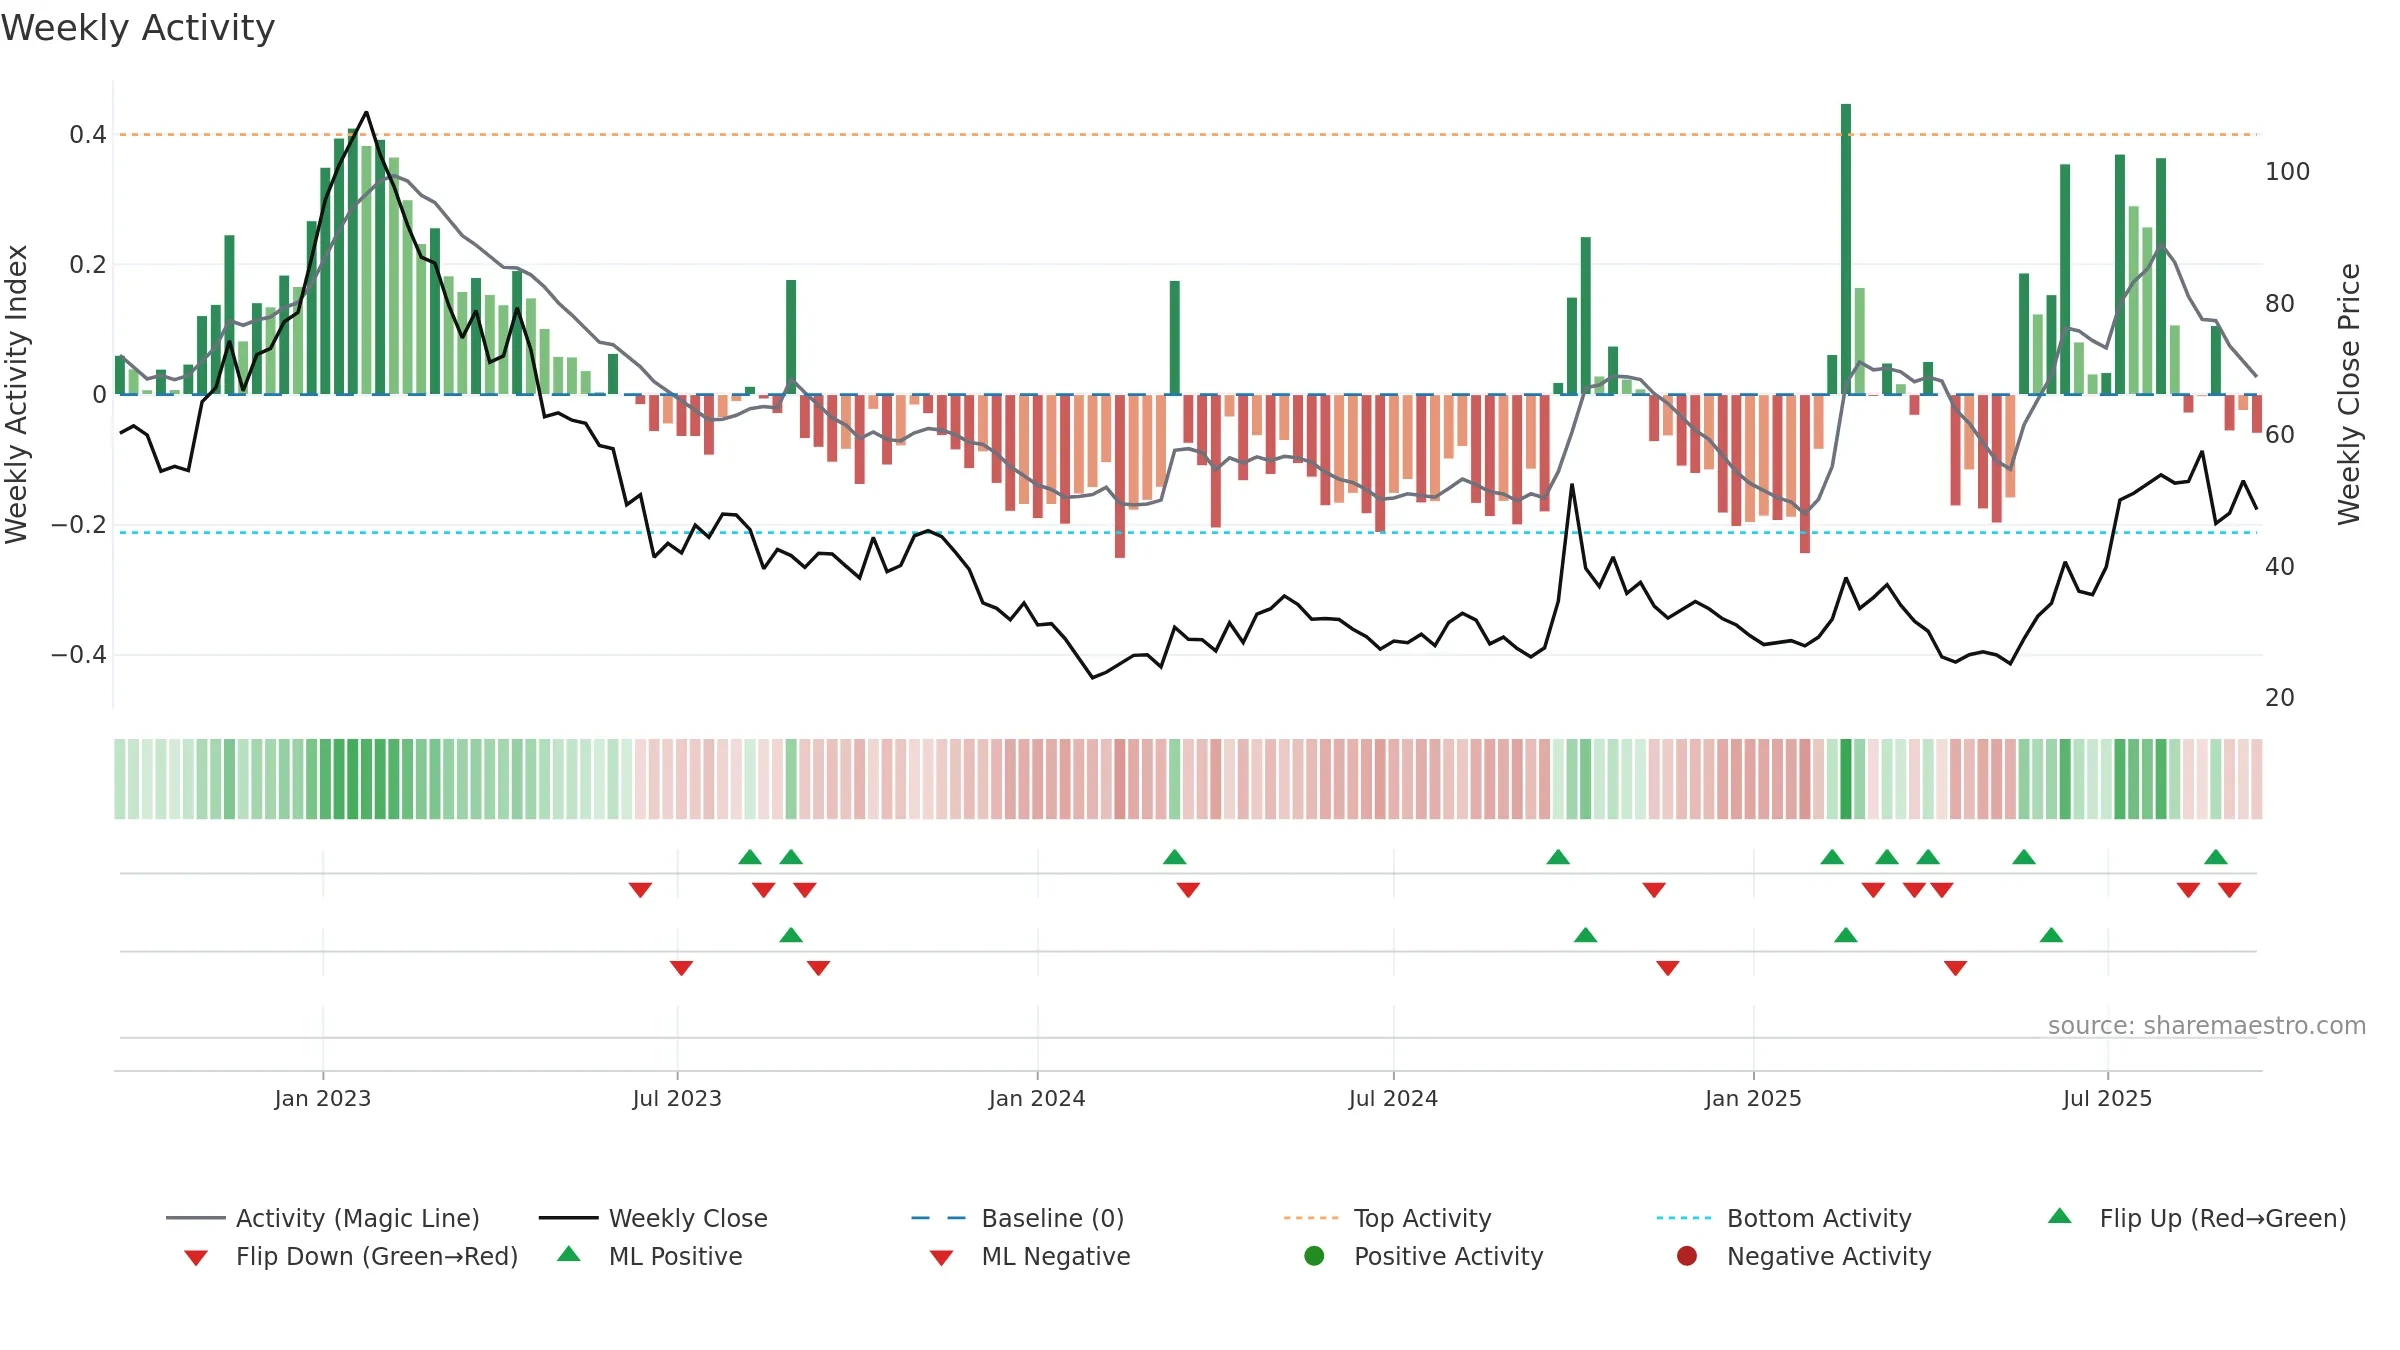
How to read this — Price slope is downward, indicating persistent supply pressure. Elevated weekly volatility increases whipsaw risk. Volume and price are moving in the same direction — a constructive confirmation.
Down-slope argues for patience; rallies can fade sooner unless participation improves.
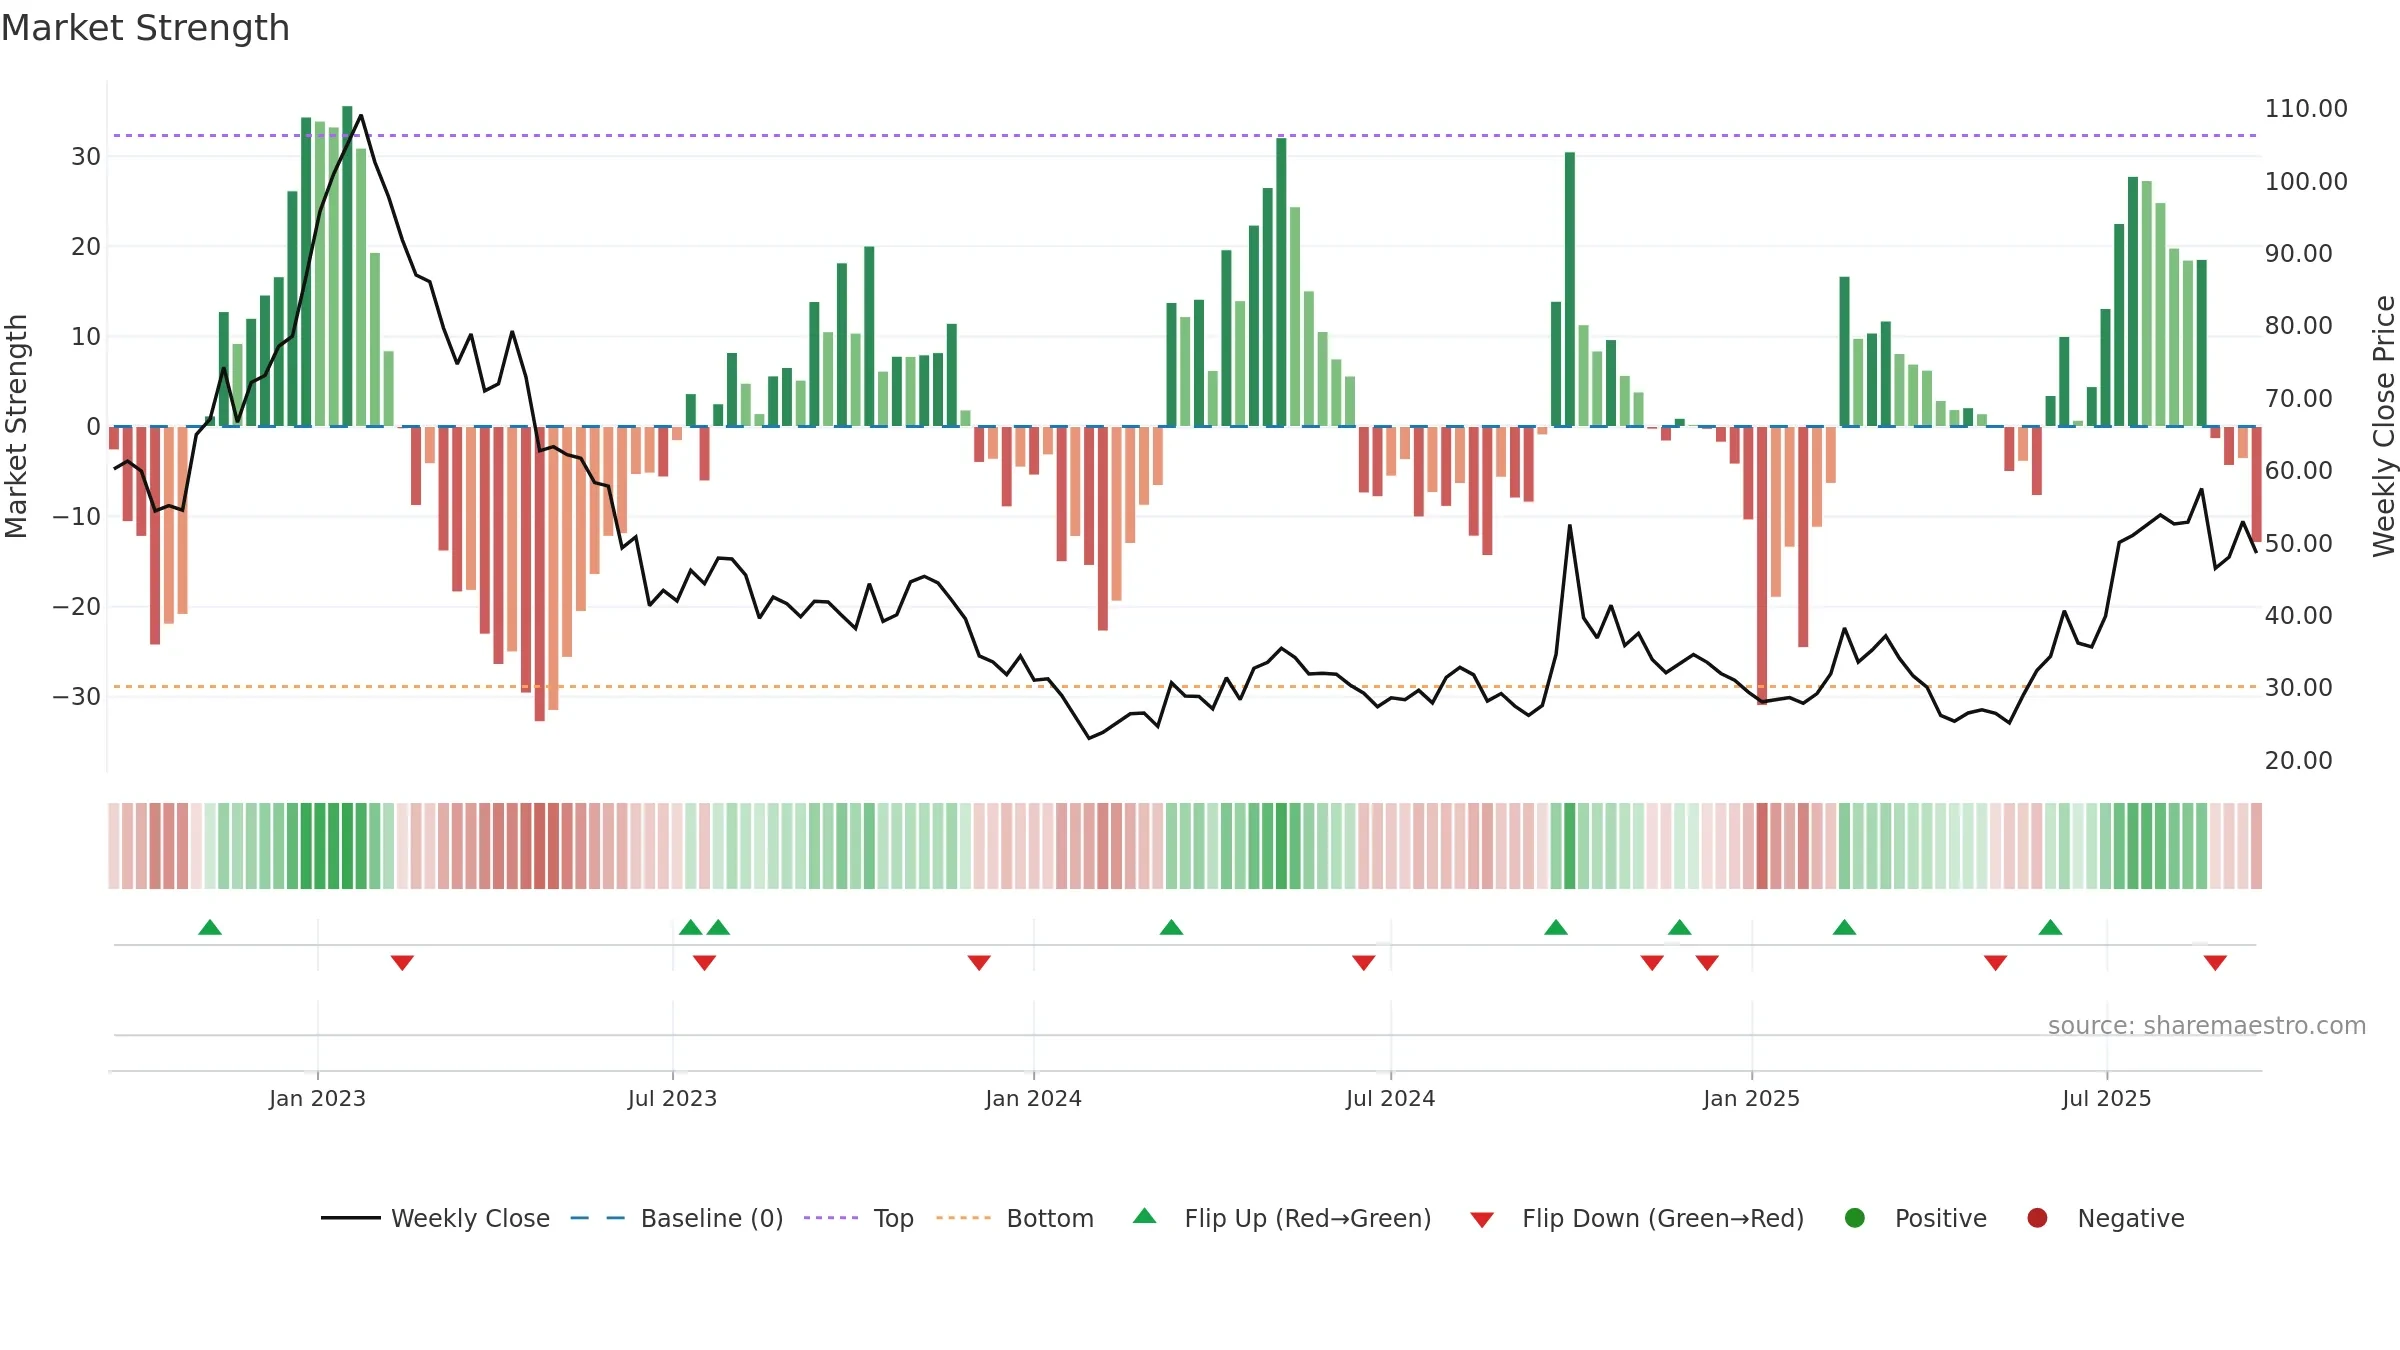
Gauge maps the trend signal to a 0–100 scale.
How to read this — Gauge is elevated but momentum is rolling over; topping risk is rising.
Stay alert: protect gains or seek confirmation before adding risk.
Conclusion
Negative setup. ★★☆☆☆ confidence. Price window: -9. Trend: Uptrend at Risk; gauge 83. In combination, liquidity confirms the move.
- Momentum is bullish and rising
- Liquidity confirms the price trend
- High-level but rolling over (topping risk)
- Price is not above key averages
- High return volatility raises whipsaw risk
- Negative multi-week performance
Why: Price window -9.80% over 8w. Close is -15.52% below the prior-window high. Return volatility 4.86%. Volume trend falling. Liquidity convergence with price. Trend state uptrend at risk. High-regime (0.80–1.00) downticks 2/6 (33.0%) • Accumulating. Momentum bullish and rising.
Tip: Most metrics include a hover tooltip where they appear in the report.