Georgia Capital PLC
CGEO LSE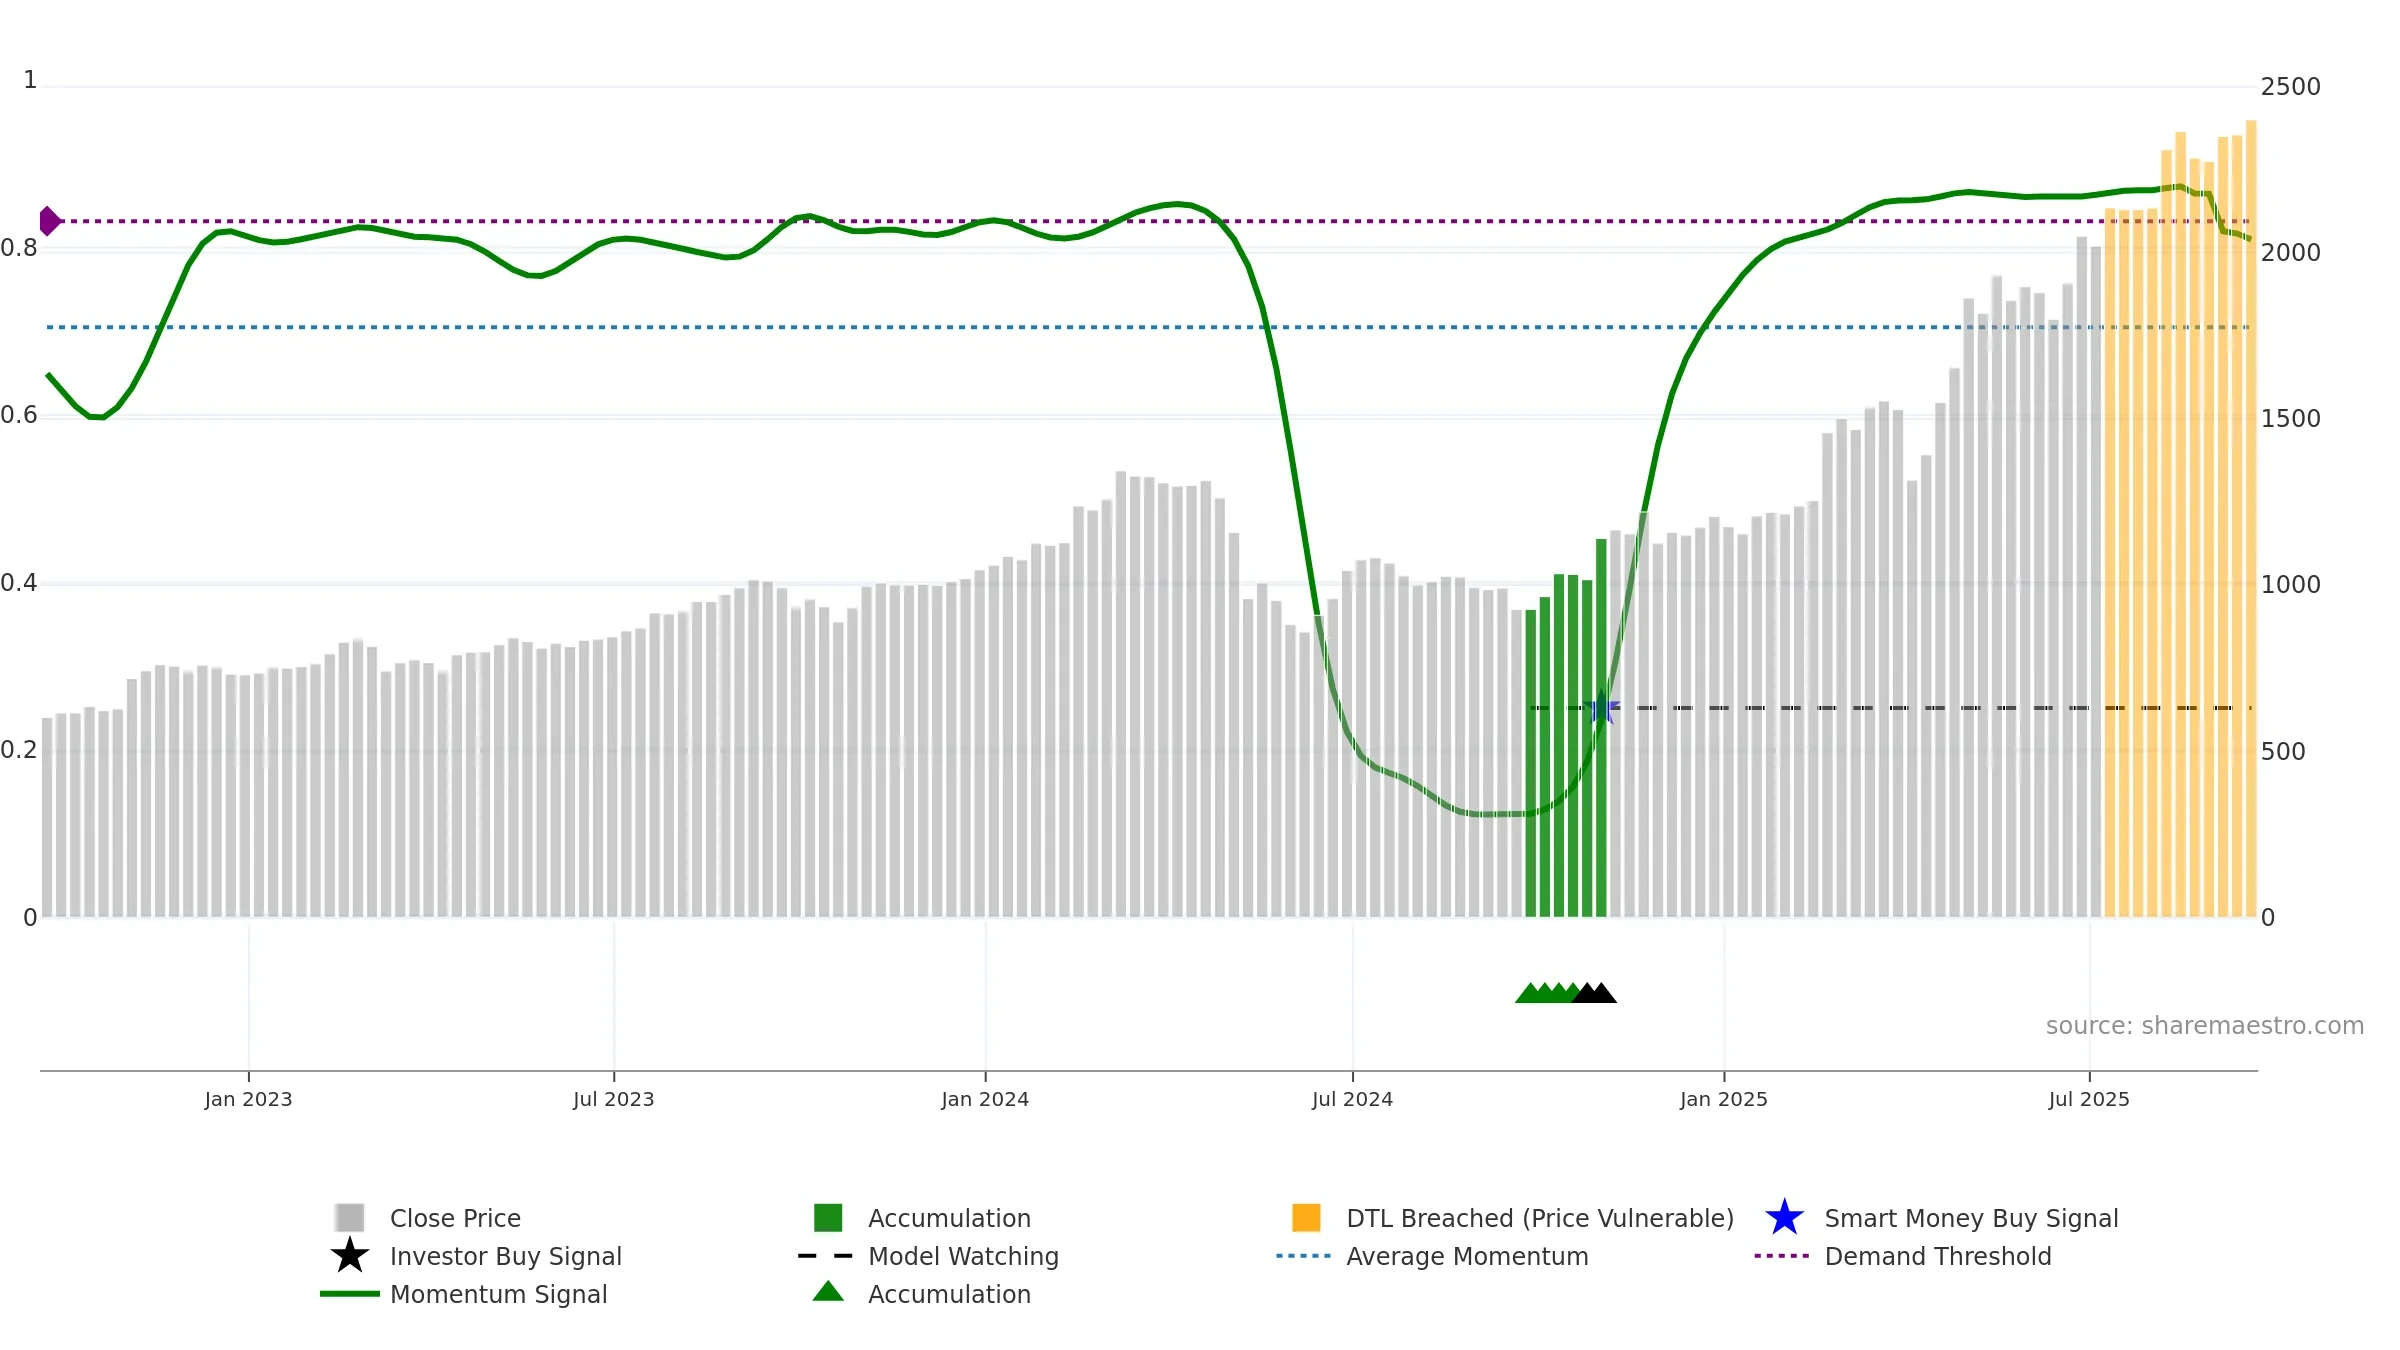
Weekly Summary
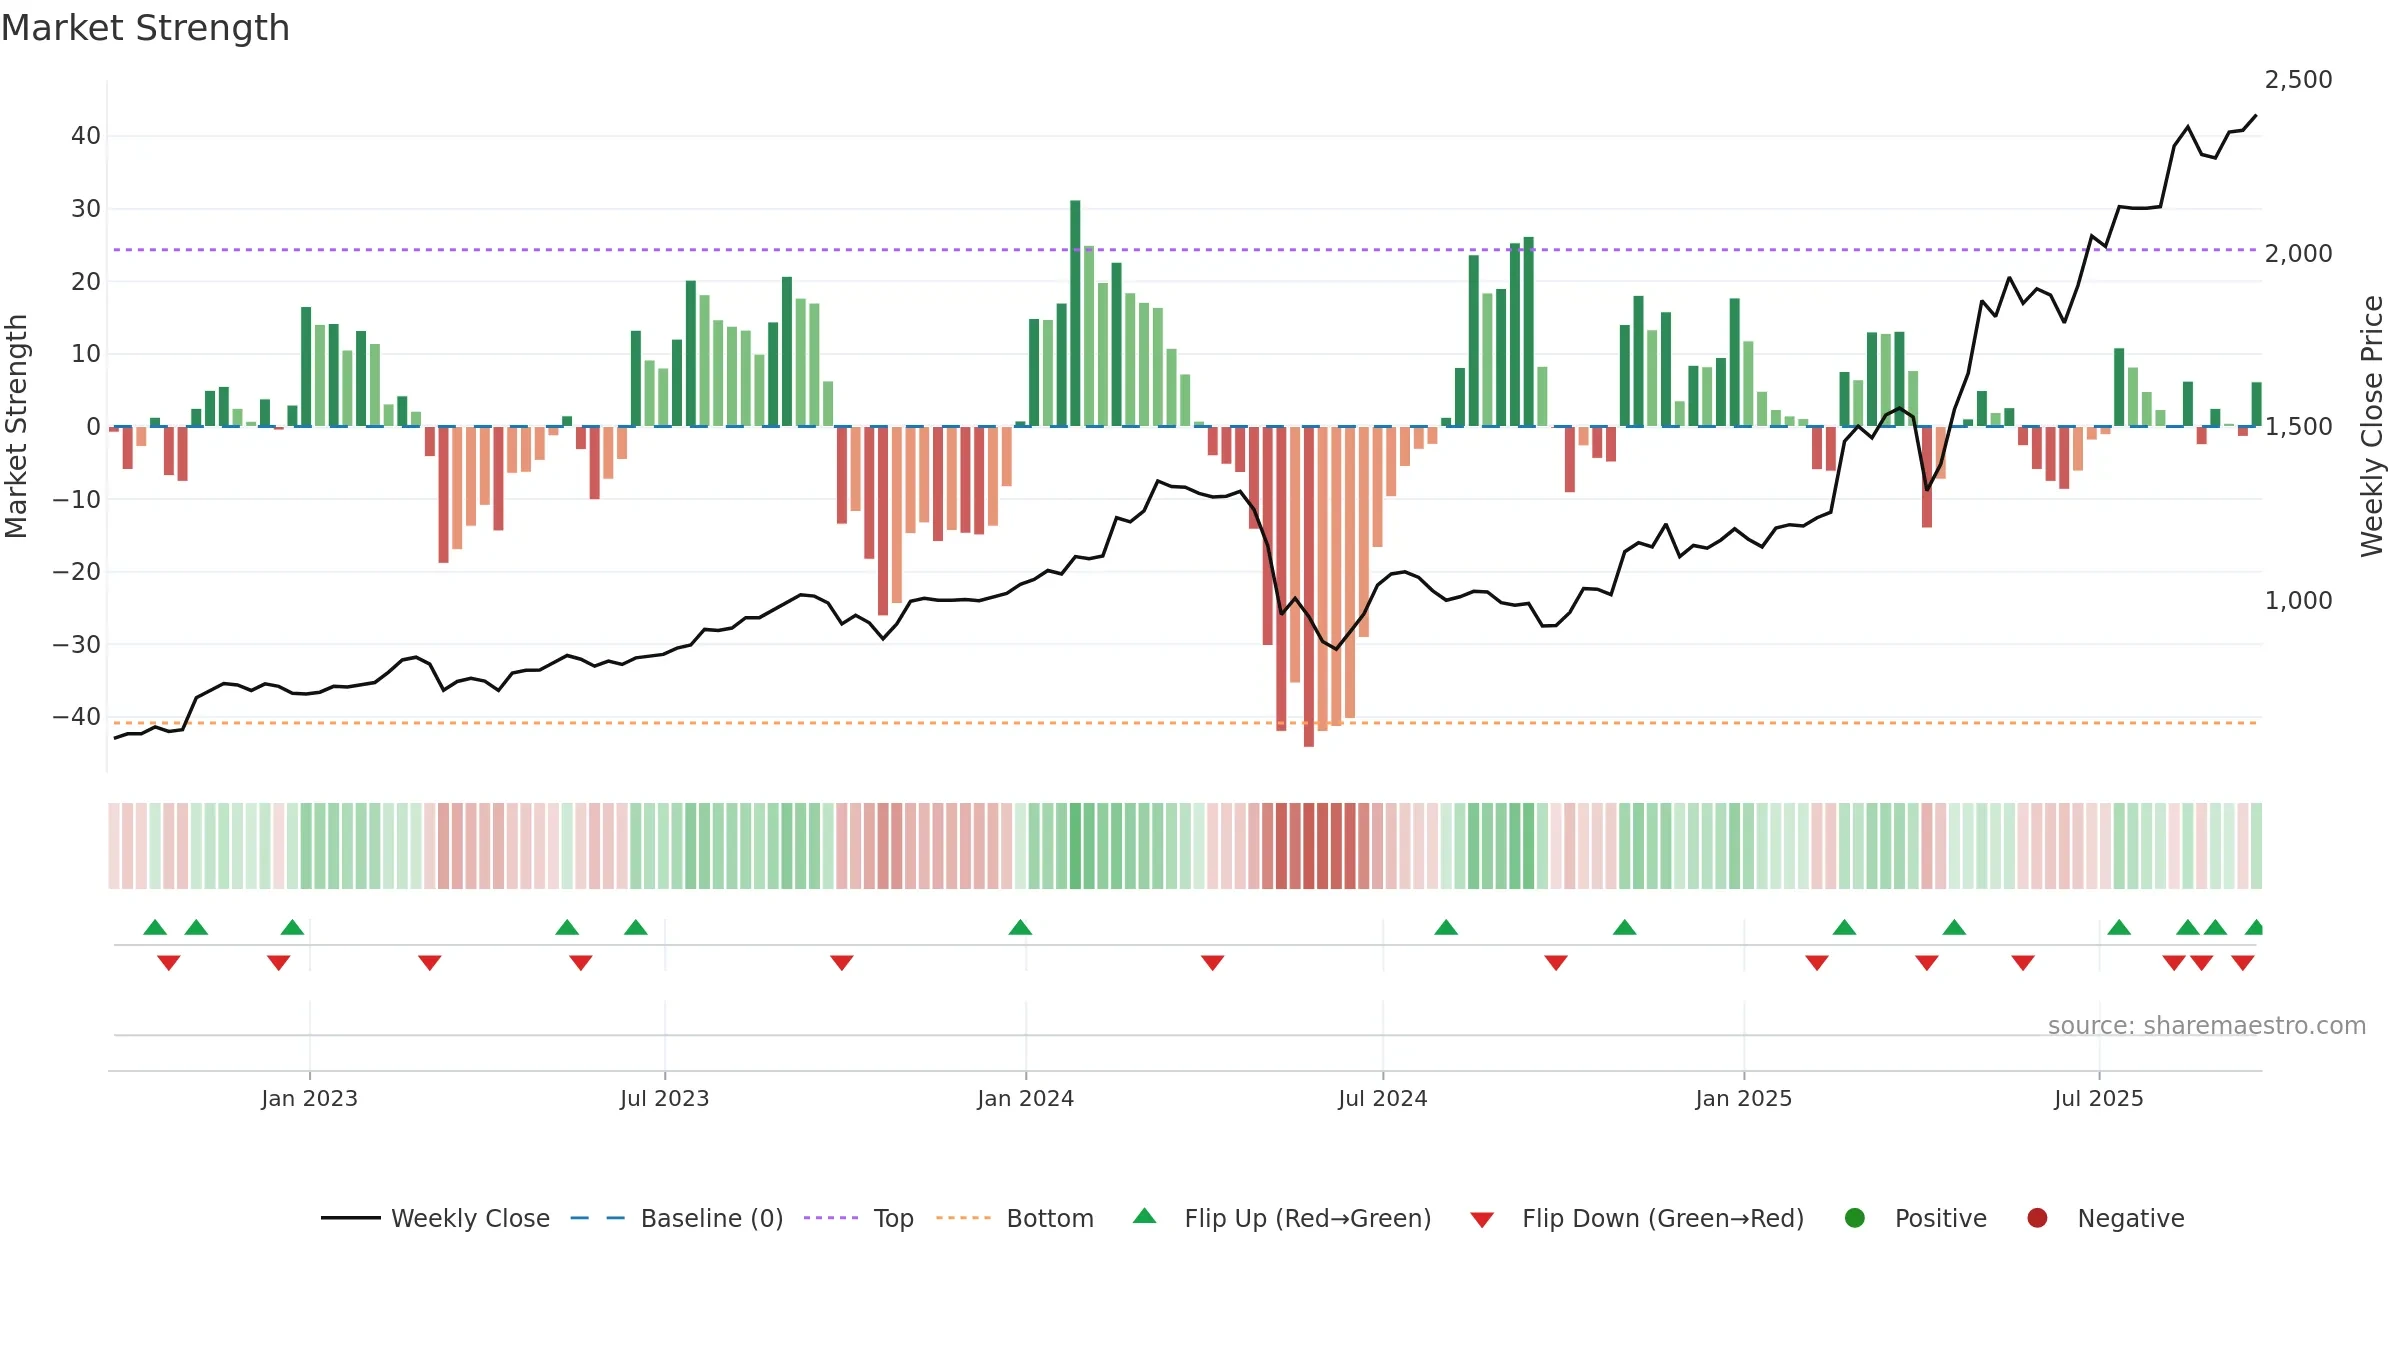
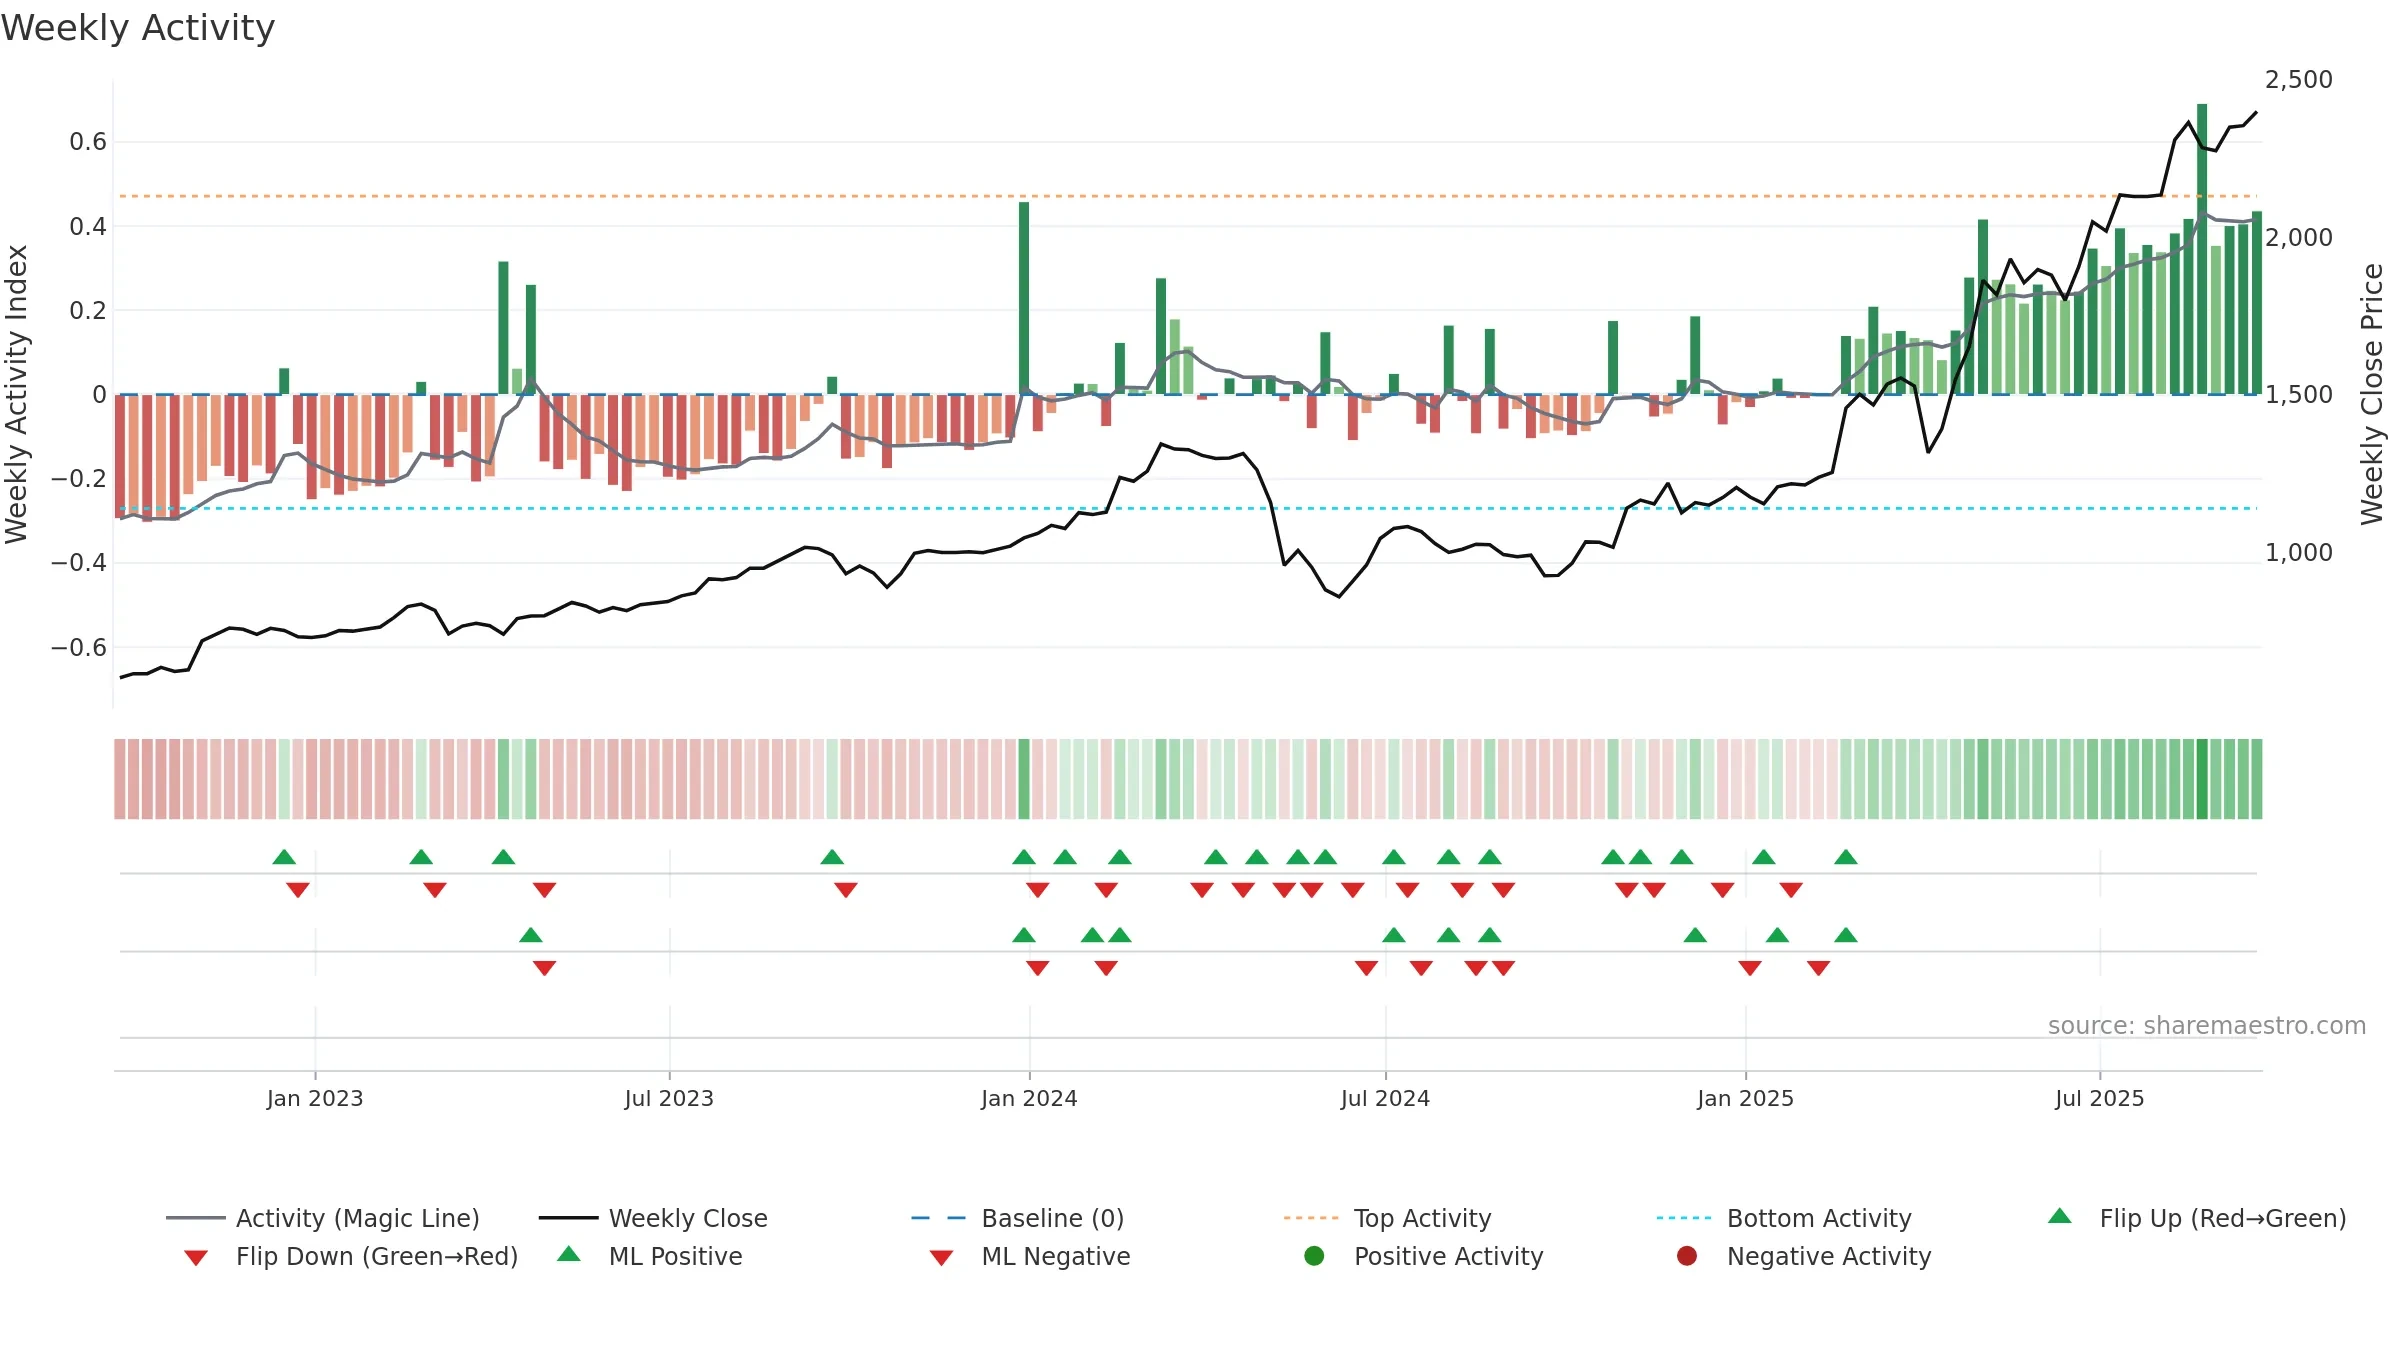
Georgia Capital PLC closed at 2400.0000 (-2.83% WoW) . Data window ends Fri, 19 Sep 2025.
How to read this — Price slope is upward, indicating persistent buying over the window. Volume trend diverges from price — watch for fatigue or rotation. Distance to baseline is narrowing — reverting closer to its fair-value track. Constructive MA stack supports the up-drift; pullbacks may find support at the 8–13 week region. Price holds above key averages, indicating constructive participation.
Up-slope supports buying interest; pullbacks may be contained if activity stays firm. Because liquidity isn’t confirming, prefer evidence of fresh demand before chasing moves.
Gauge maps the trend signal to a 0–100 scale.
How to read this — Gauge is elevated but momentum is rolling over; topping risk is rising.
Stay alert: protect gains or seek confirmation before adding risk.

Relative strength is Positive
(> 0%, outperforming).
Latest MRS: 25.24% (week ending Fri, 19 Sep 2025).
Slope: Falling over 8w.
Notes:
- Holding above the zero line indicates relative bid.
- MRS slope falling over ~8 weeks.
The flag is positive: favourable upside skew with supportive conditions.
Conclusion
Neutral setup. ★★★☆☆ confidence. Trend: Uptrend at Risk · 12.41% over window · vol 2.27% · liquidity divergence · posture above · RS outperforming
- Price holds above 8–26 week averages
- Constructive moving-average stack
- Solid multi-week performance
- Mansfield RS: outperforming & rising
- High level but momentum rolling over (topping risk)
- Momentum is weak/falling
- Liquidity diverges from price
Why: Price window 12.41% over w. Close is 1.48% above the prior-window high. Return volatility 2.27%. Volume trend falling. Liquidity divergence with price. Trend state uptrend at risk. MA stack constructive. Baseline deviation 1.07% (narrowing). Momentum neutral and falling. Valuation stance positive.
Tip: Most metrics include a hover tooltip where they appear in the report.