Kilitch Drugs (India) Limited
KILITCH NSE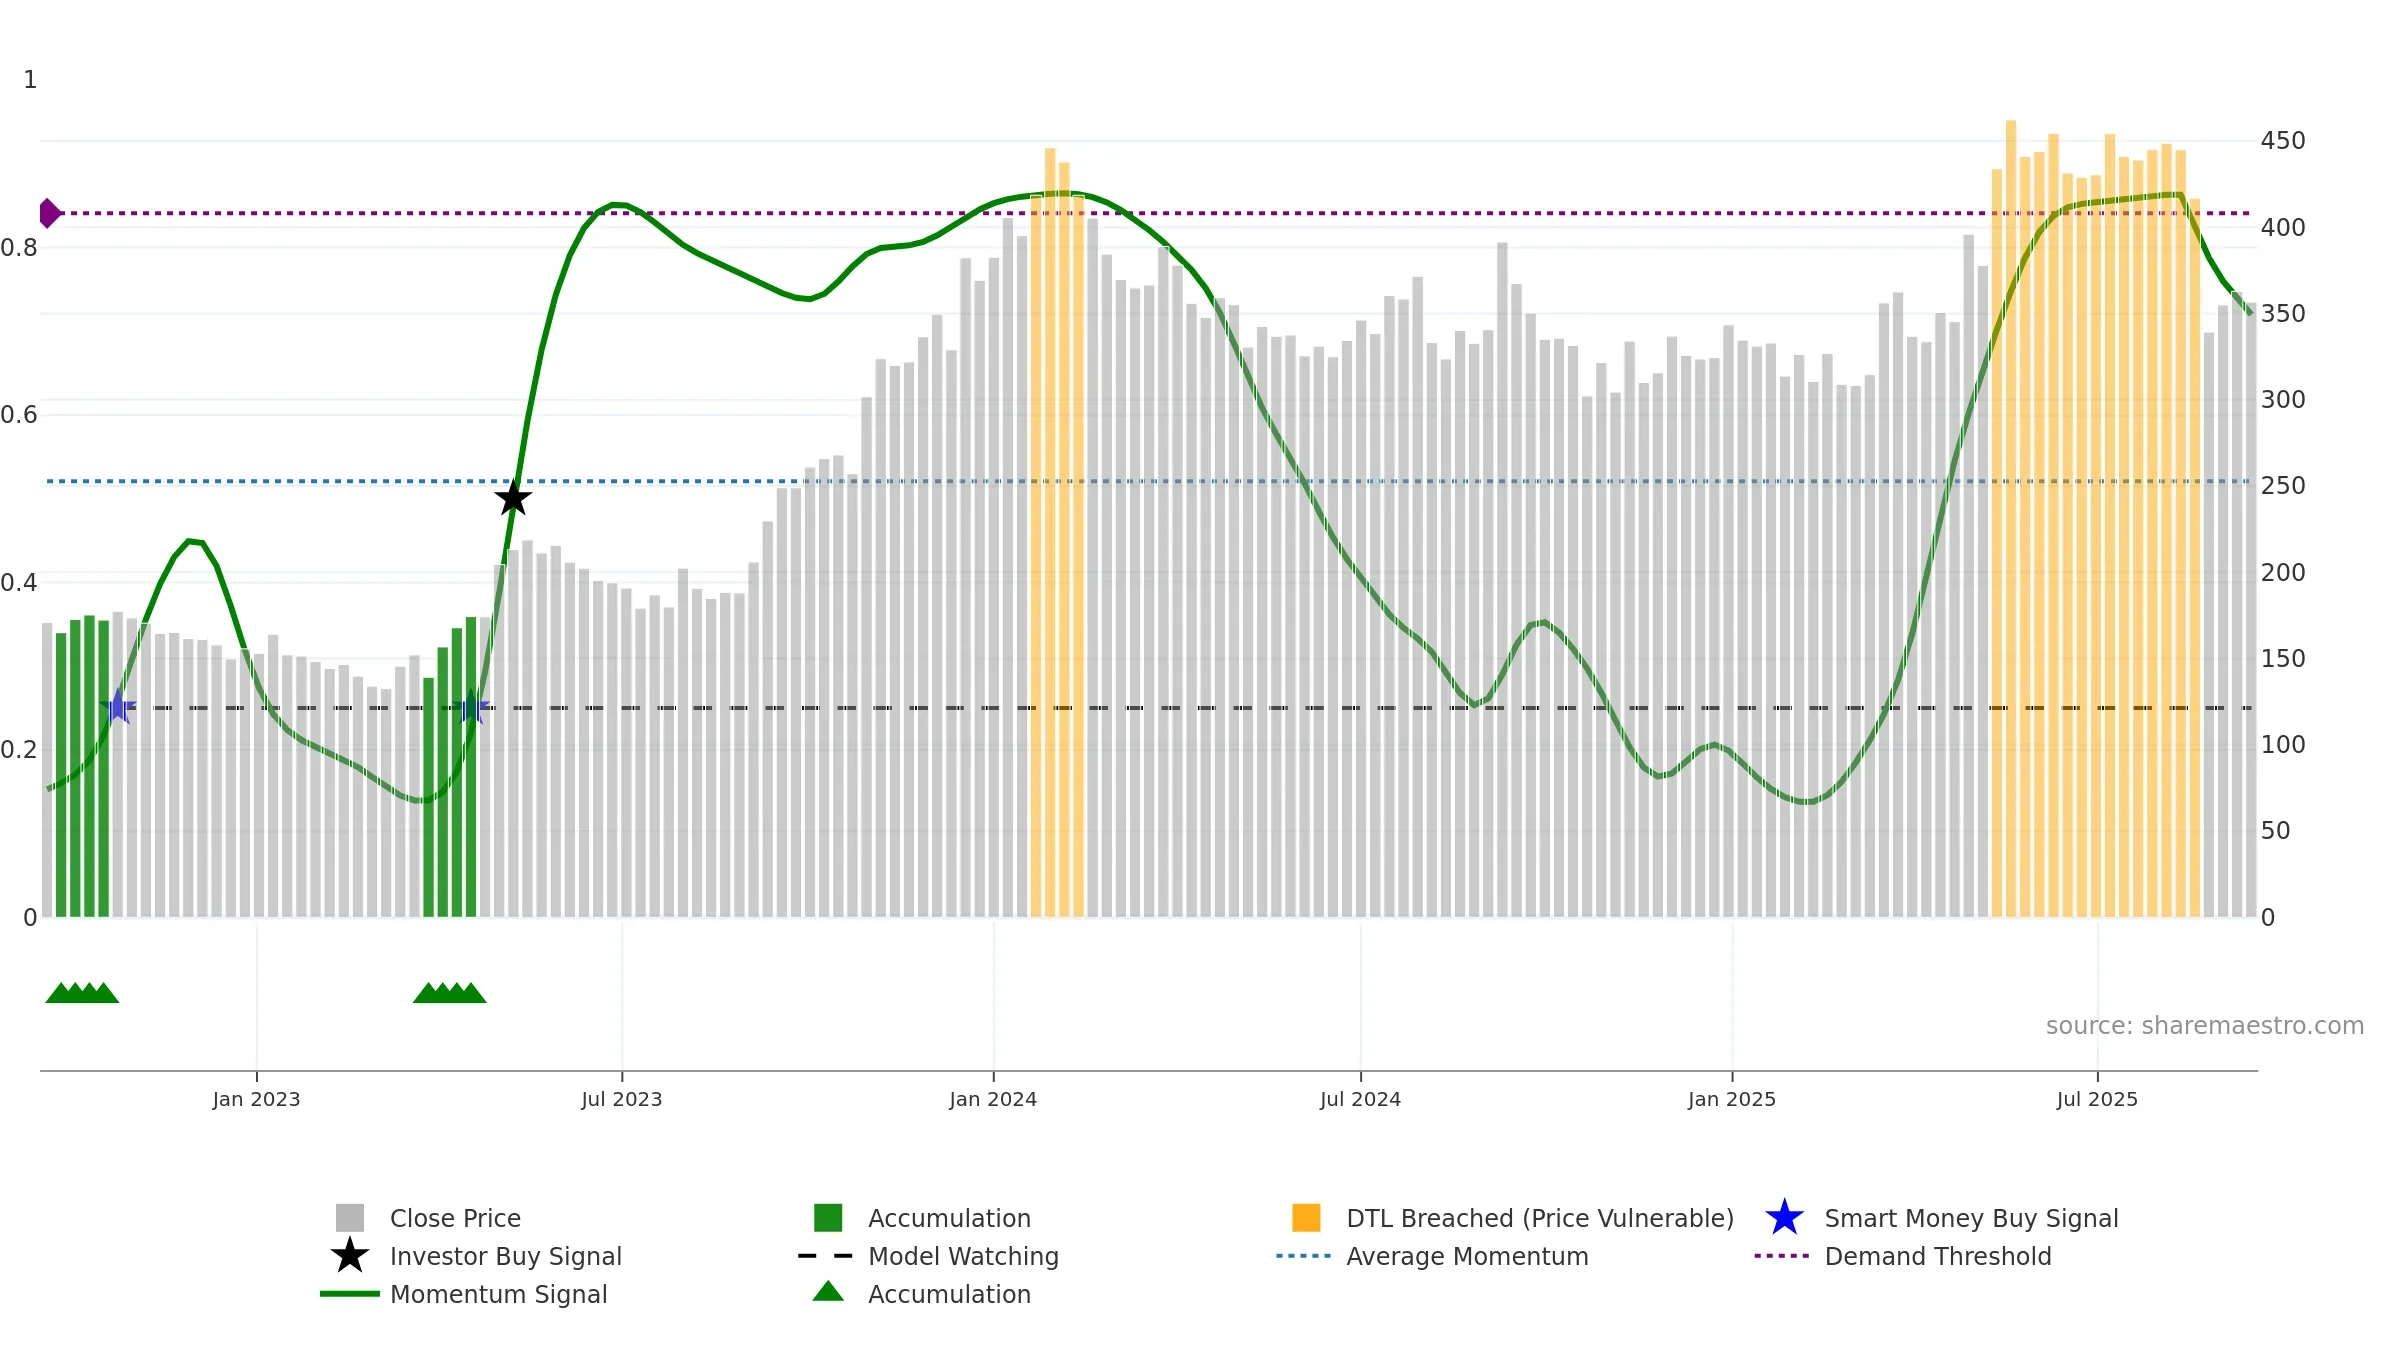
Weekly Report
Kilitch Drugs (India) Limited closed at 356.6500 (-0.57% WoW) . Data window ends Mon, 15 Sep 2025.
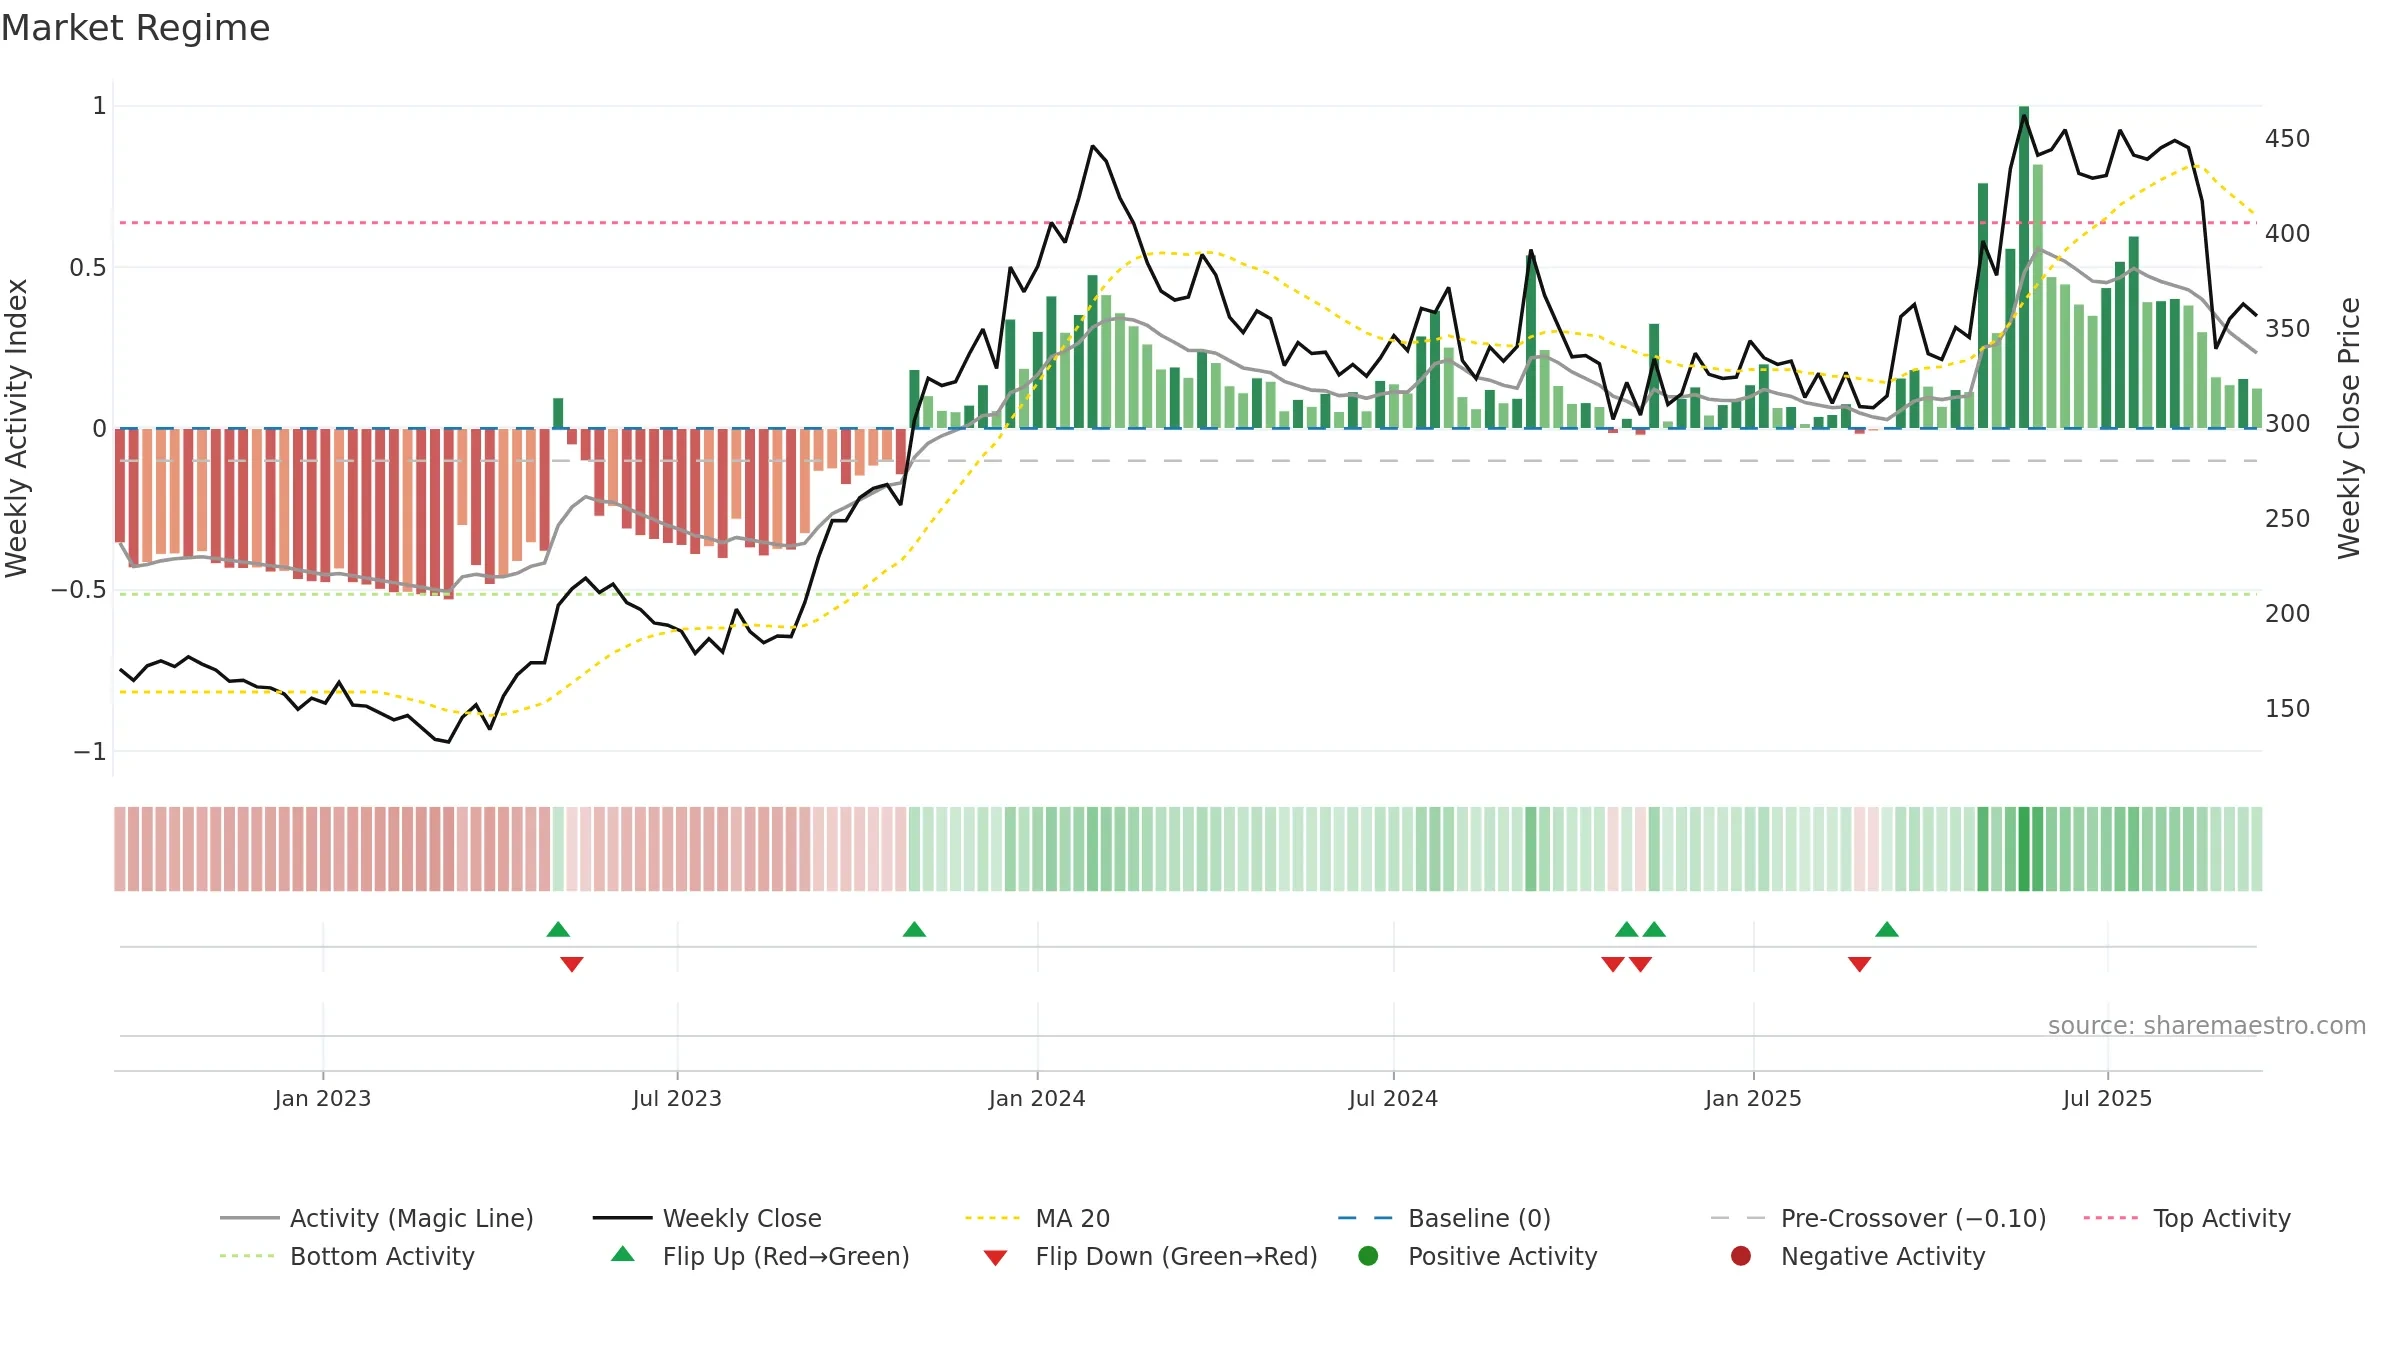
How to read this — Price slope is downward, indicating persistent supply pressure. Elevated weekly volatility increases whipsaw risk. Volume trend diverges from price — watch for fatigue or rotation. Returns are negatively correlated with volume — strength may come on lighter activity. Distance to baseline is narrowing — reverting closer to its fair-value track. Price sits below key averages, keeping pressure on the tape.
Down-slope argues for patience; rallies can fade sooner unless participation improves. Because liquidity isn’t confirming, prefer evidence of fresh demand before chasing moves.
Gauge maps the trend signal to a 0–100 scale.
How to read this — Gauge is elevated but momentum is rolling over; topping risk is rising.
Stay alert: protect gains or seek confirmation before adding risk.
Price is above fair value; upside may be capped without catalysts.
Conclusion
Negative setup. ★☆☆☆☆ confidence. Price window: -19. Trend: Uptrend at Risk; gauge 72. In combination, liquidity diverges from price.
- High-level but rolling over (topping risk)
- Momentum is weak/falling
- Price is not above key averages
- Liquidity diverges from price
Why: Price window -19.85% over 8w. Close is -20.53% below the prior-window high. Return volatility 5.02%. Volume trend rising. Liquidity divergence with price. Trend state uptrend at risk. High-regime (0.80–1.00) downticks 3/4 (75.0%) • Distributing. Momentum neutral and falling. Valuation limited upside without catalysts.
Tip: Most metrics include a hover tooltip where they appear in the report.