Nexam Chemical Holding AB (publ)
NEXAM STO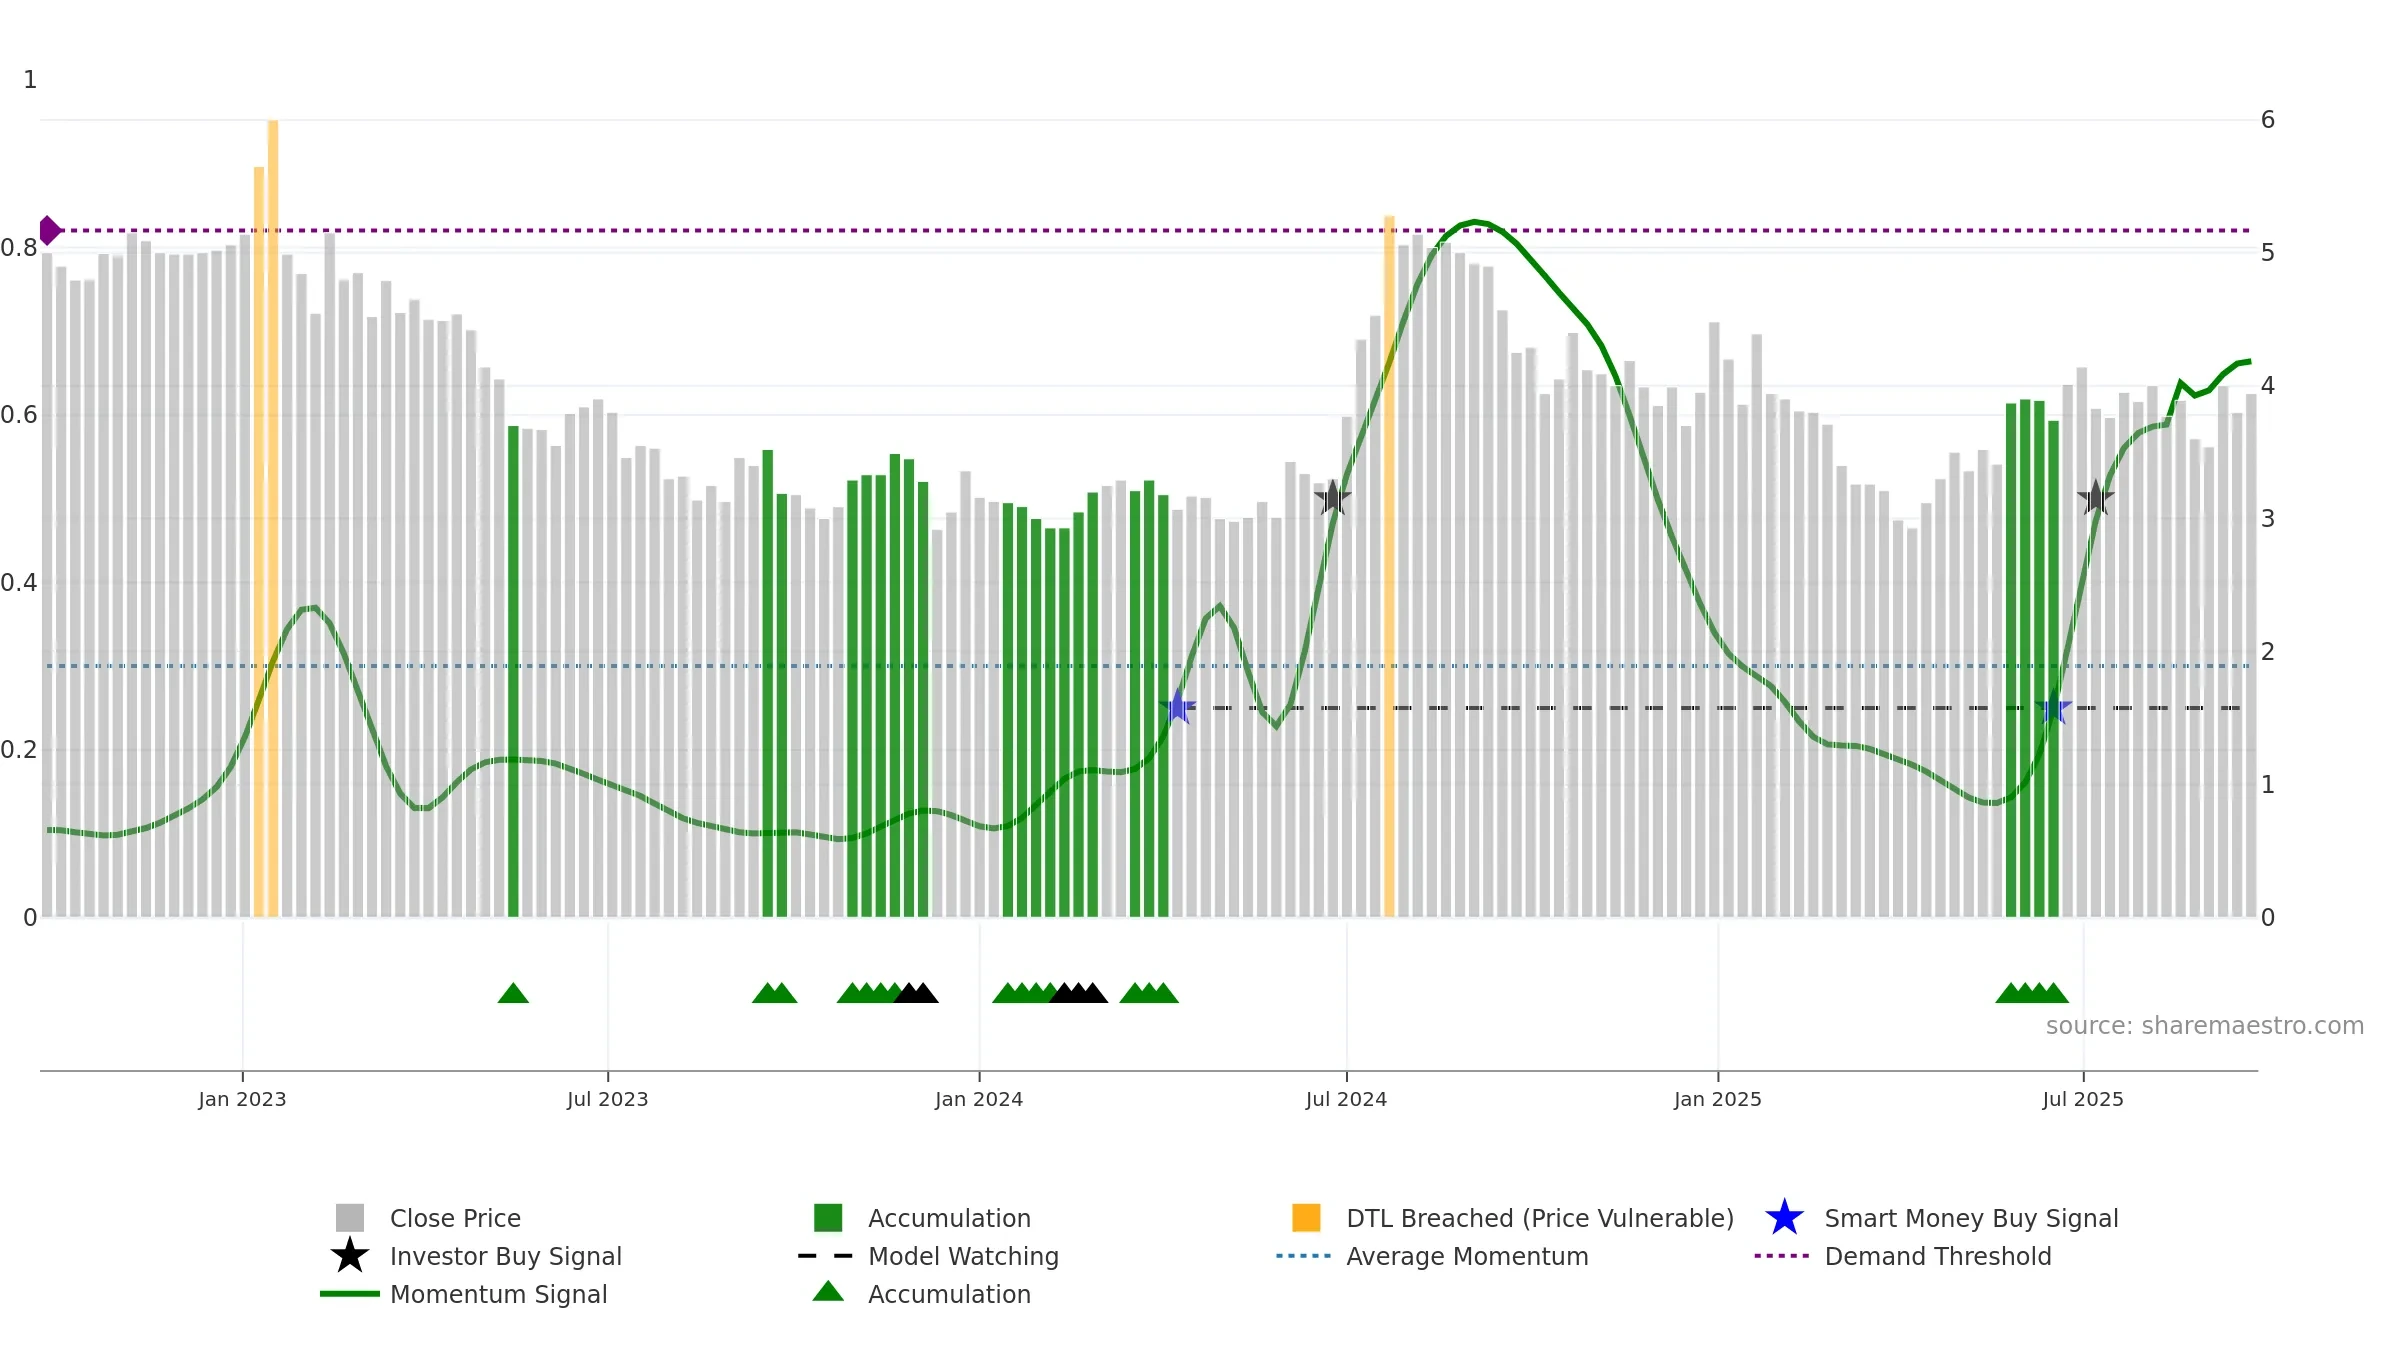
Weekly Report
Nexam Chemical Holding AB (publ) closed at 3.9400 (-1.01% WoW) . Data window ends Mon, 22 Sep 2025.
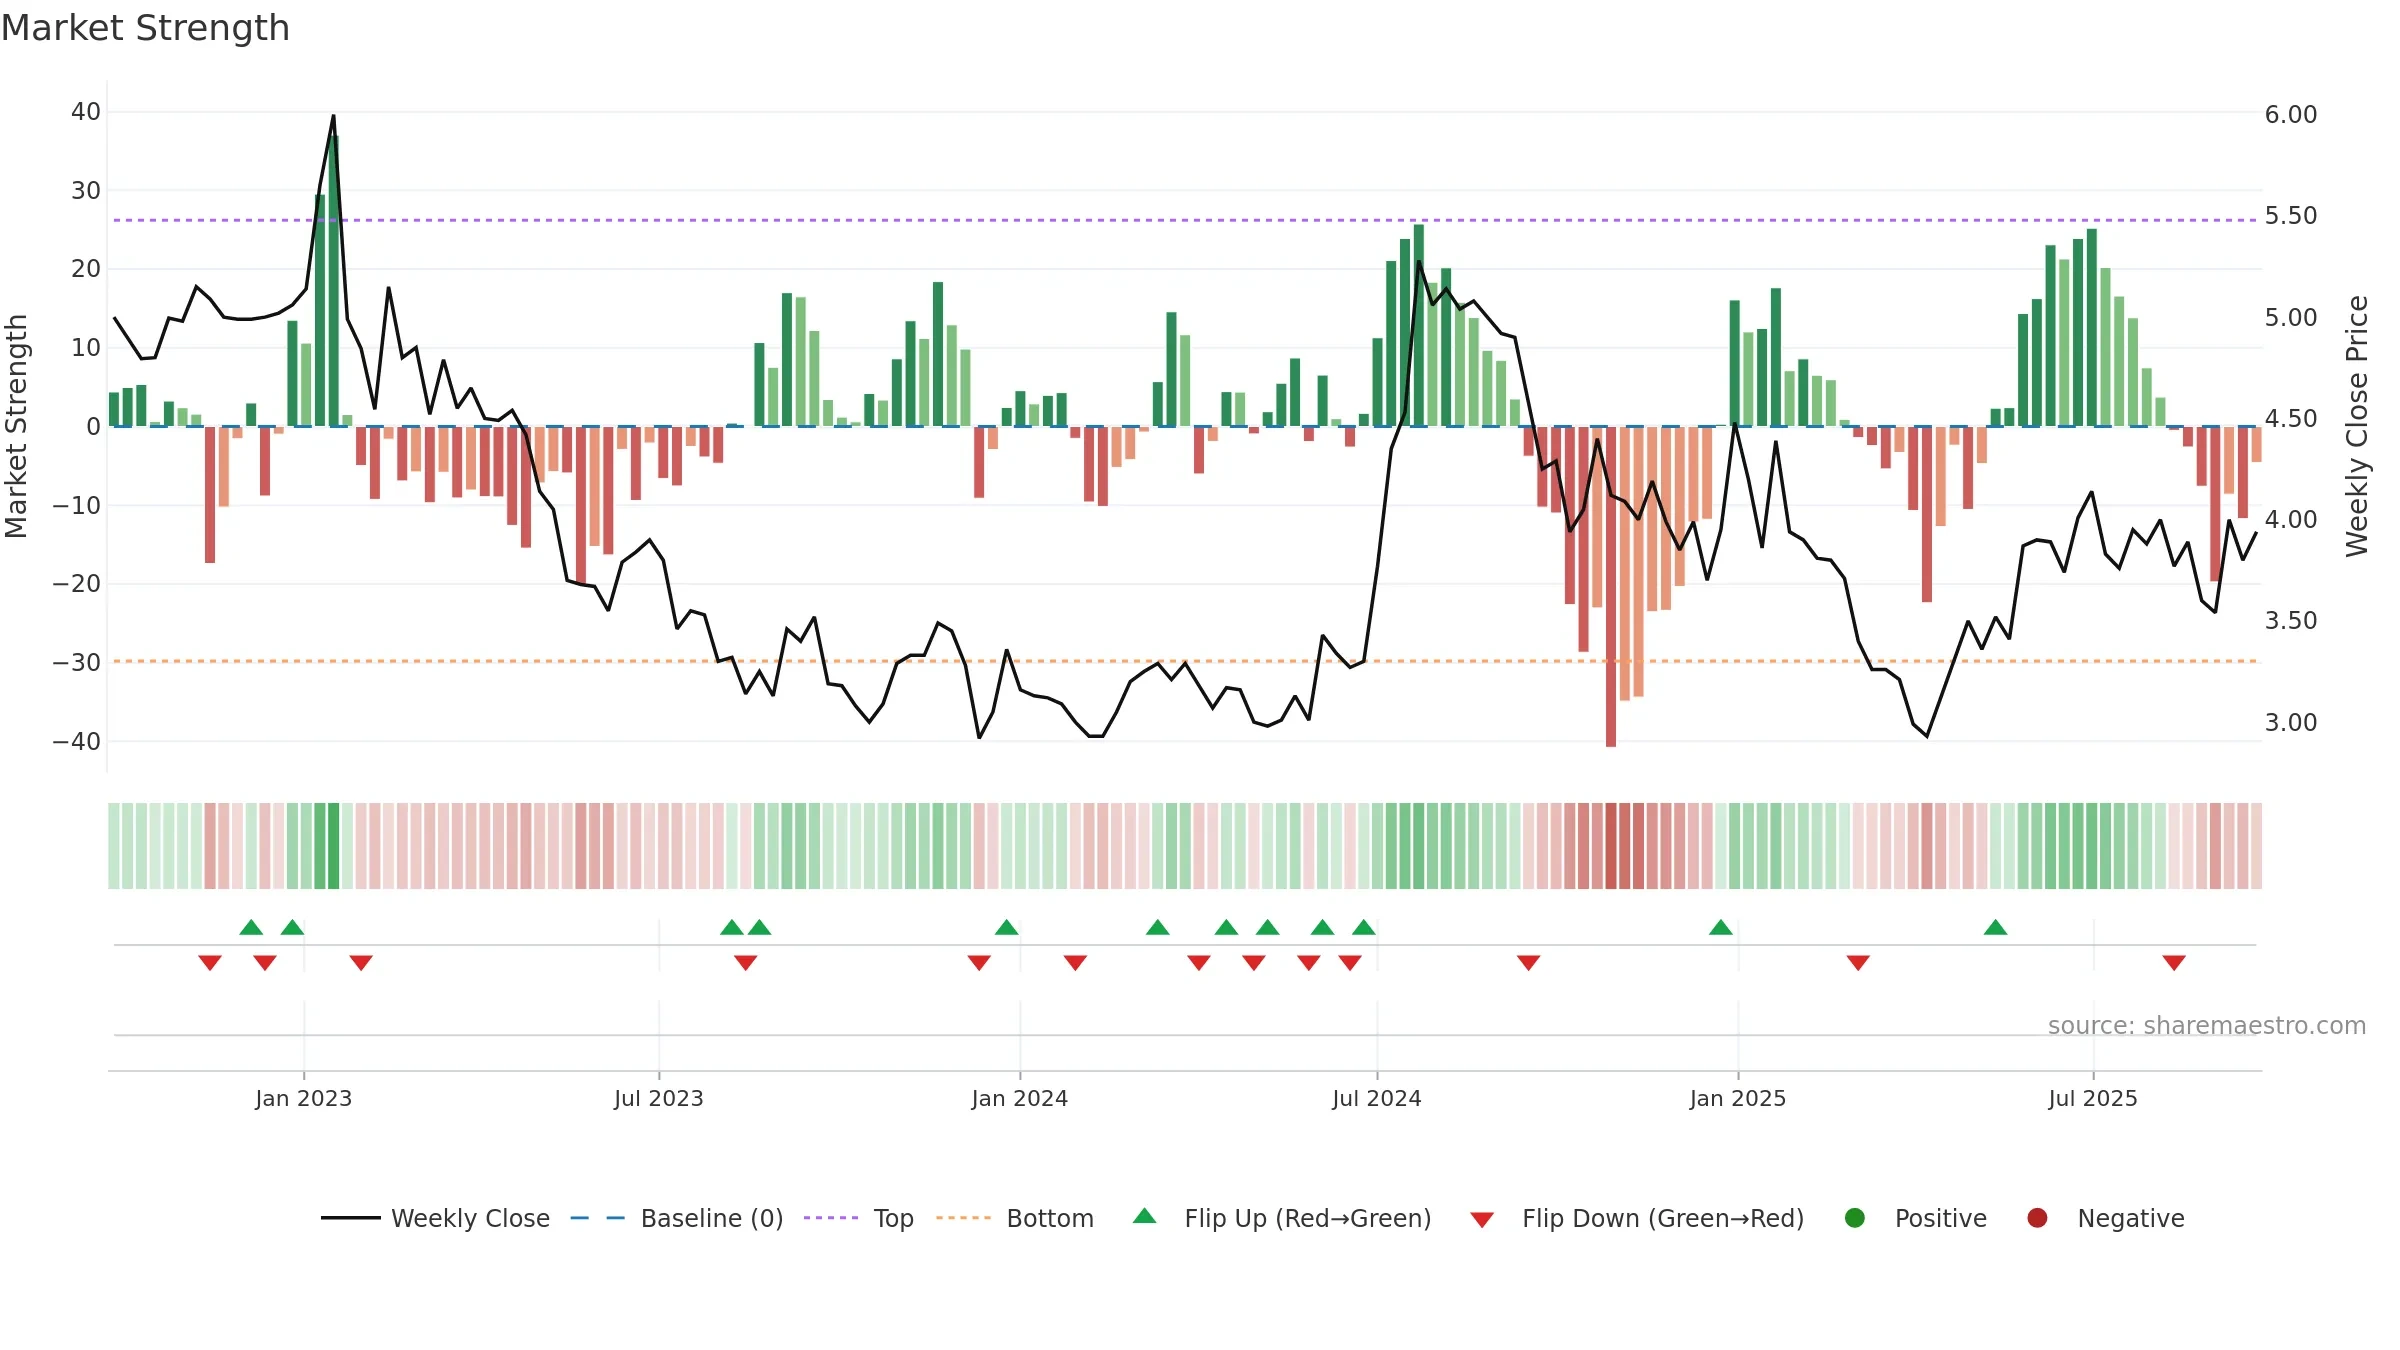
How to read this — Price slope is downward, indicating persistent supply pressure. Elevated weekly volatility increases whipsaw risk. Volume and price are moving in the same direction — a constructive confirmation. Fresh short-term crossover improves near-term tone. Price holds above key averages, indicating constructive participation.
Down-slope argues for patience; rallies can fade sooner unless participation improves.
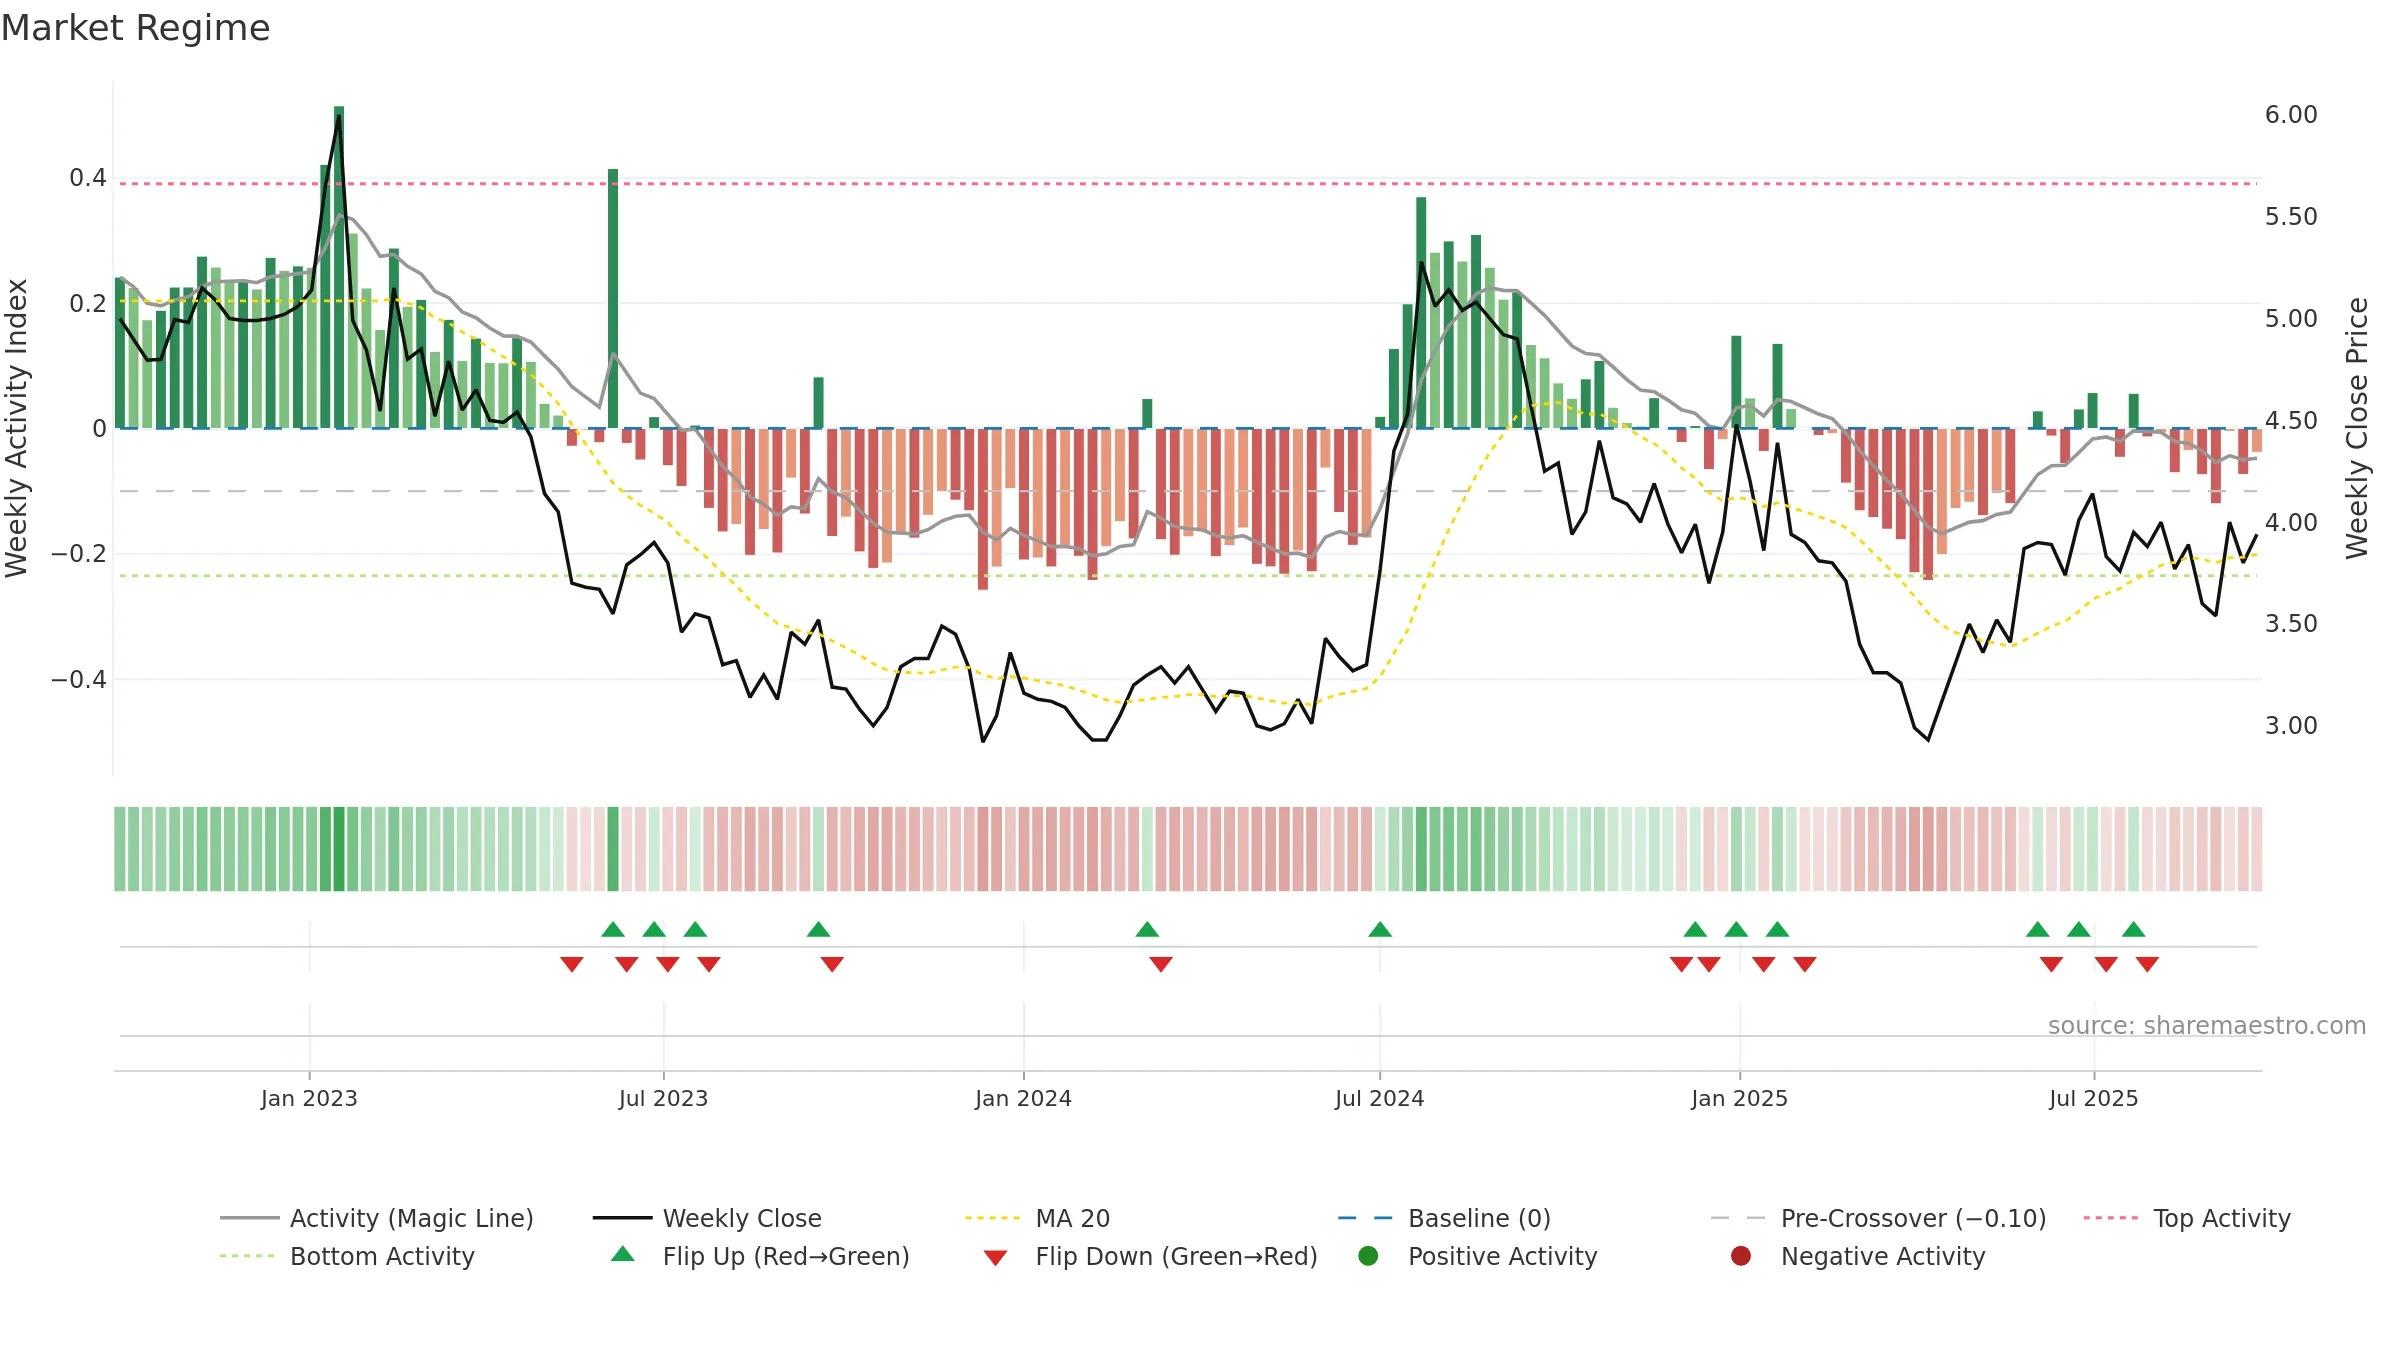
Gauge maps the trend signal to a 0–100 scale.
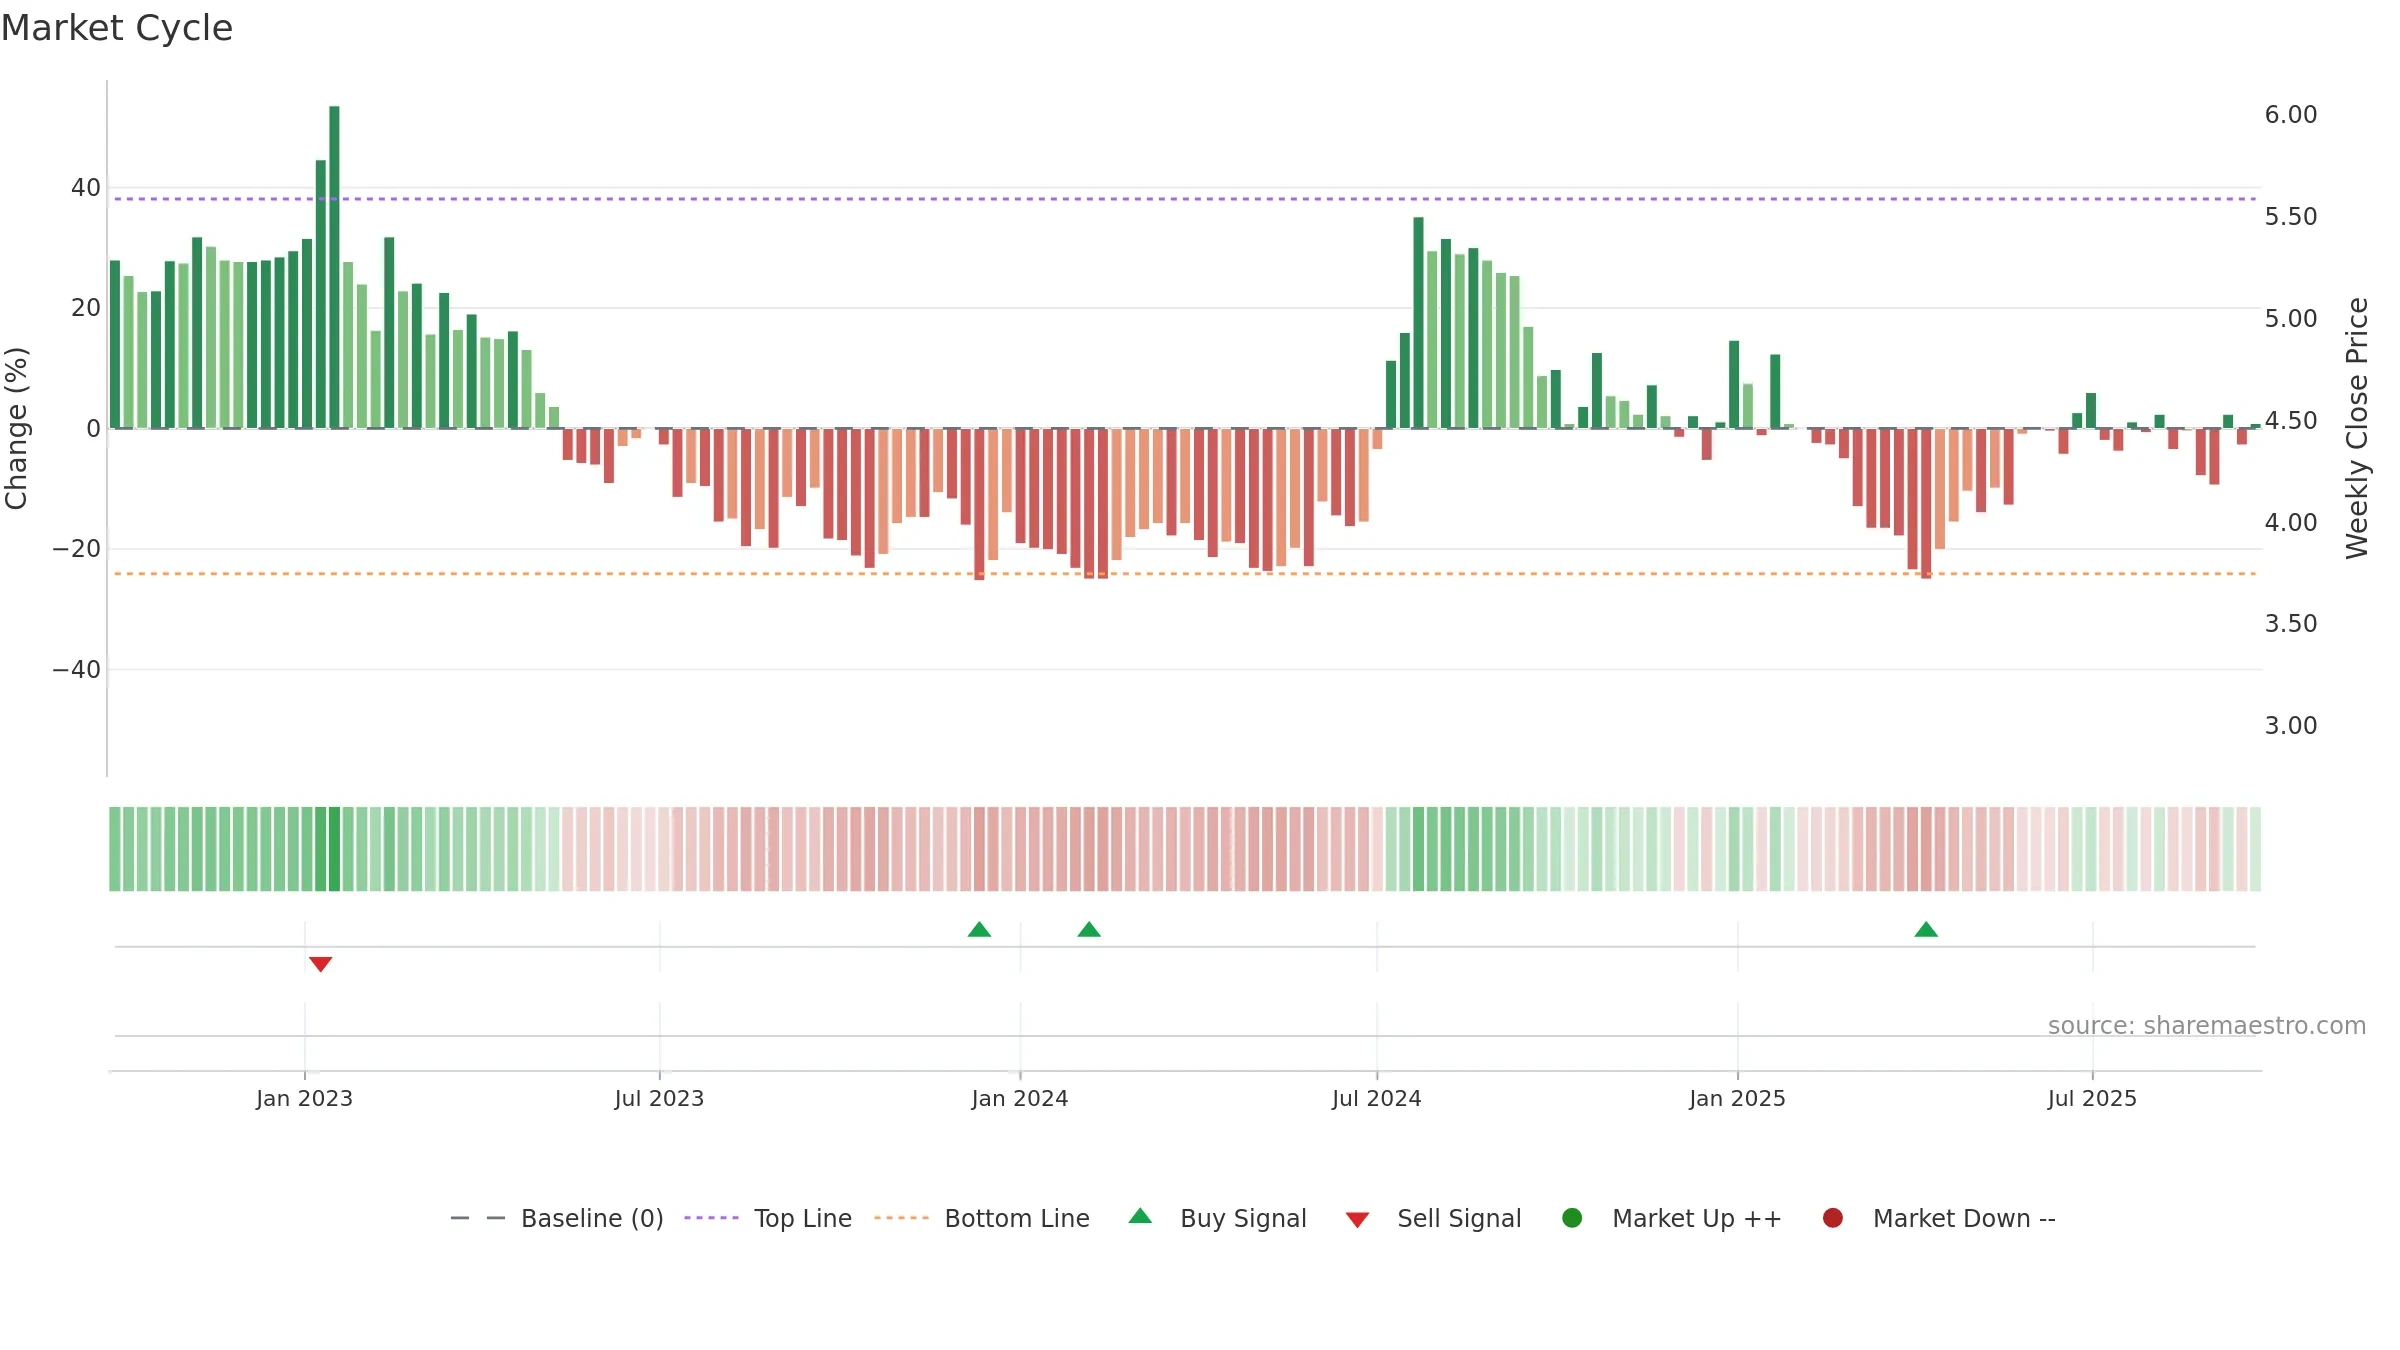
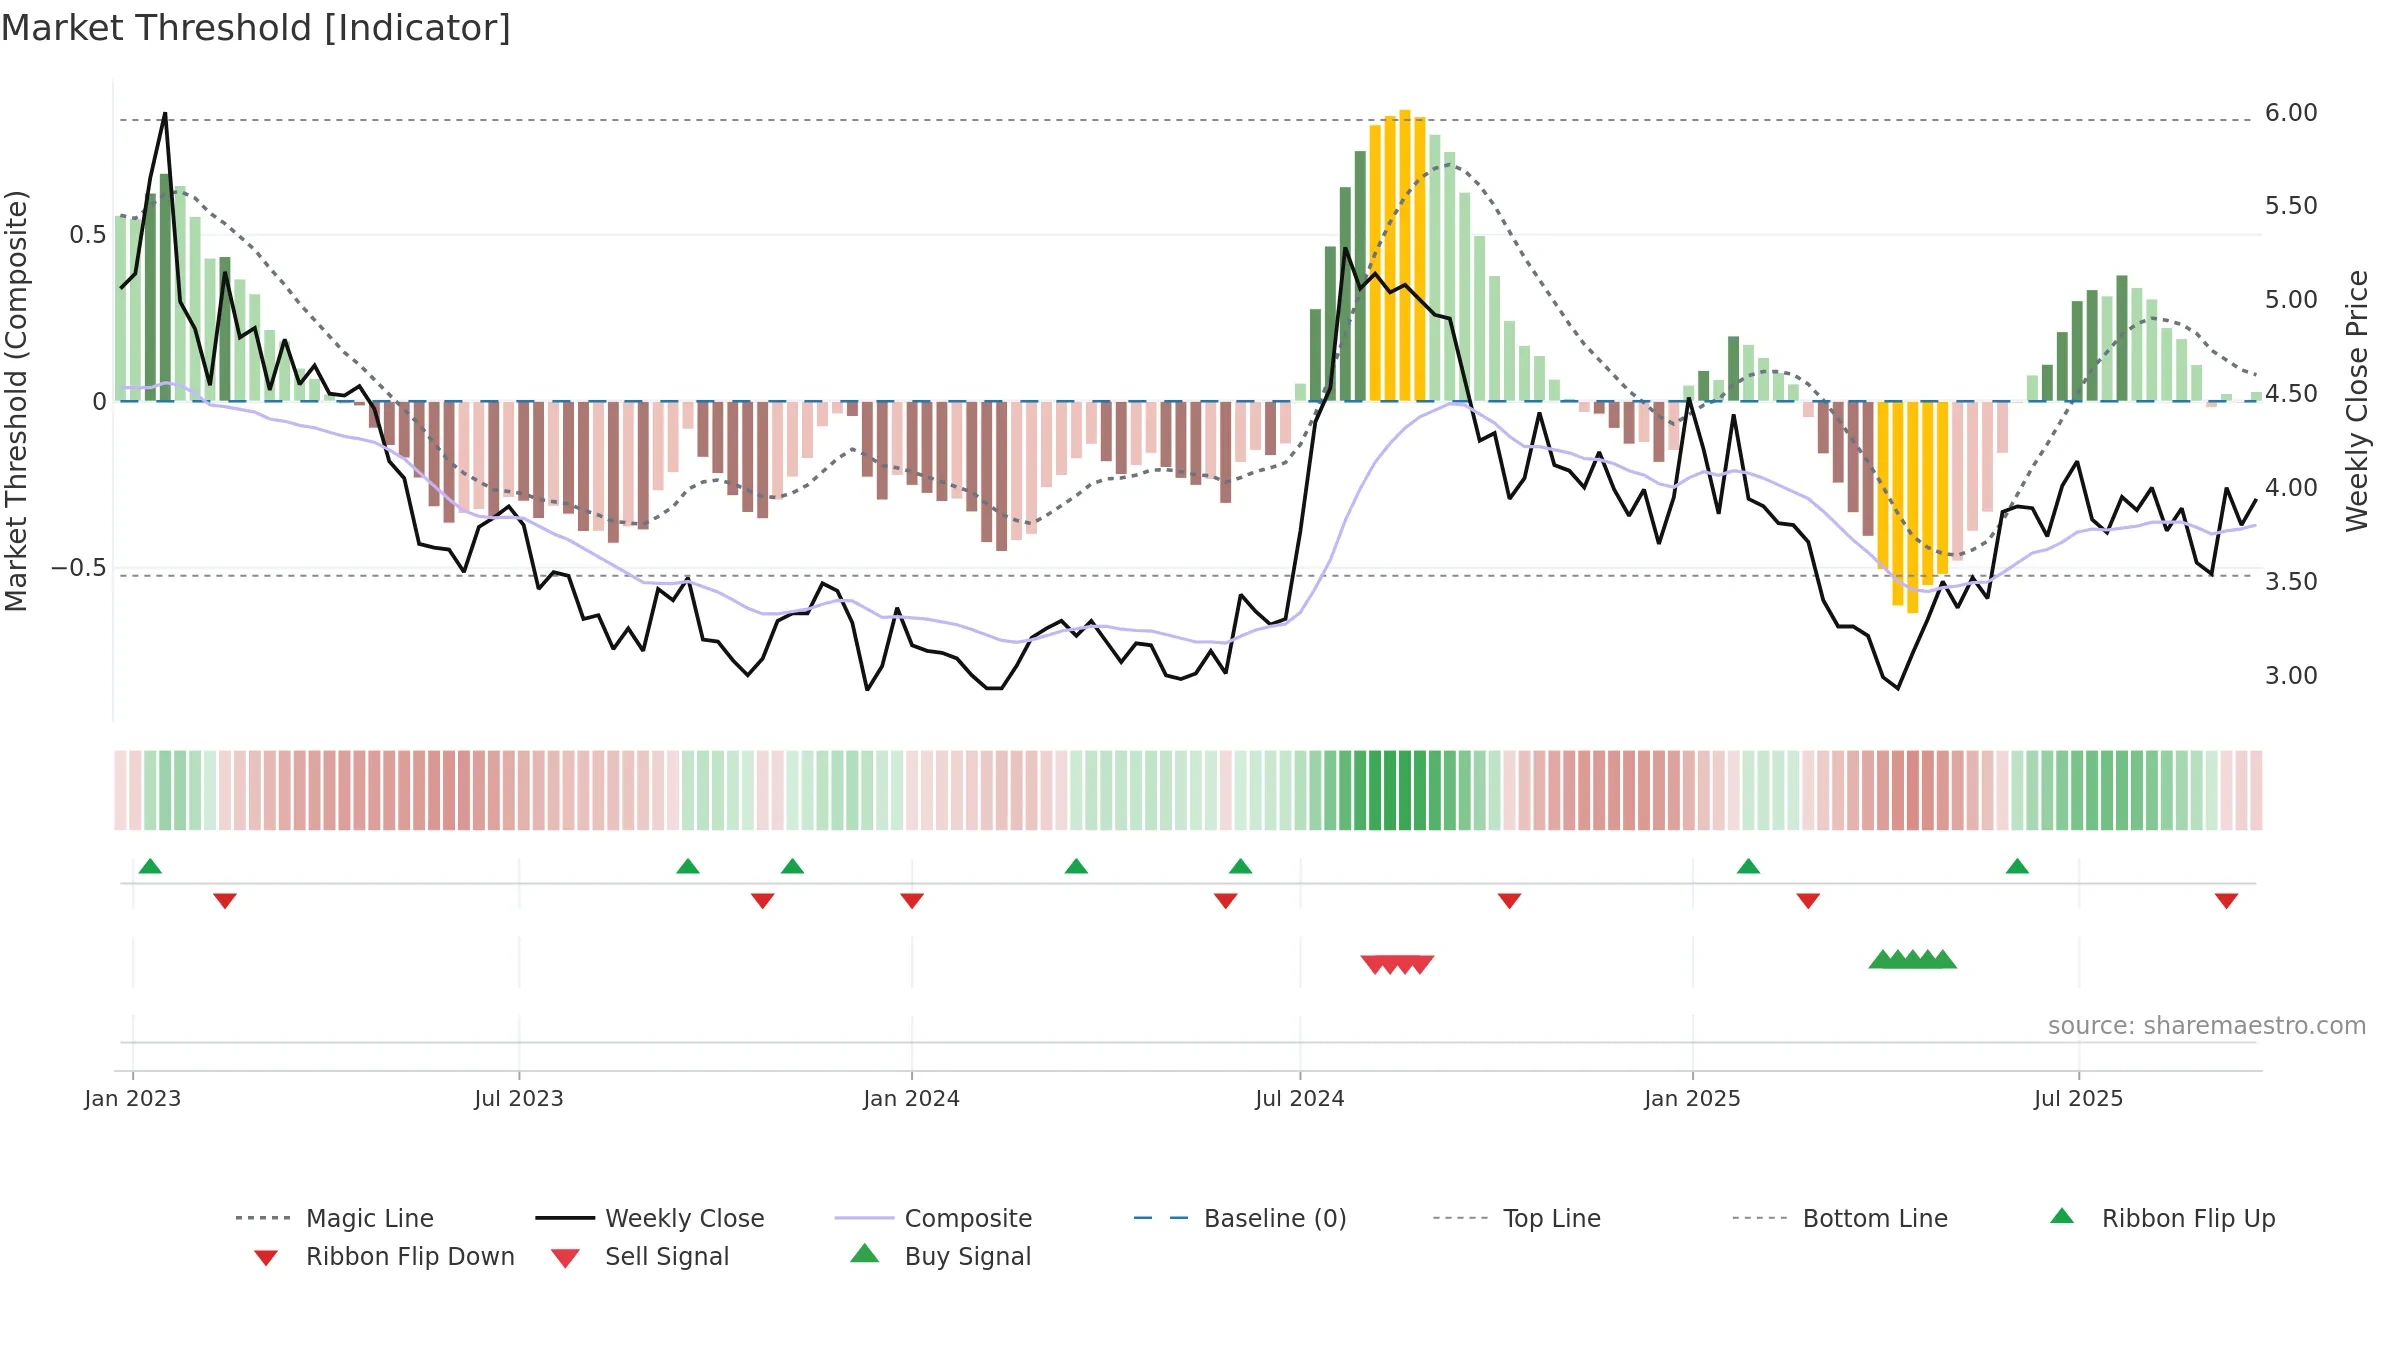
How to read this — Range-bound conditions; conviction is limited until a break or acceleration emerges.
Wait for a directional break or improving acceleration.
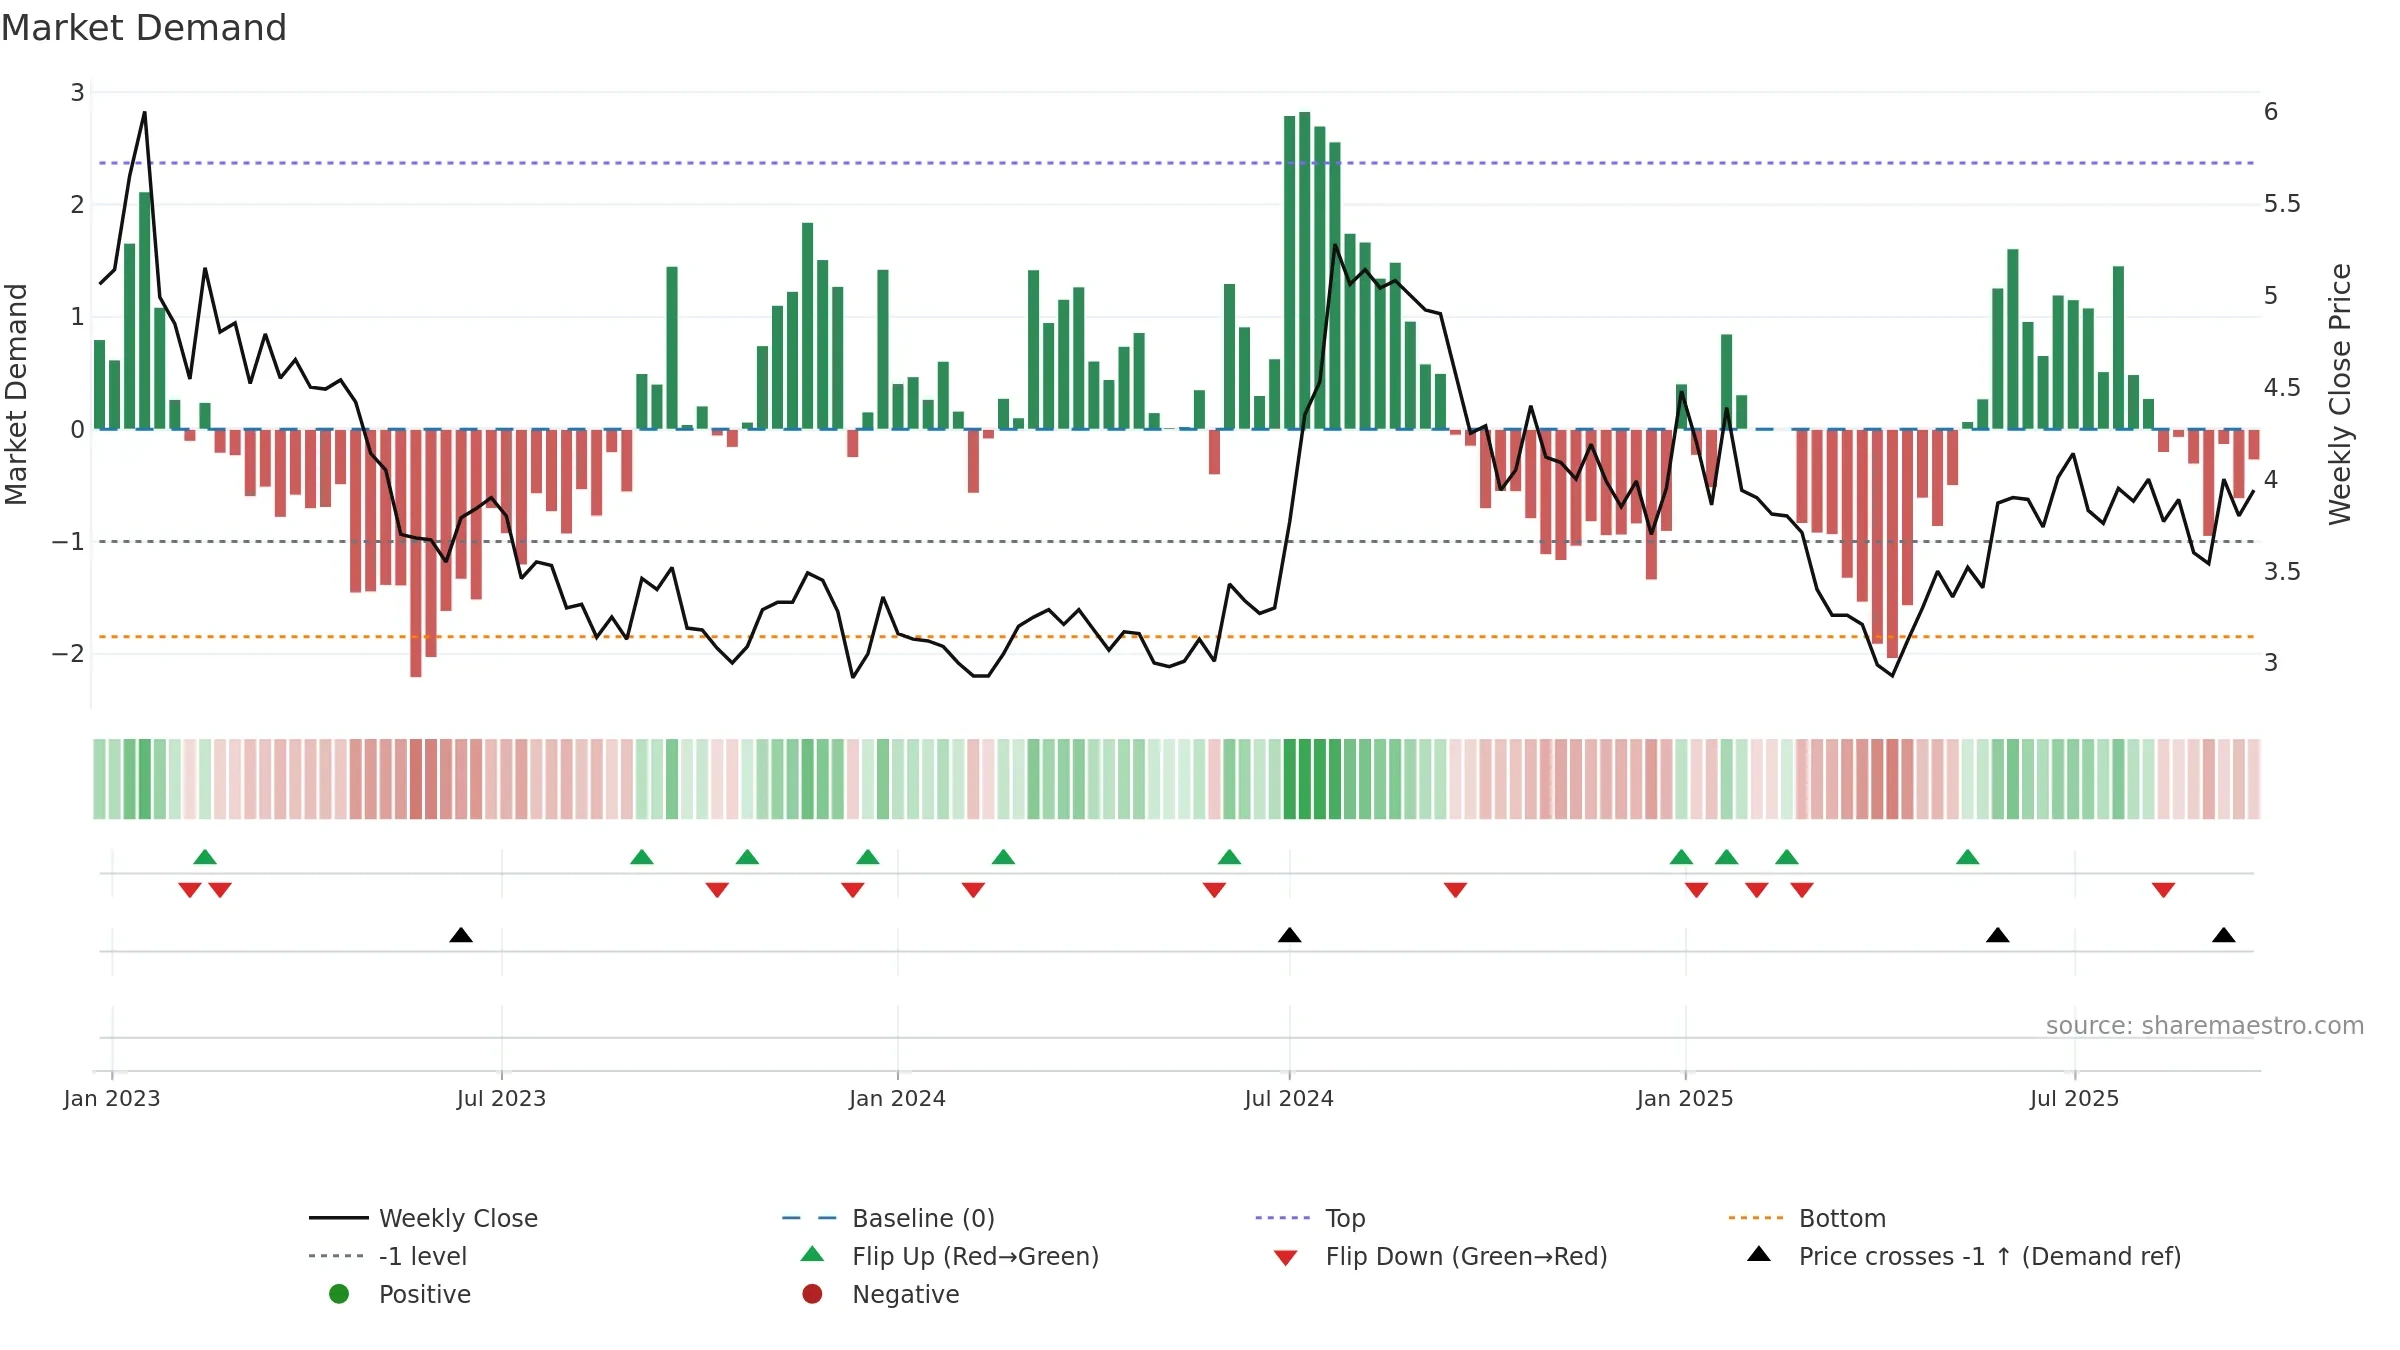
Price is above fair value; upside may be capped without catalysts.
Conclusion
Positive setup. ★★★★☆ confidence. Price window: -1. Trend: Range / Neutral; gauge 66. In combination, liquidity confirms the move.
- Momentum is bullish and rising
- Price holds above 8w & 26w averages
- Liquidity confirms the price trend
- High return volatility raises whipsaw risk
- Negative multi-week performance
Why: Price window -1.50% over 8w. Close is -1.50% below the prior-window high. Return volatility 4.43%. Volume trend falling. Liquidity convergence with price. Trend state range / neutral. 4–8w crossover bullish. Momentum bullish and rising. Valuation limited upside without catalysts.
Tip: Most metrics include a hover tooltip where they appear in the report.