Guangzhou Hexin Instrument Co.,Ltd.
688622 SHA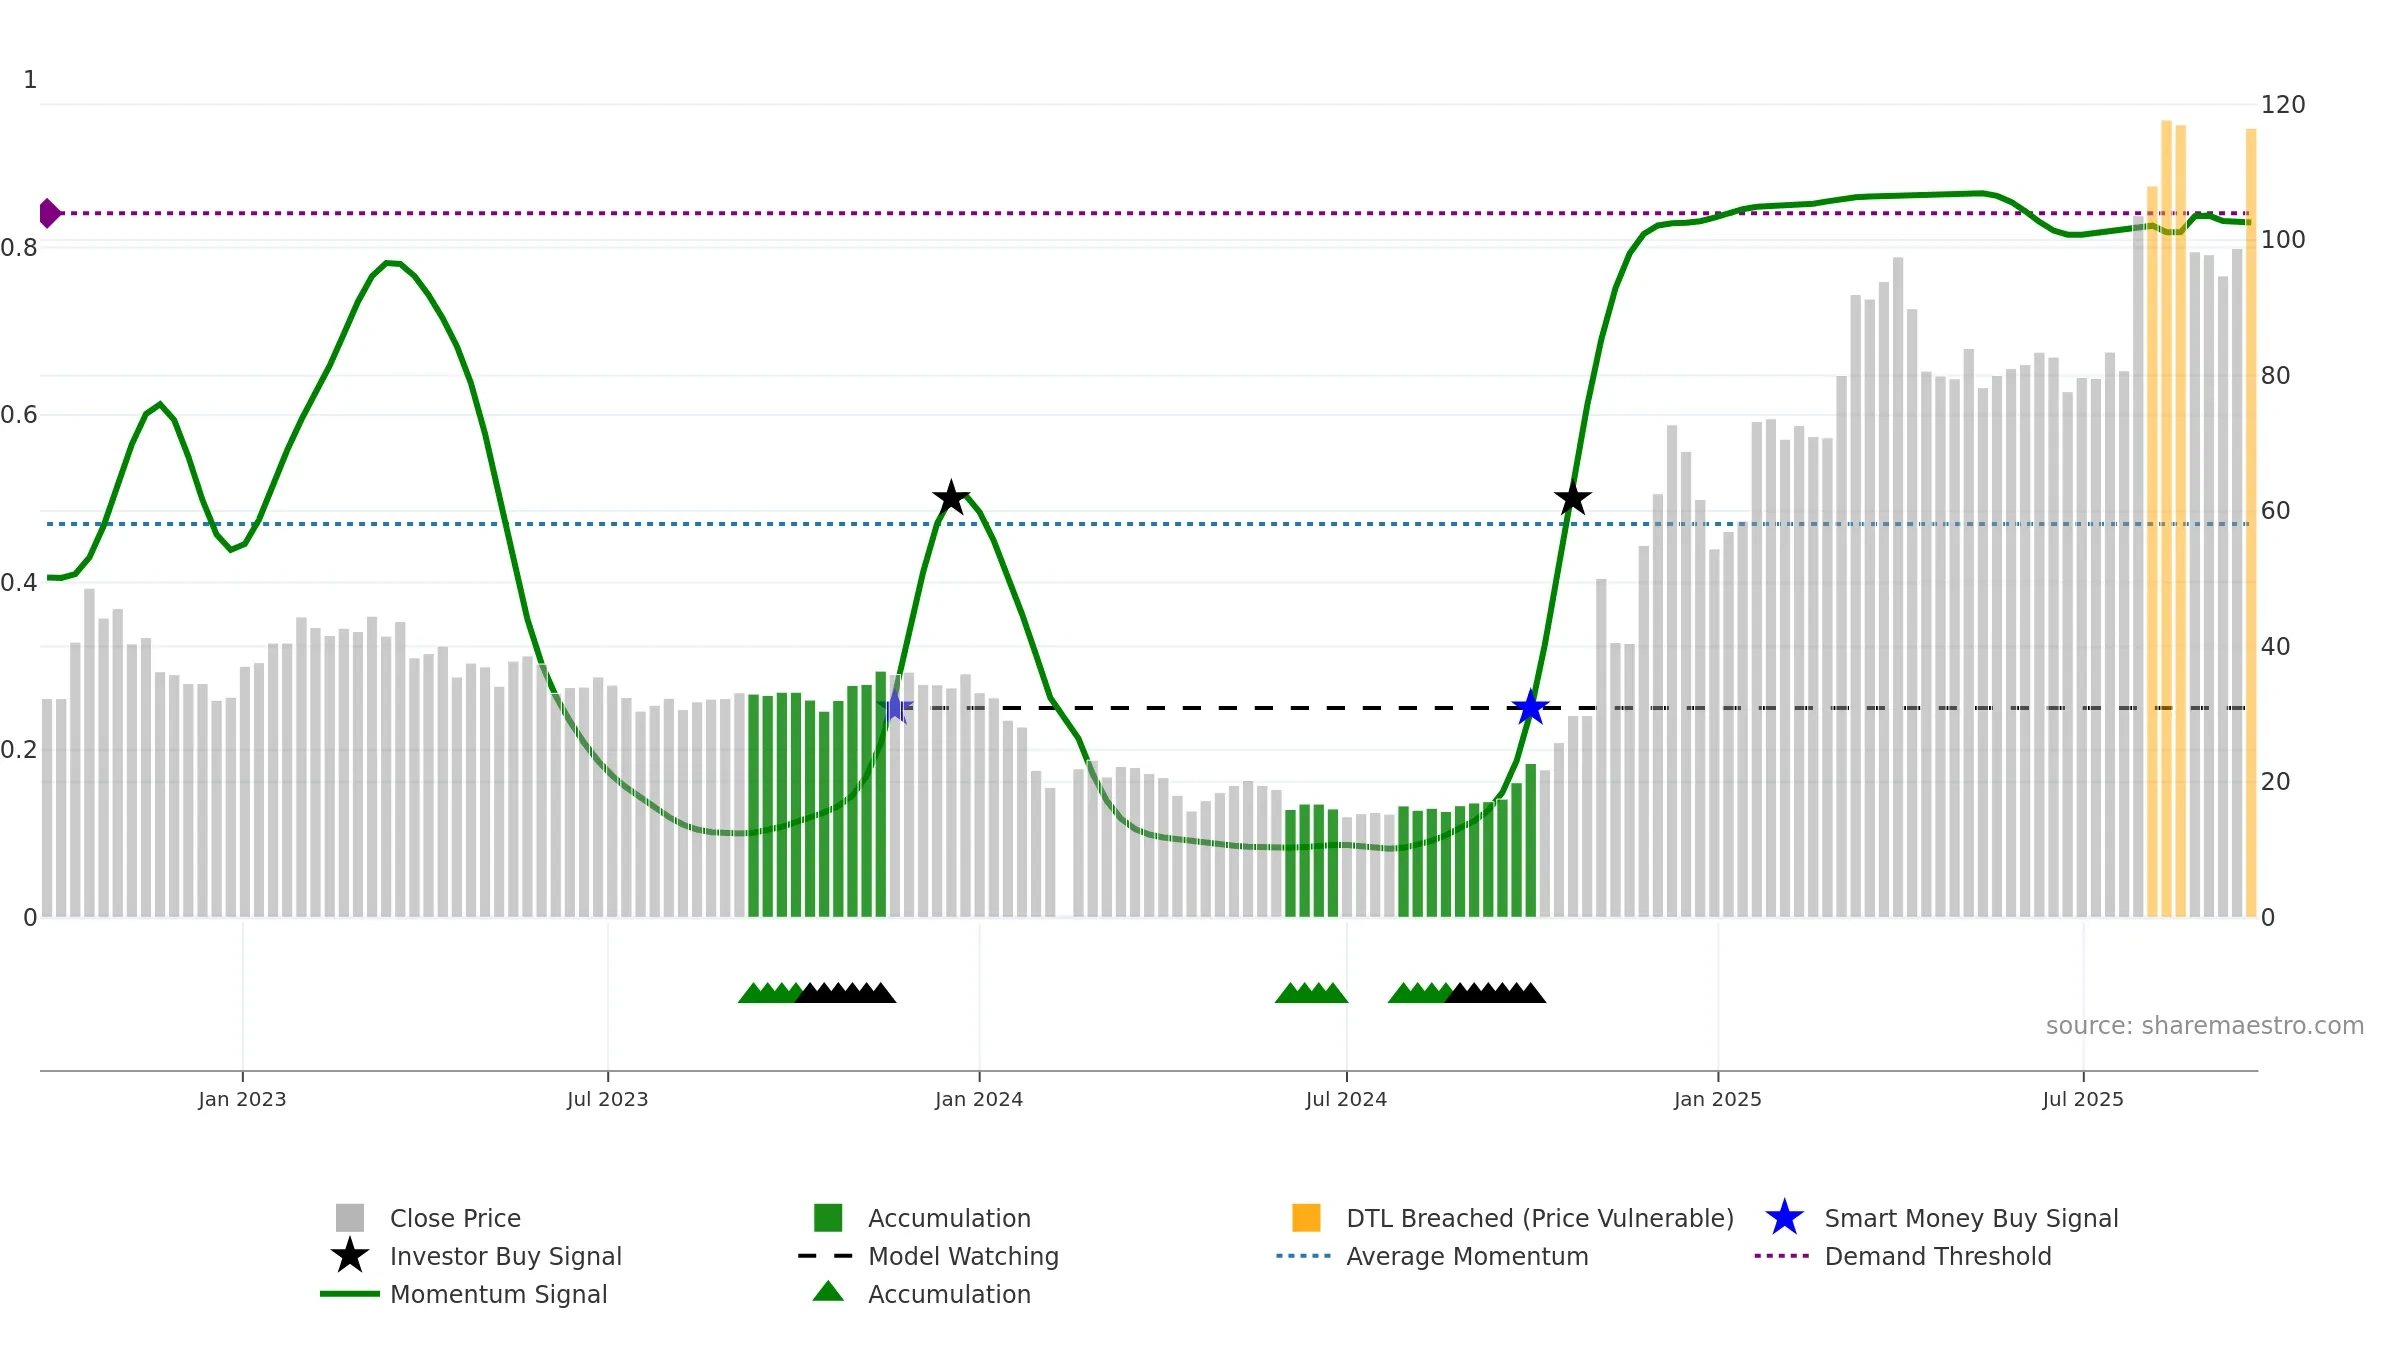
Weekly Summary
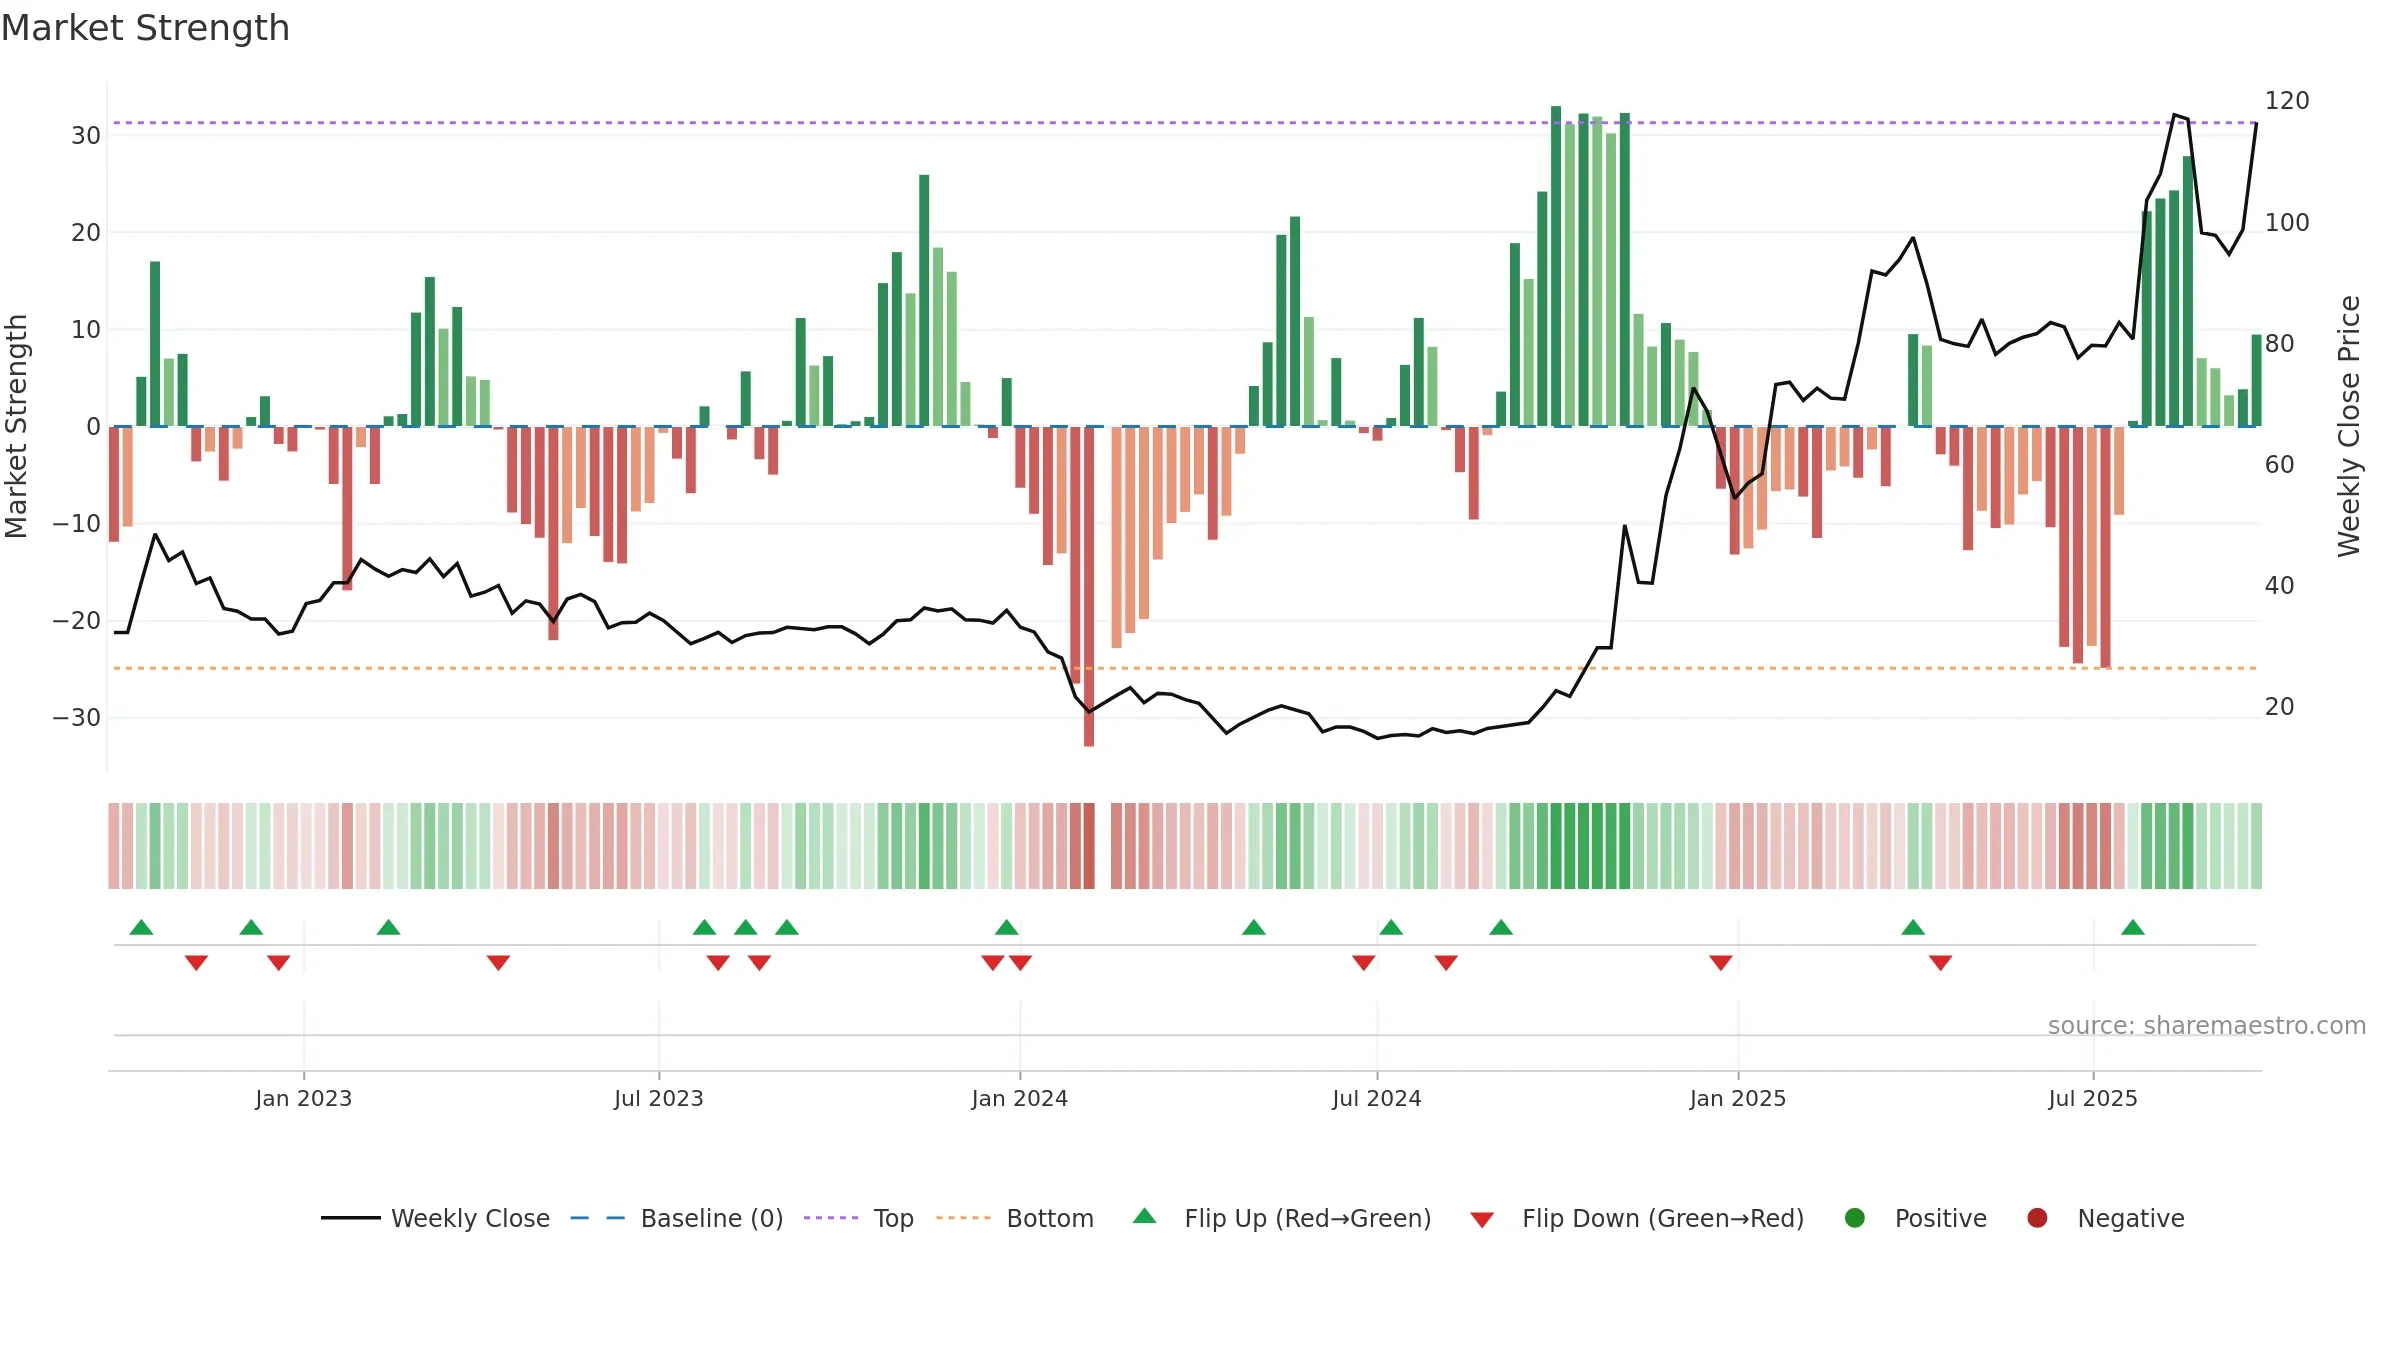
Guangzhou Hexin Instrument Co.,Ltd. closed at 116.5000 (3.10% WoW) . Data window ends Mon, 22 Sep 2025.
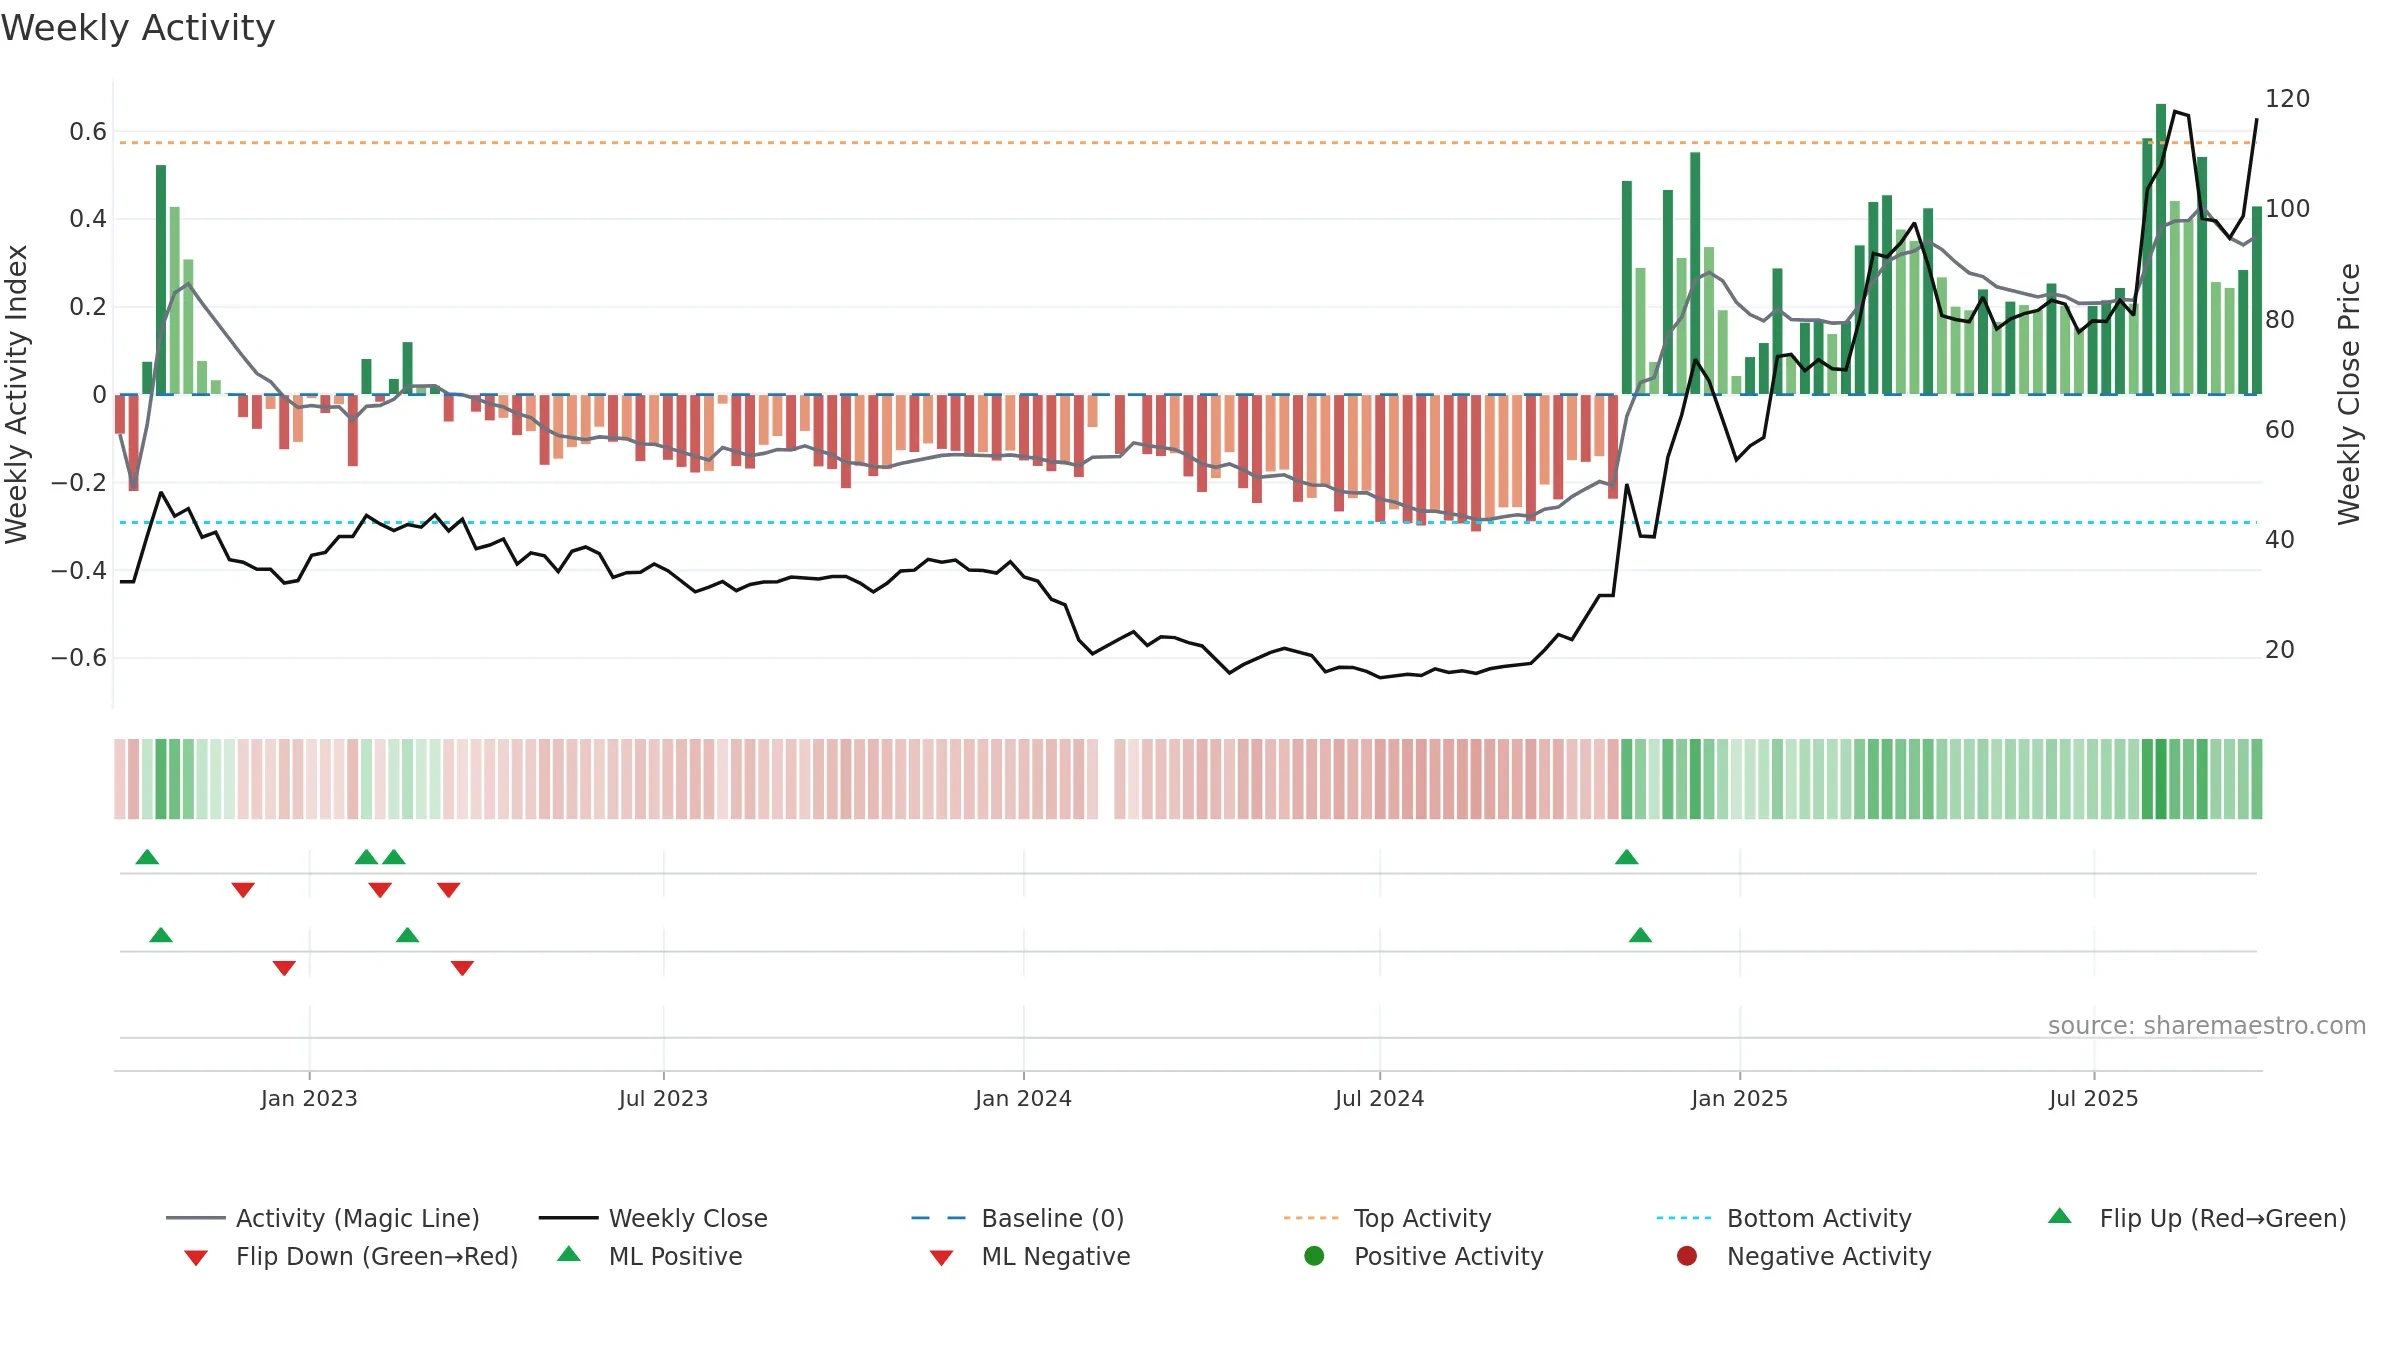
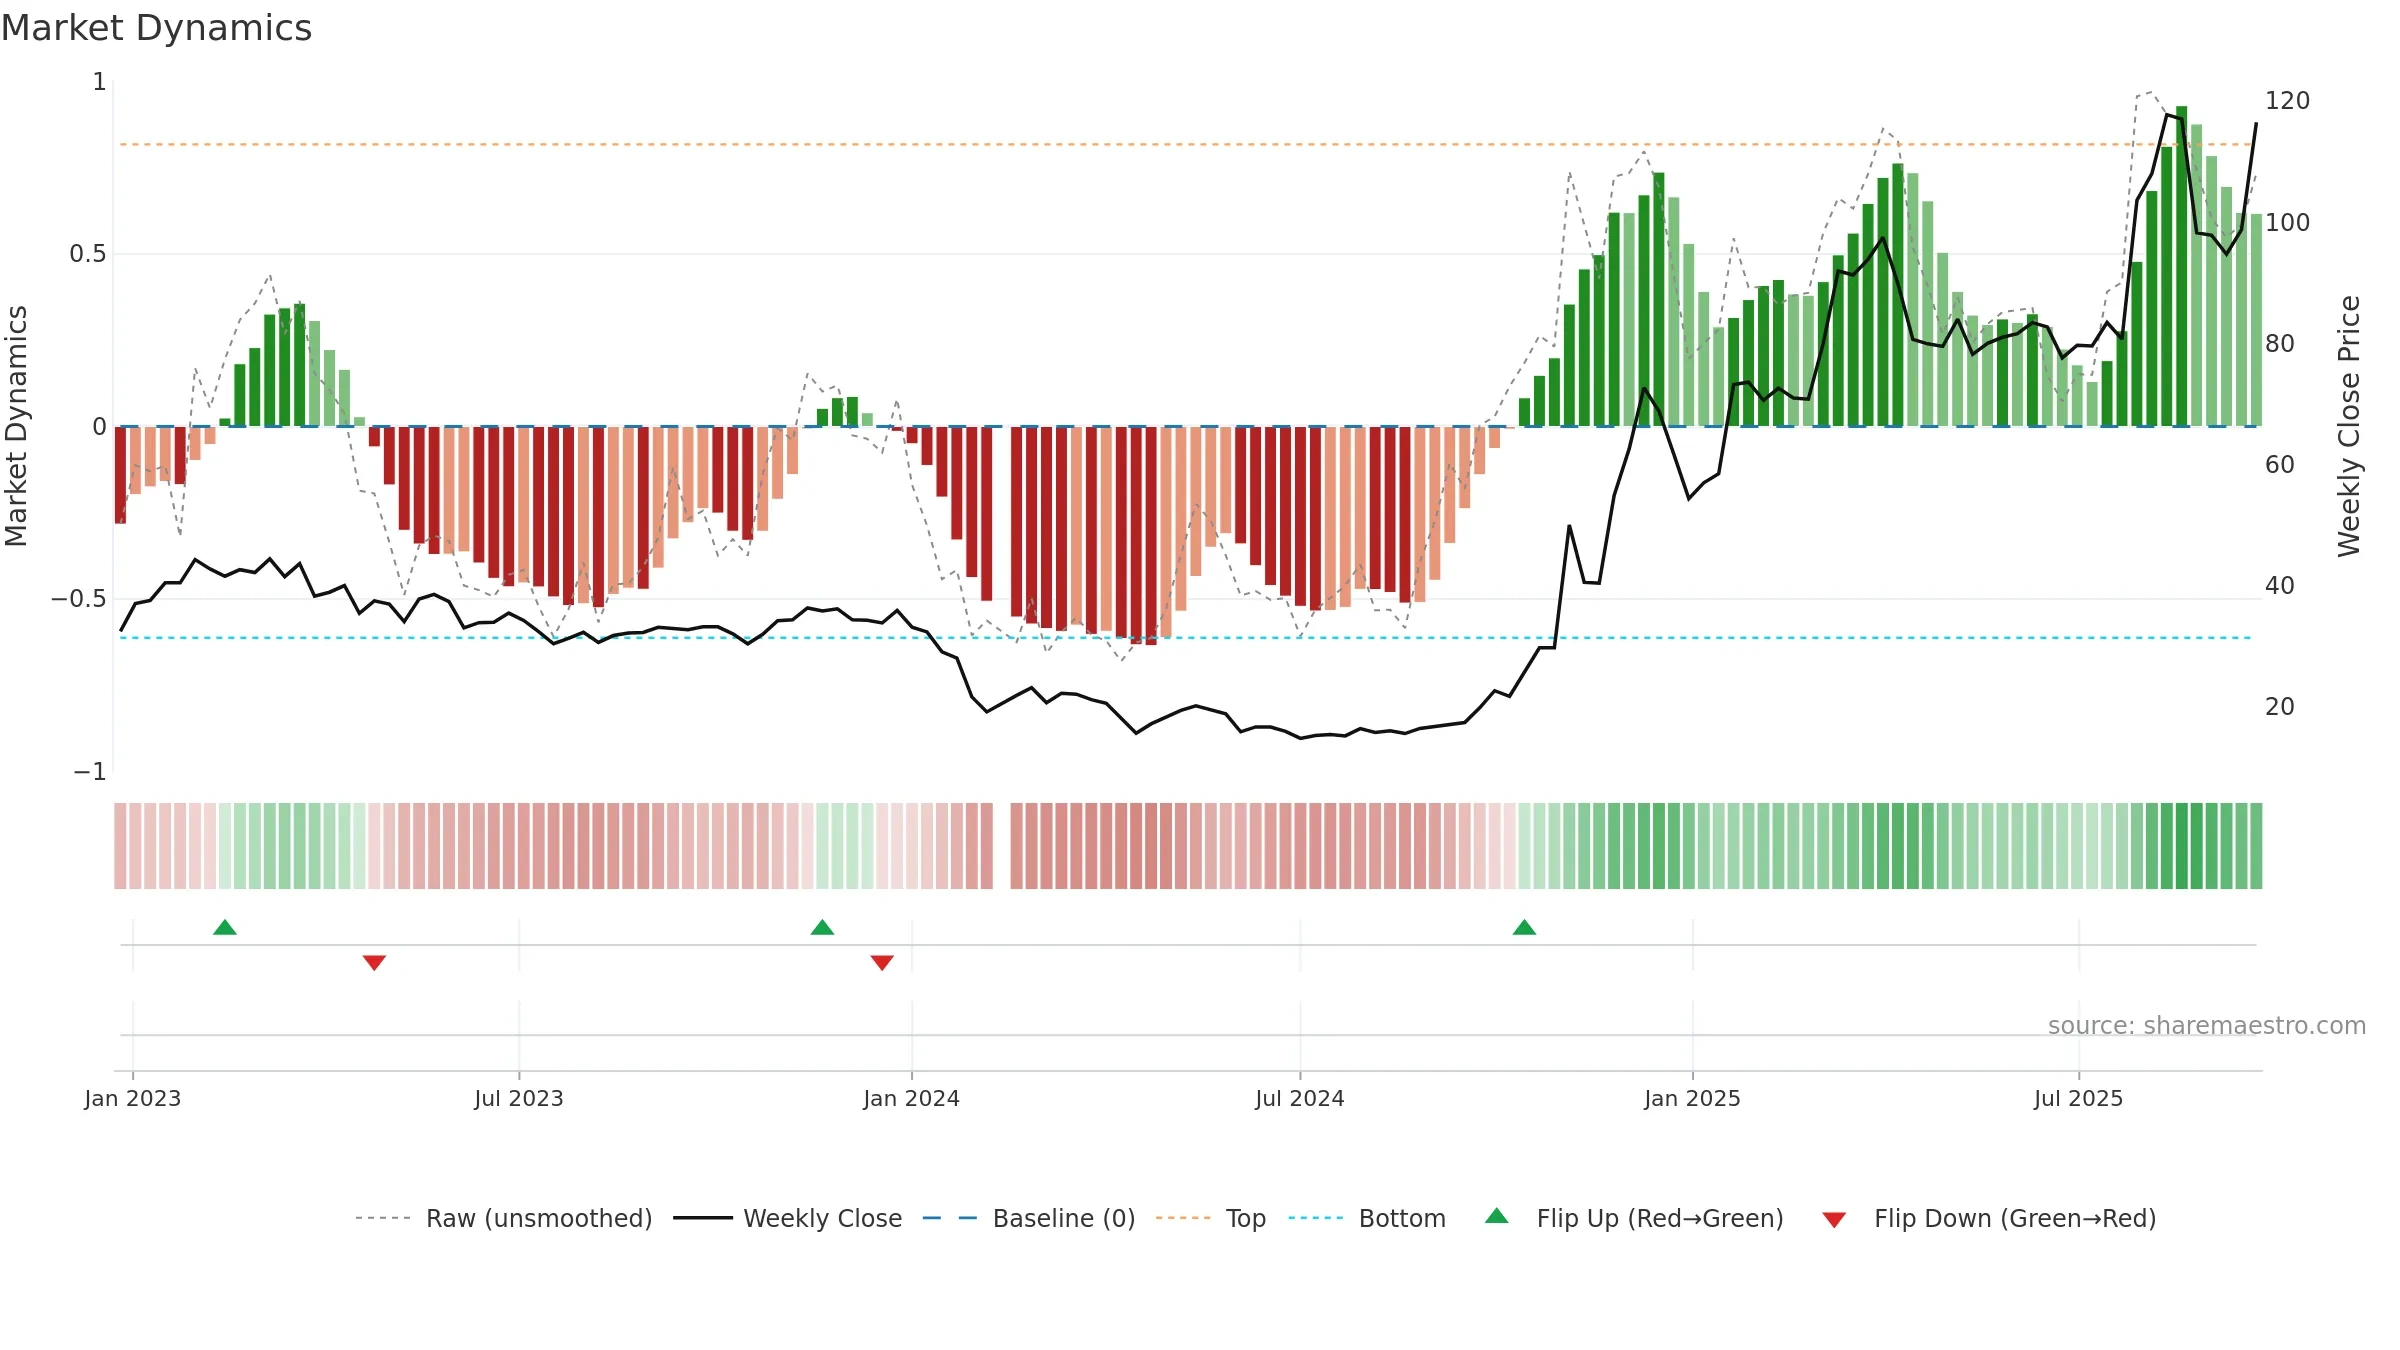
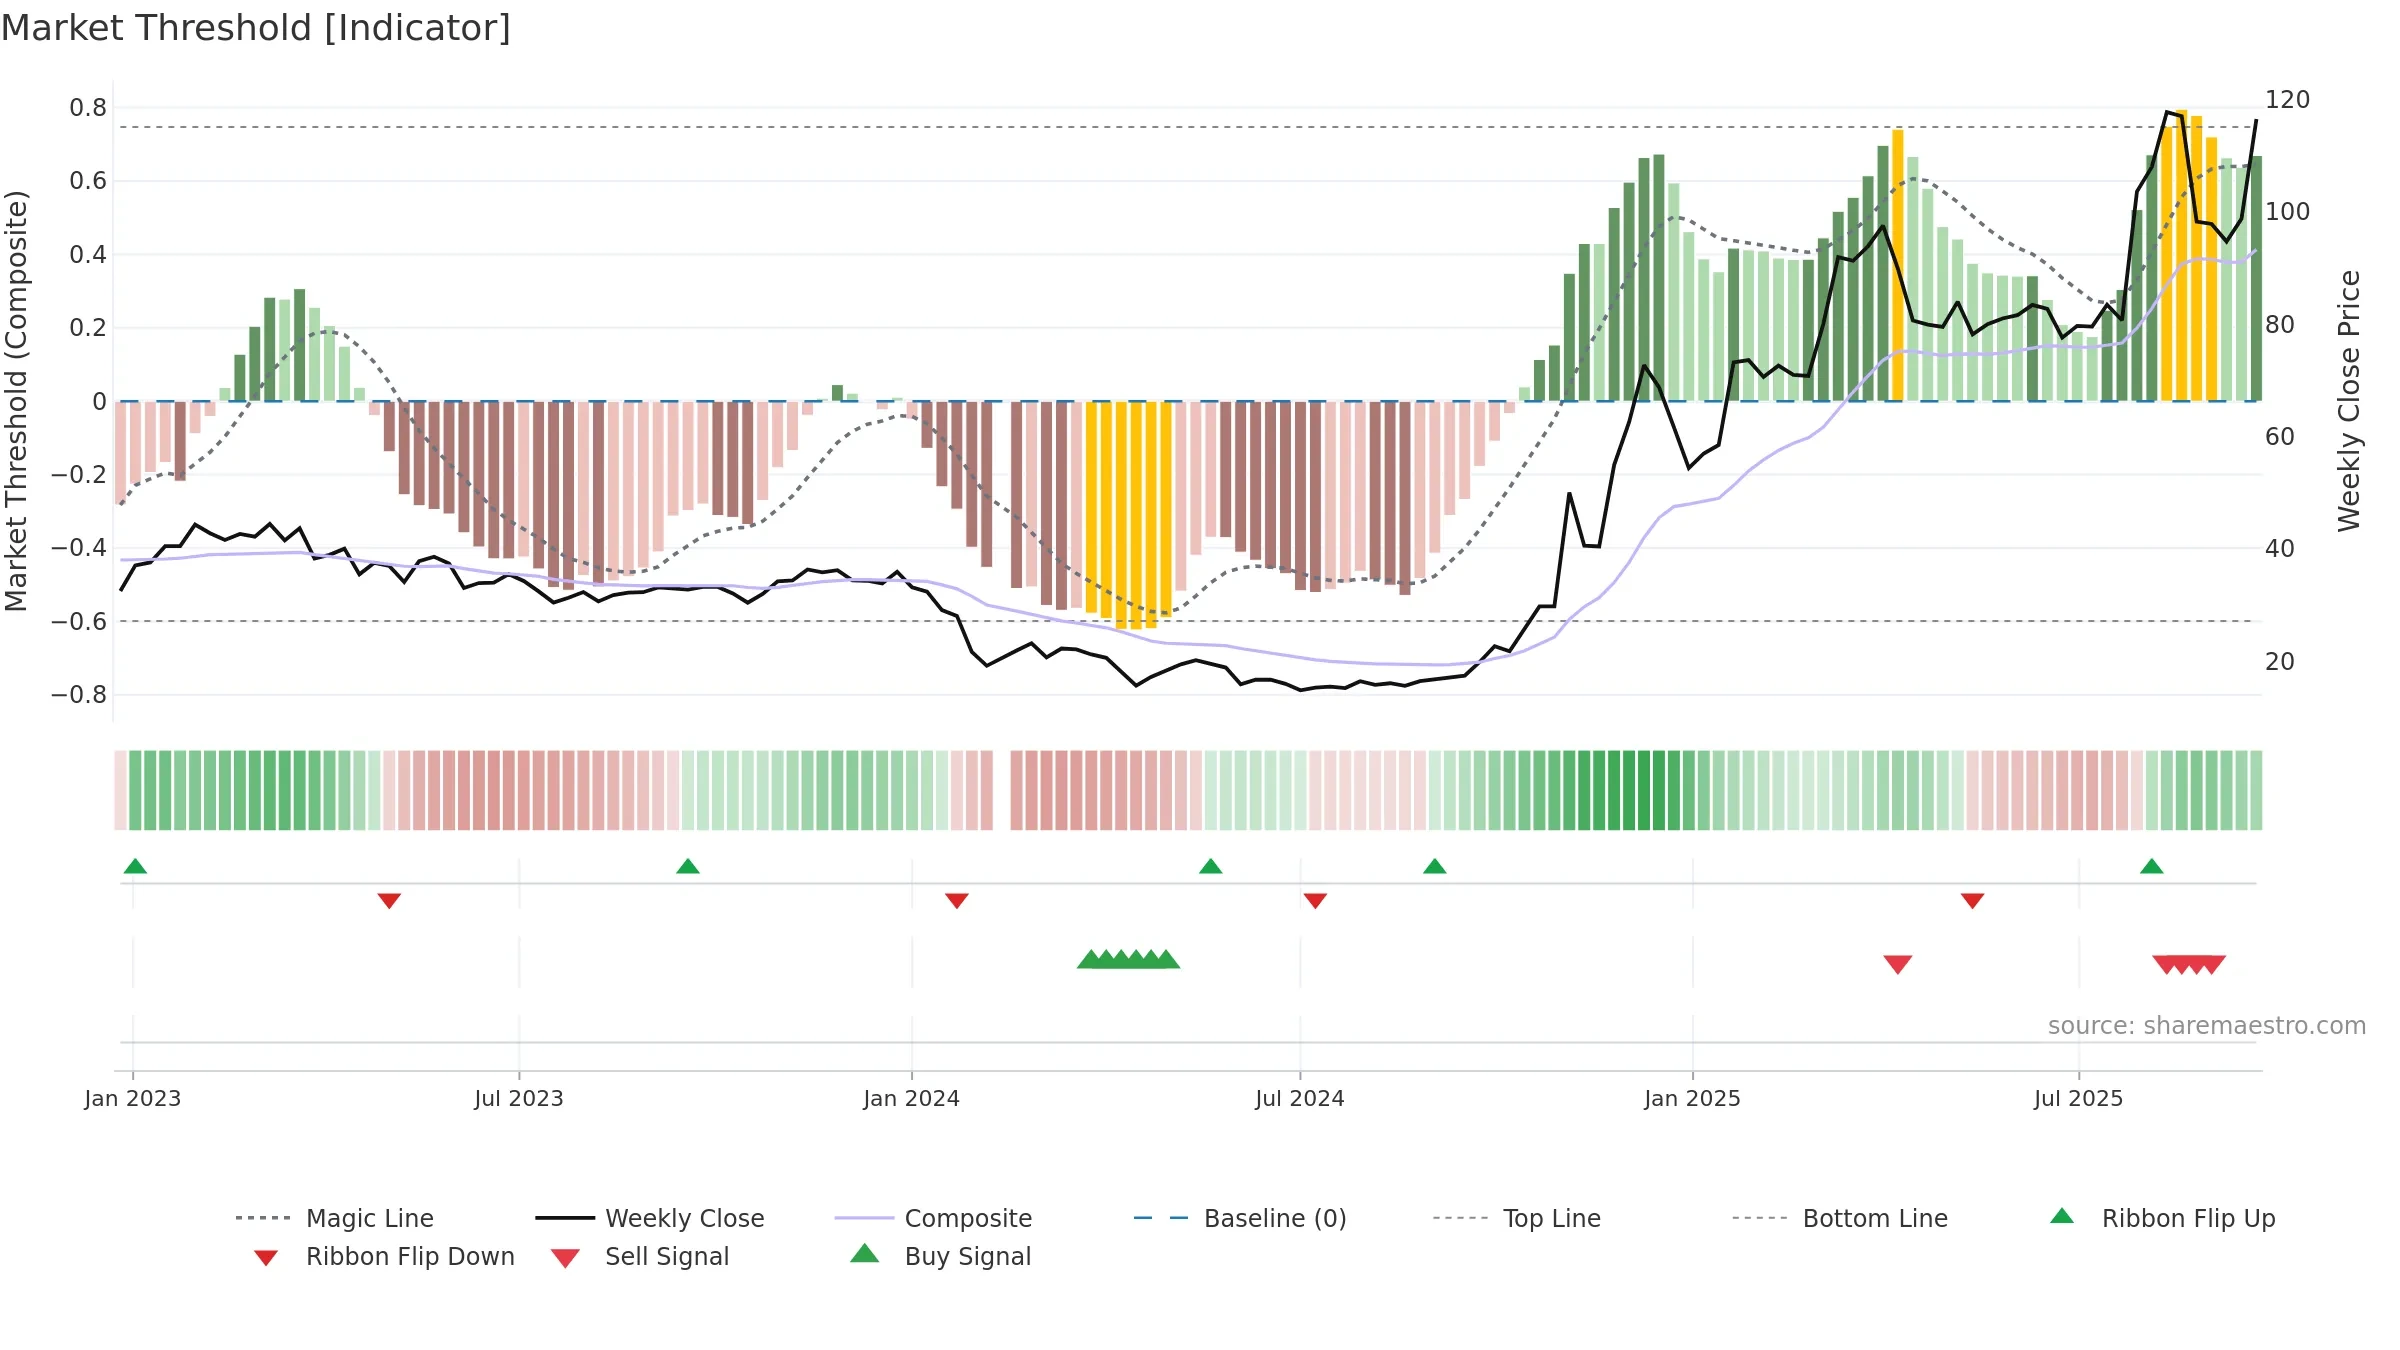
How to read this — Price slope is downward, indicating persistent supply pressure. Elevated weekly volatility increases whipsaw risk. Volume and price are moving in the same direction — a constructive confirmation. Distance to baseline is narrowing — reverting closer to its fair-value track. Price holds above key averages, indicating constructive participation.
Down-slope argues for patience; rallies can fade sooner unless participation improves.
Gauge maps the trend signal to a 0–100 scale.
How to read this — Gauge is elevated but momentum is rolling over; topping risk is rising.
Stay alert: protect gains or seek confirmation before adding risk.

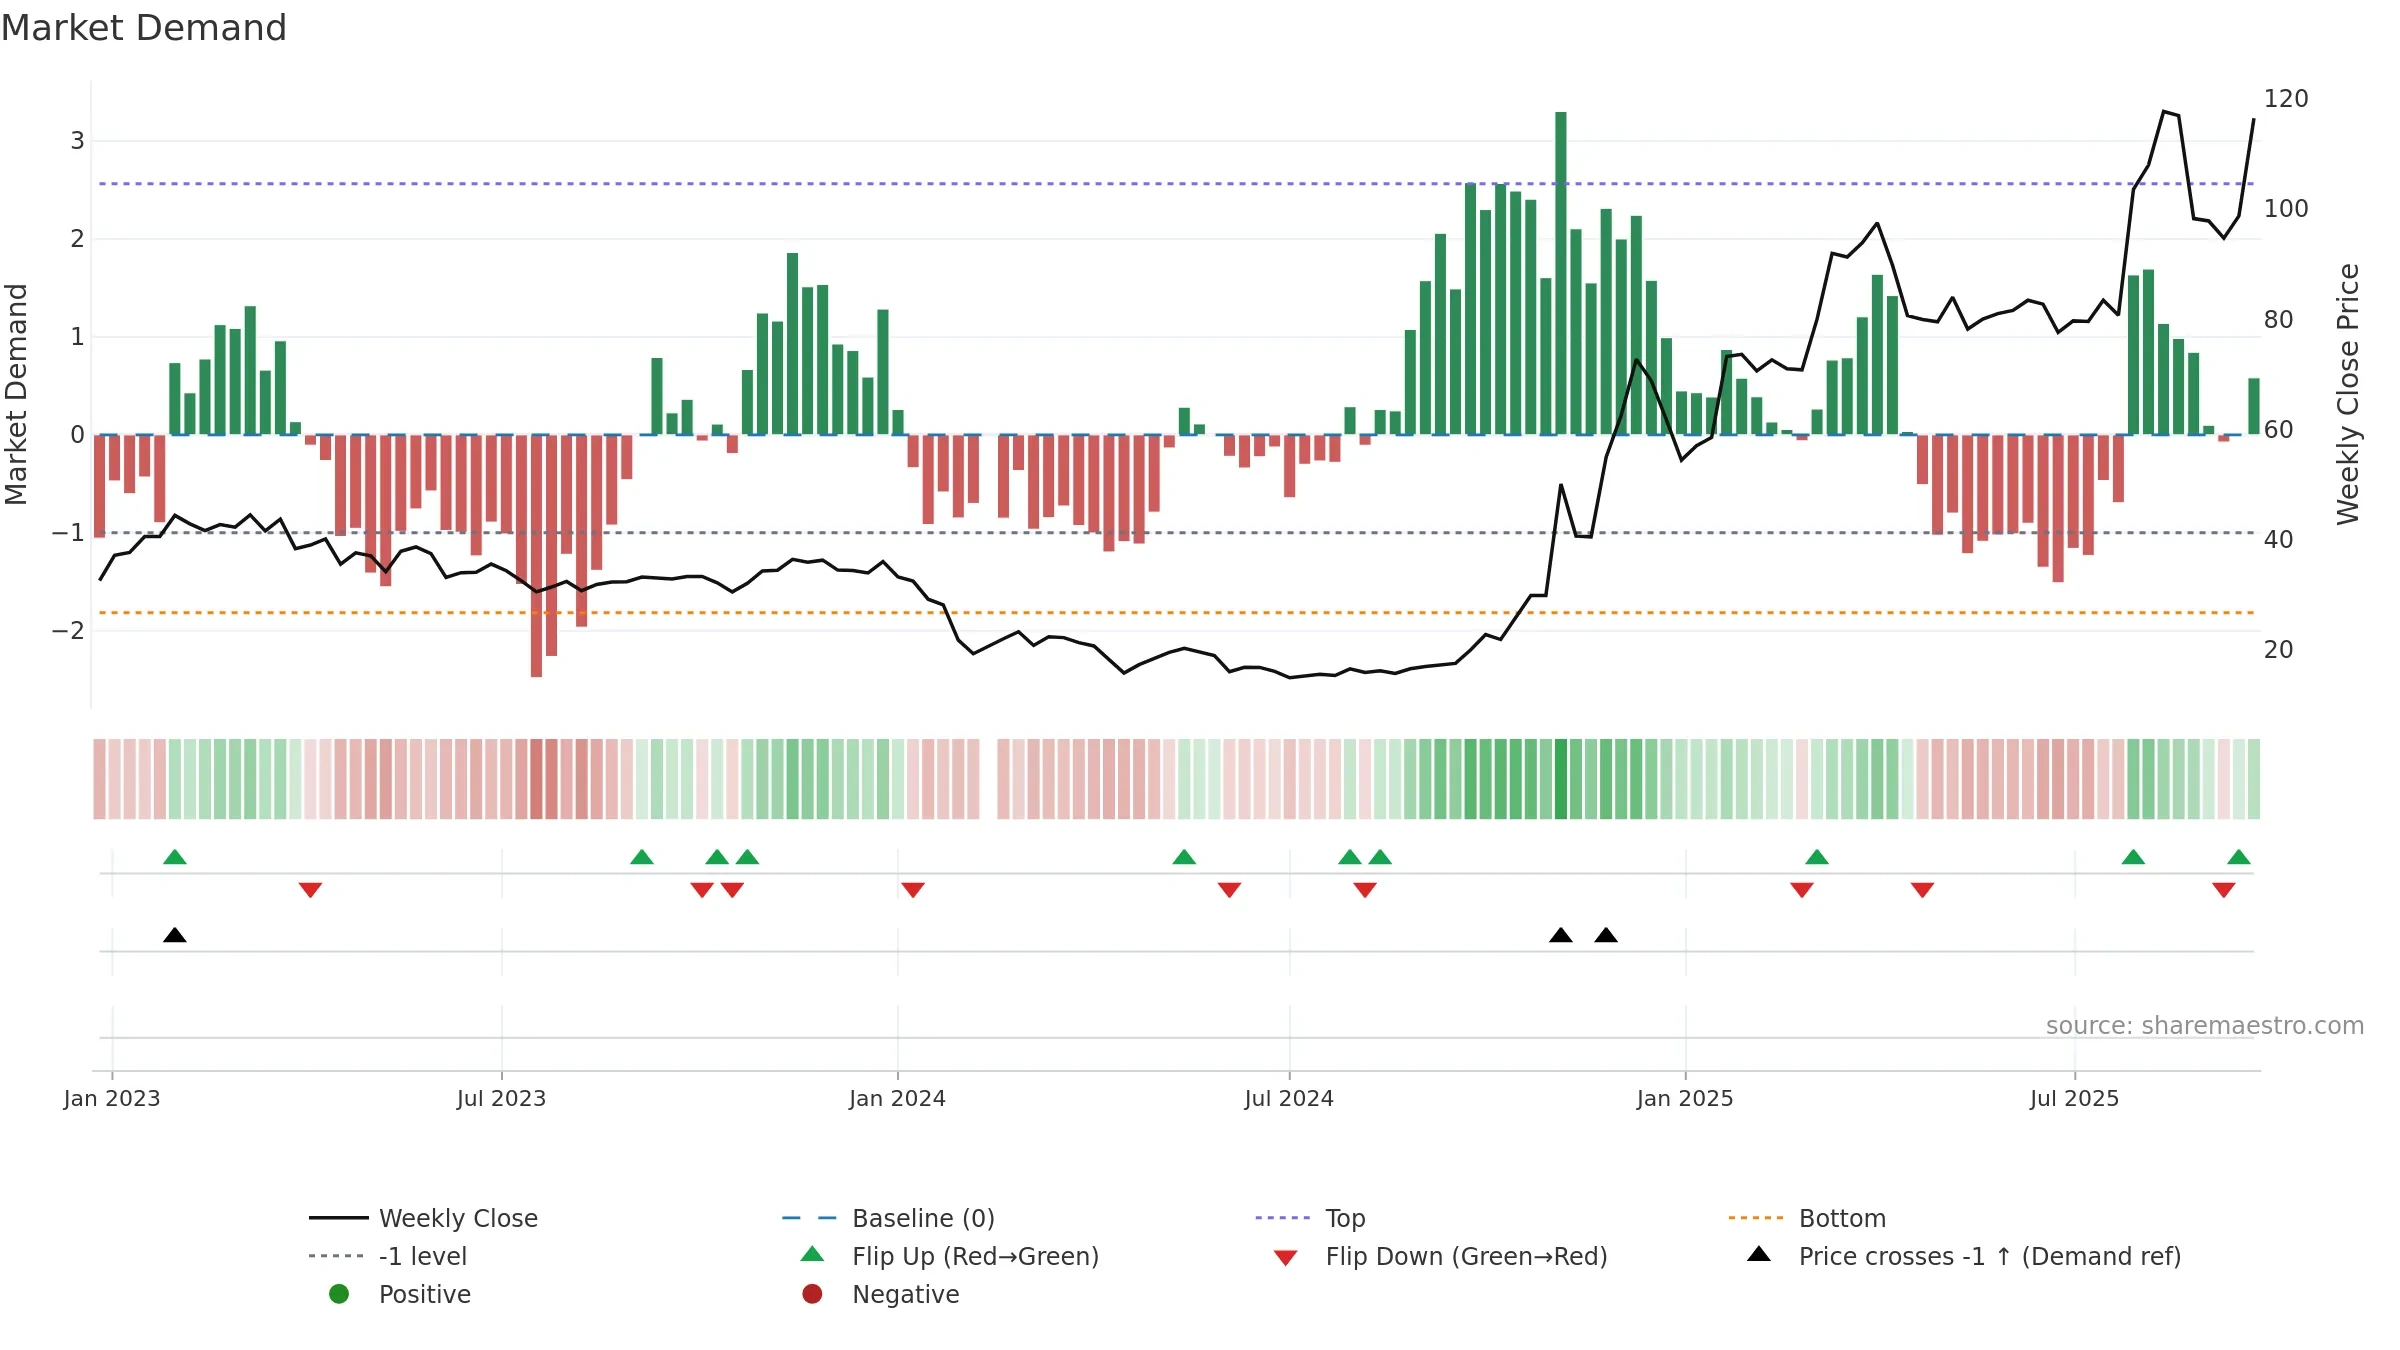
Relative strength is Positive
(> 0%, outperforming).
Latest MRS: 3.75% (week ending Fri, 19 Sep 2025).
Slope: Falling over 8w.
Notes:
- Holding above the zero line indicates relative bid.
- MRS slope falling over ~8 weeks.
Conclusion
Neutral setup. ★★★⯪☆ confidence. Trend: Uptrend at Risk · 7.87% over window · vol 5.80% · liquidity convergence · posture above · RS outperforming · leaning positive
- Momentum is bullish and rising
- Price holds above 8–26 week averages
- Liquidity confirms the price trend
- Mansfield RS: outperforming & rising
- High level but momentum rolling over (topping risk)
- High return volatility raises whipsaw risk
Why: Price window 7.87% over w. Close is -1.05% below the prior-window high. Return volatility 5.80%. Volume trend falling. Liquidity convergence with price. Trend state uptrend at risk. Baseline deviation 1.58% (narrowing). Momentum bullish and rising.
Tip: Most metrics include a hover tooltip where they appear in the report.