BGM Group Ltd.
BGM NASDAQ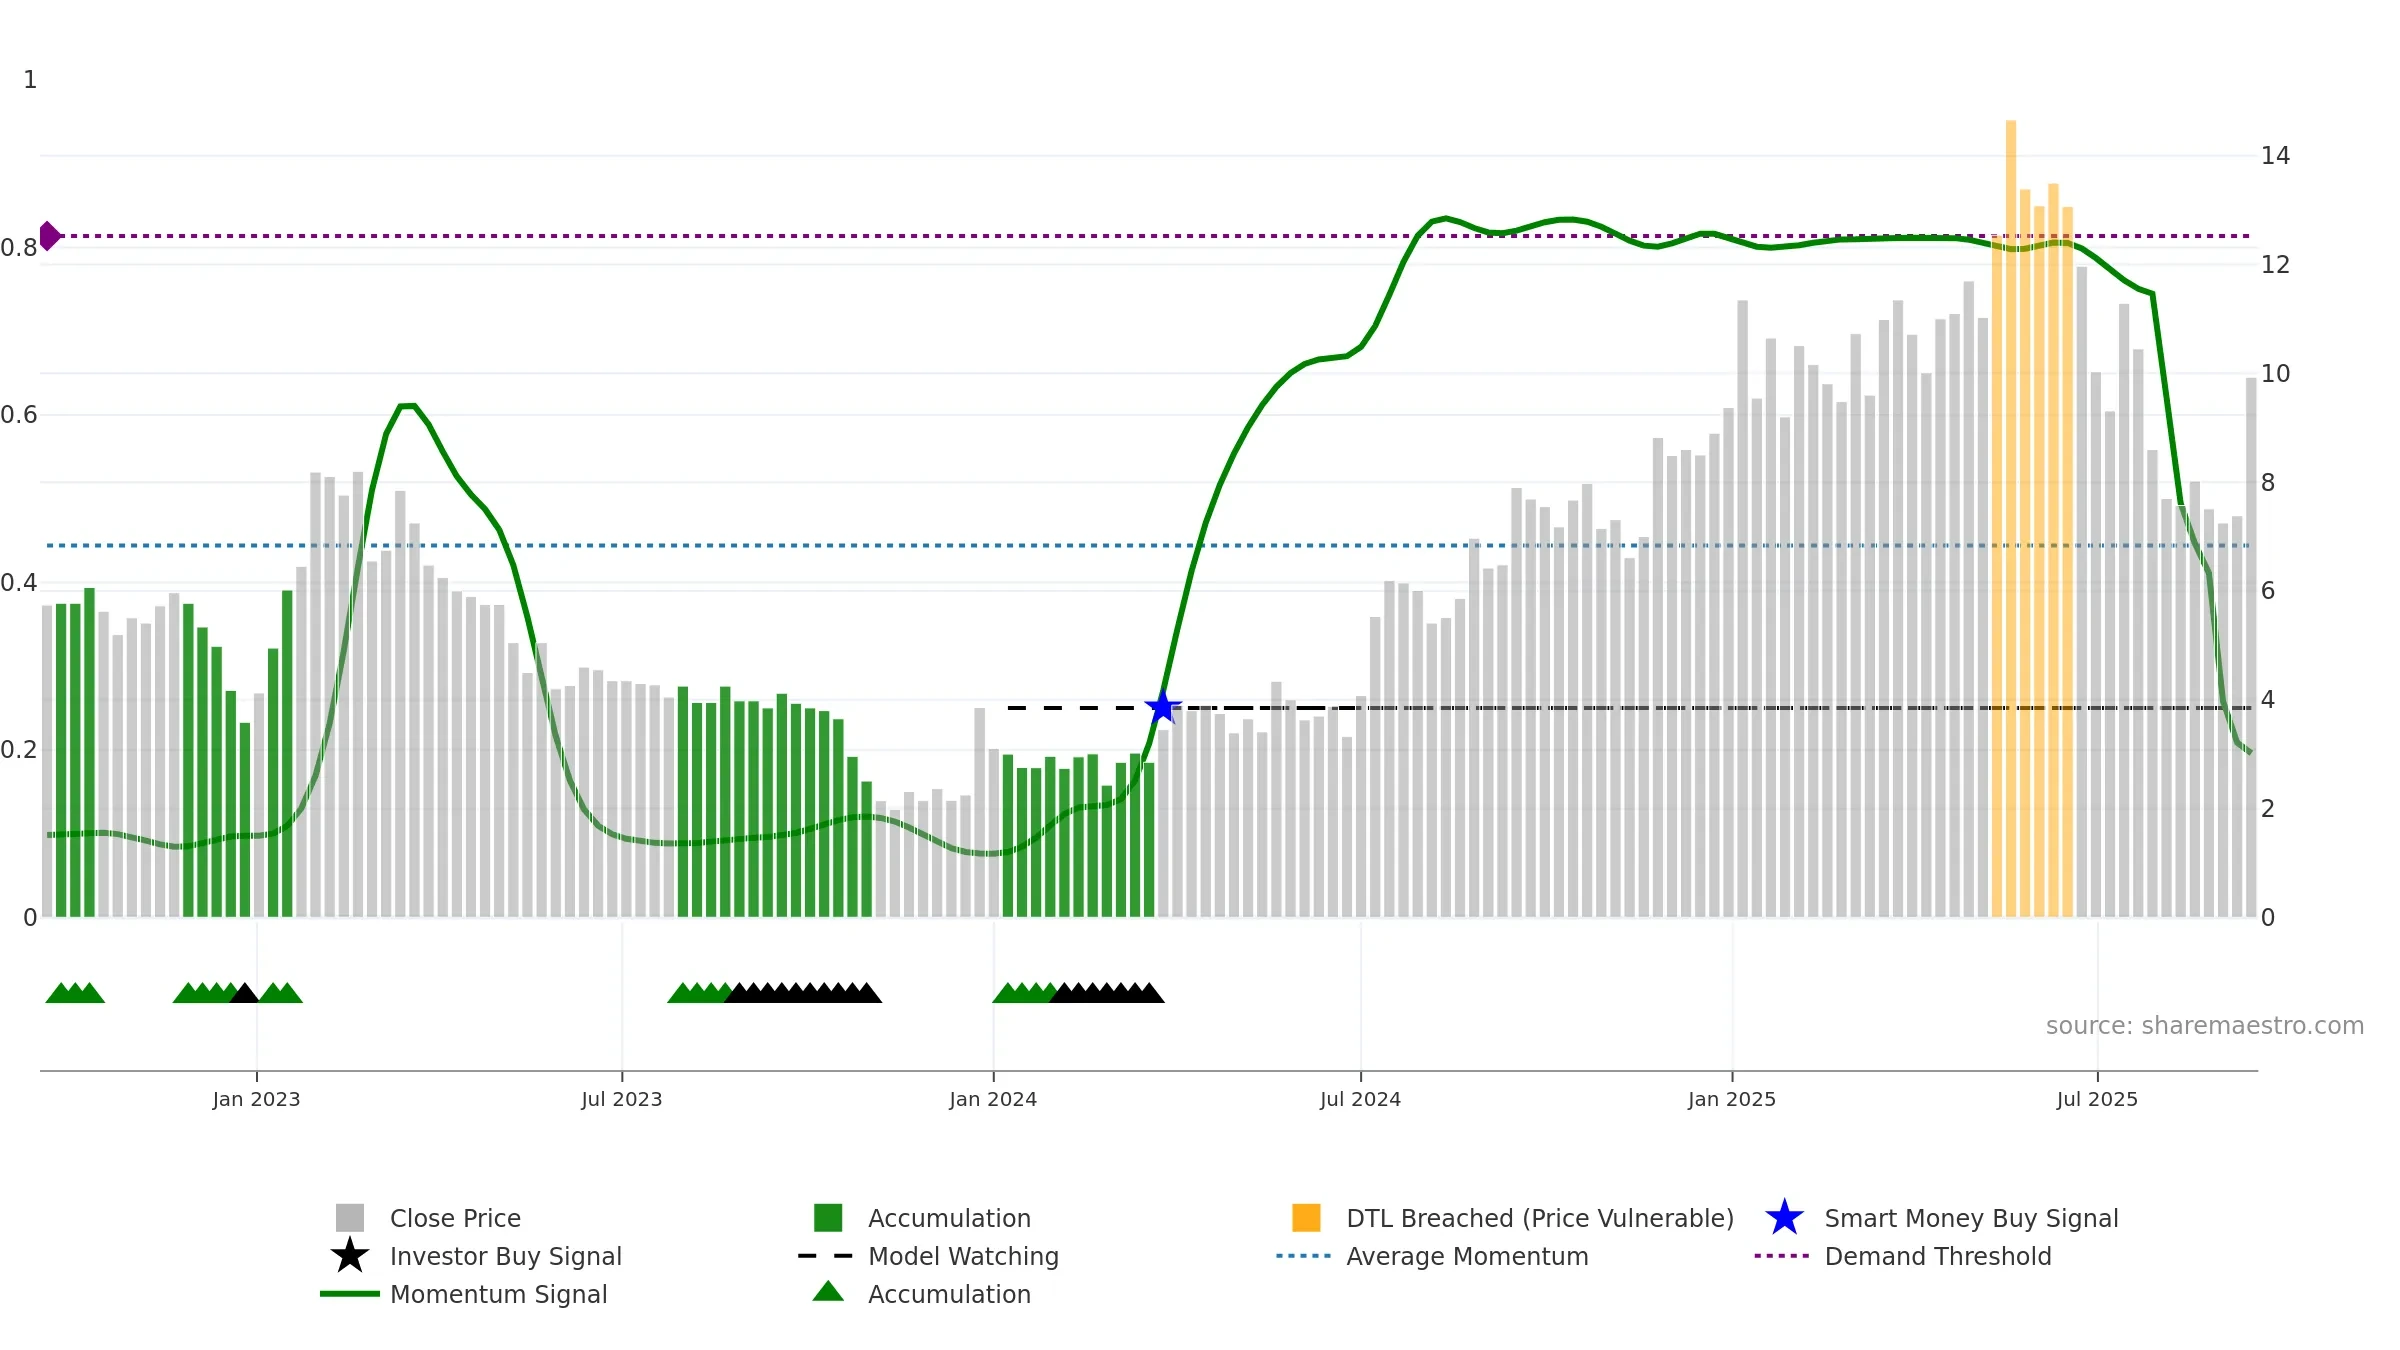
Weekly Report
BGM Group Ltd. closed at 9.9300 (36.78% WoW) . Data window ends Mon, 15 Sep 2025.
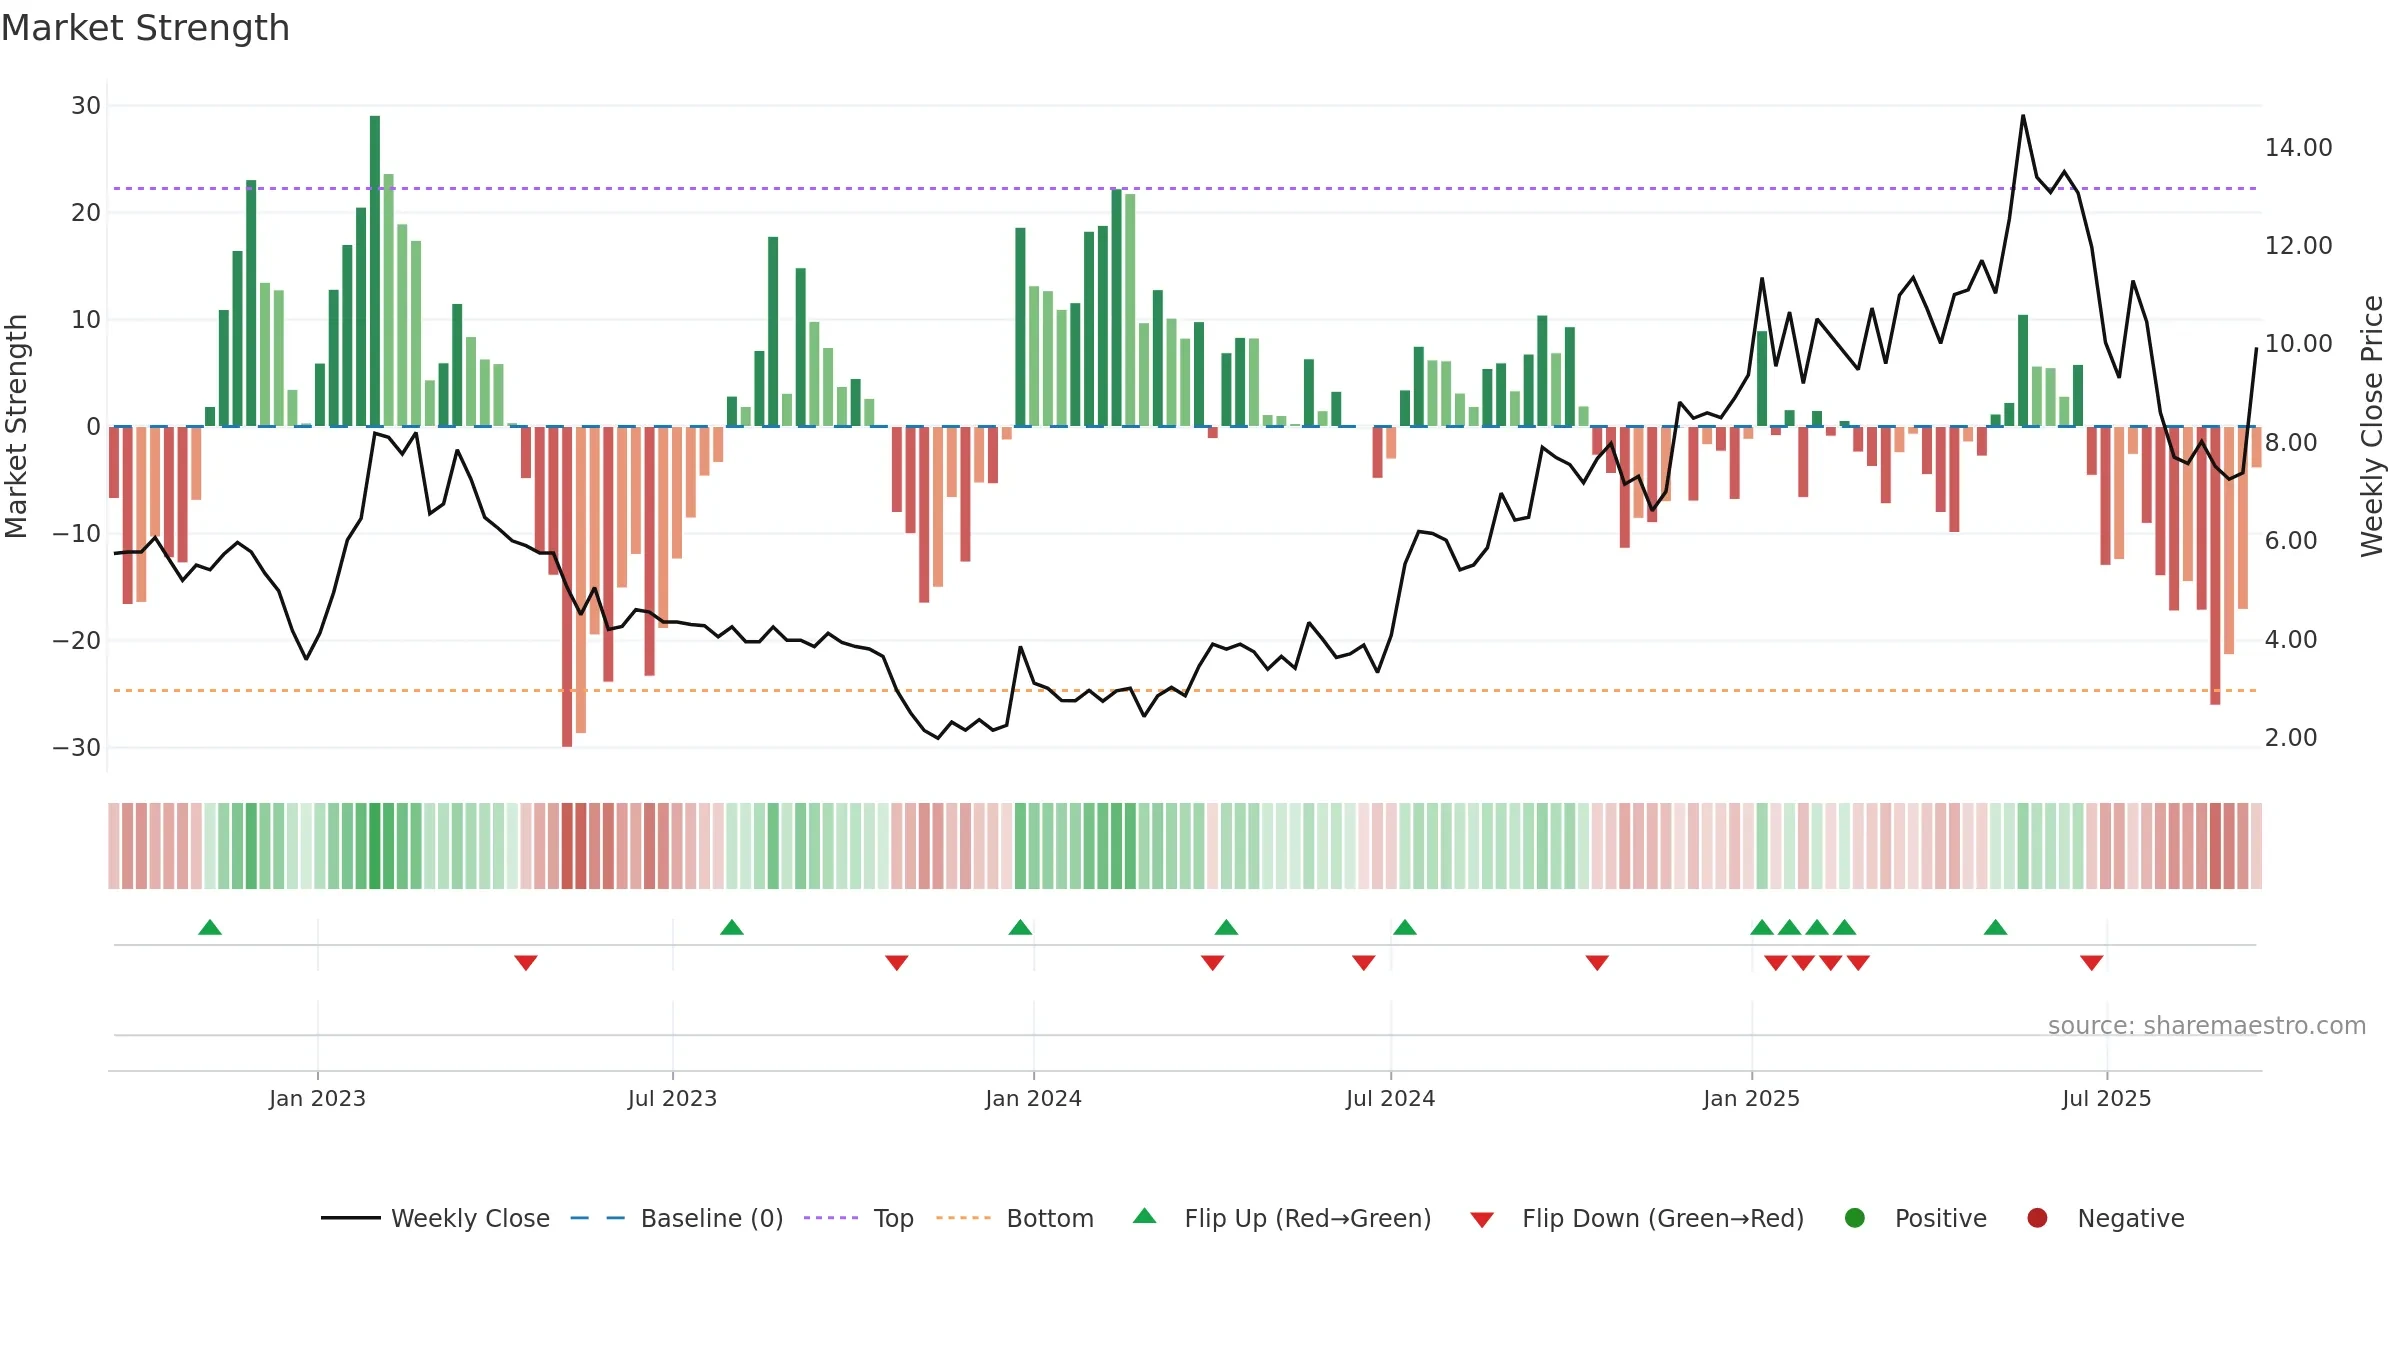
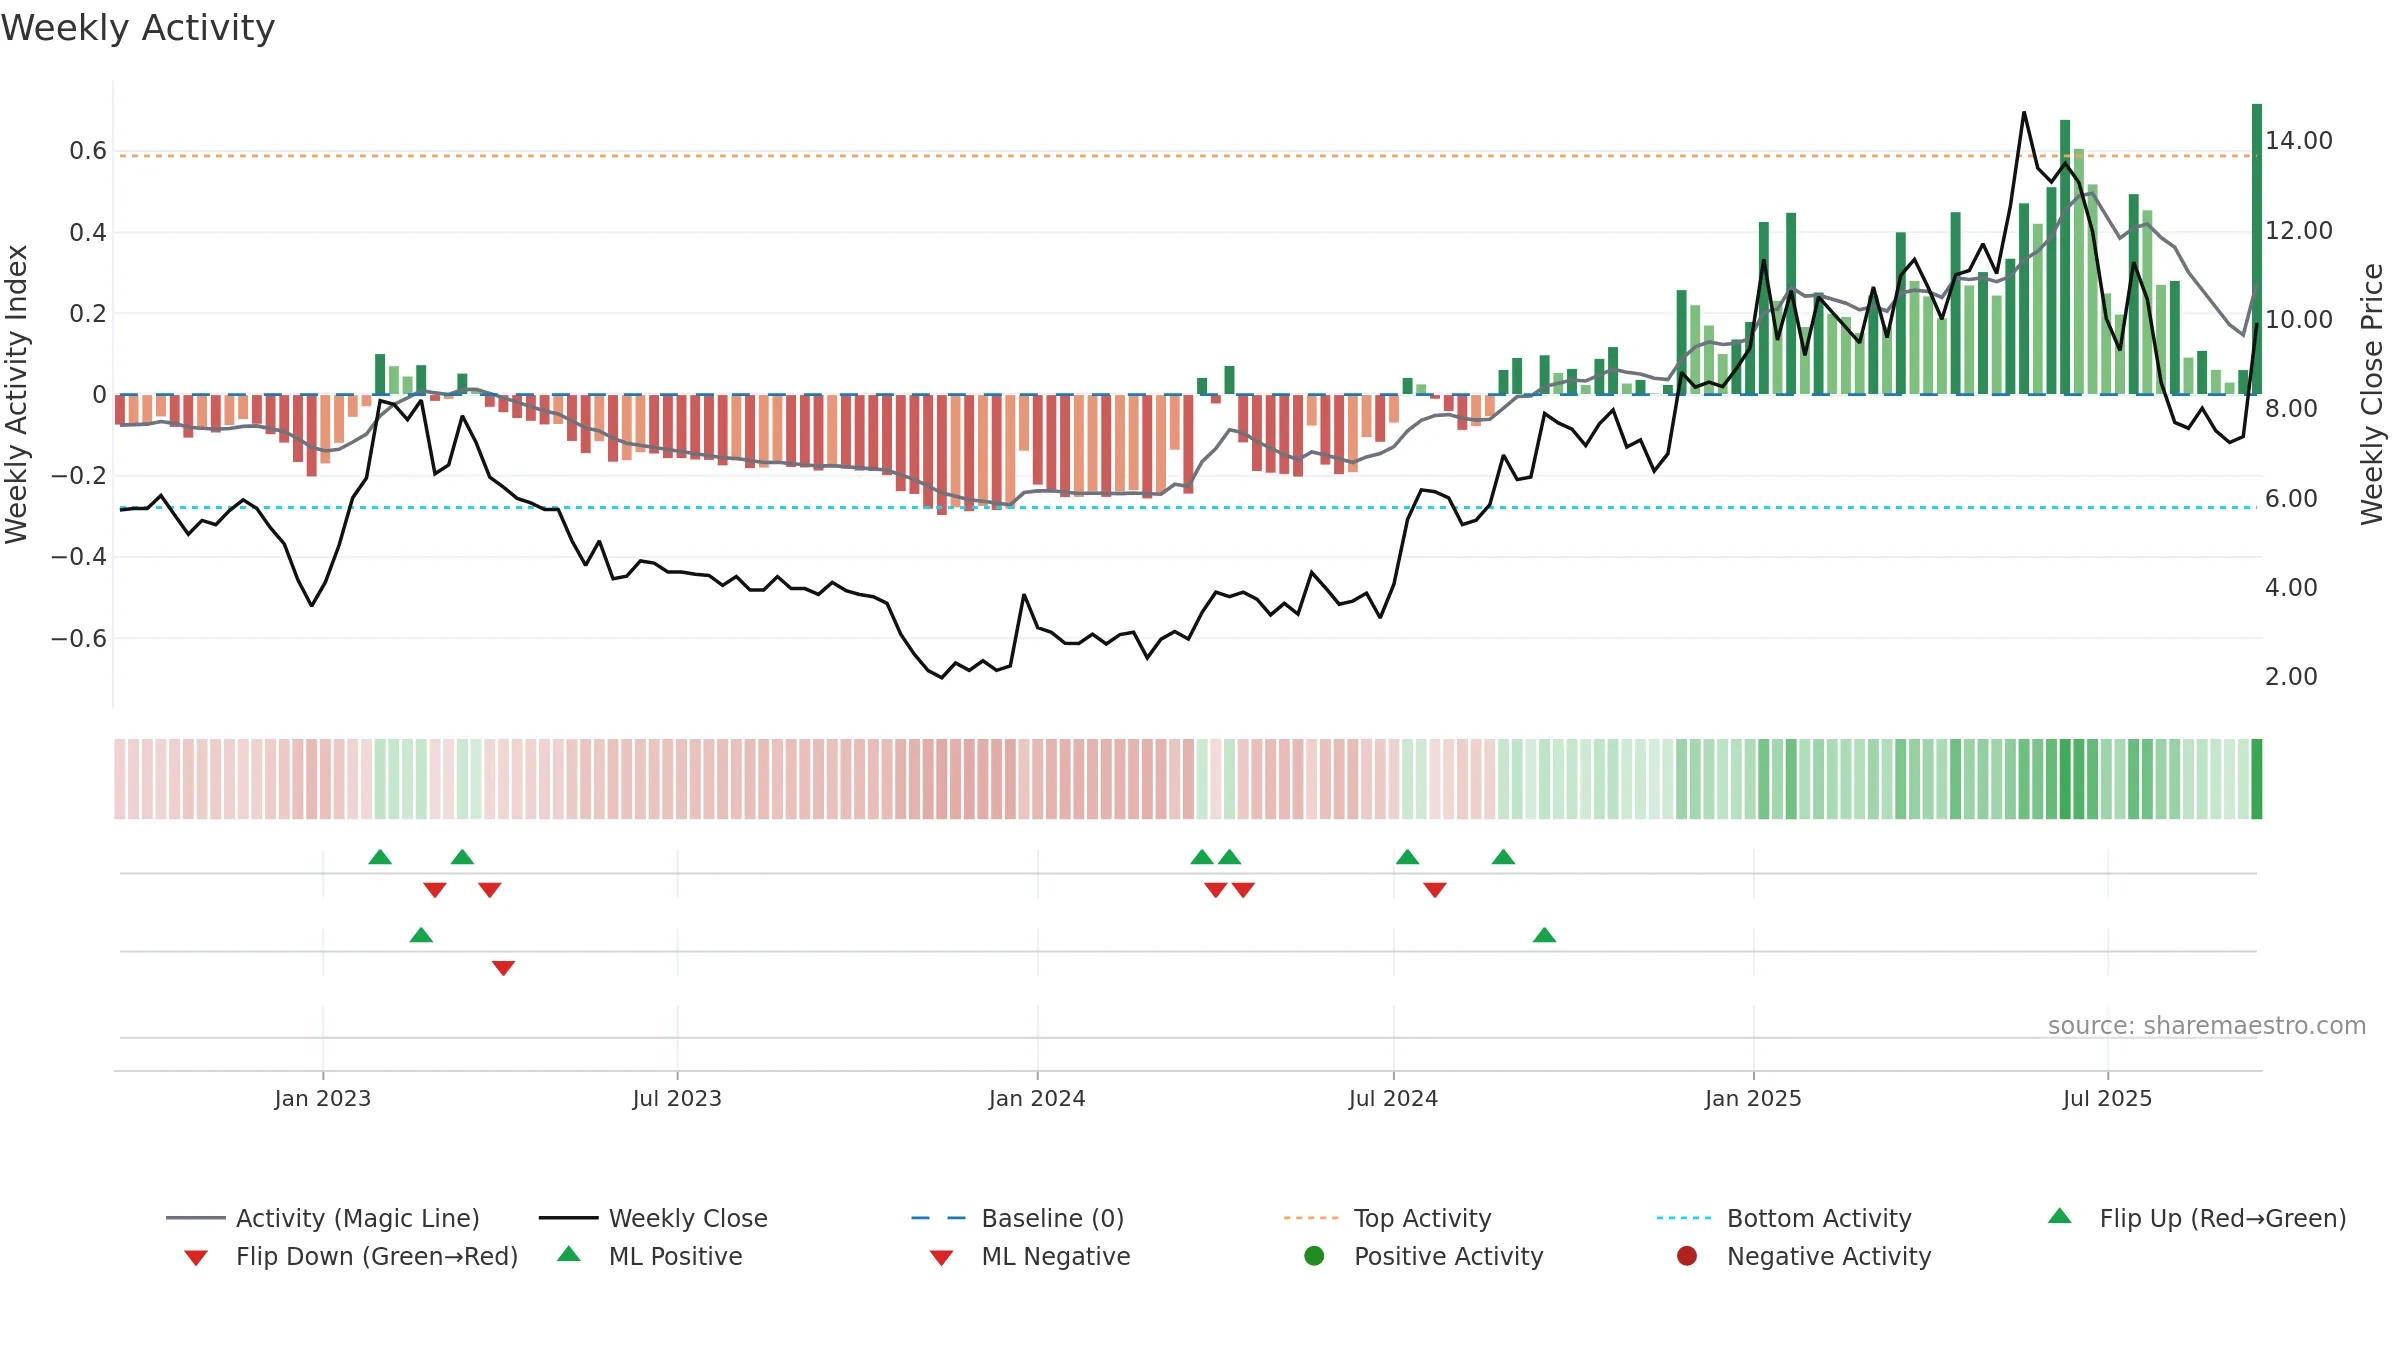
How to read this — Price slope is upward, indicating persistent buying over the window. Elevated weekly volatility increases whipsaw risk. Volume and price are moving in the same direction — a constructive confirmation. Returns are positively correlated with volume — strength tends to arrive on higher activity. Price is stretched above its baseline; consolidation risk rises if activity fades. Fresh short-term crossover improves near-term tone.
Up-slope supports buying interest; pullbacks may be contained if activity stays firm.
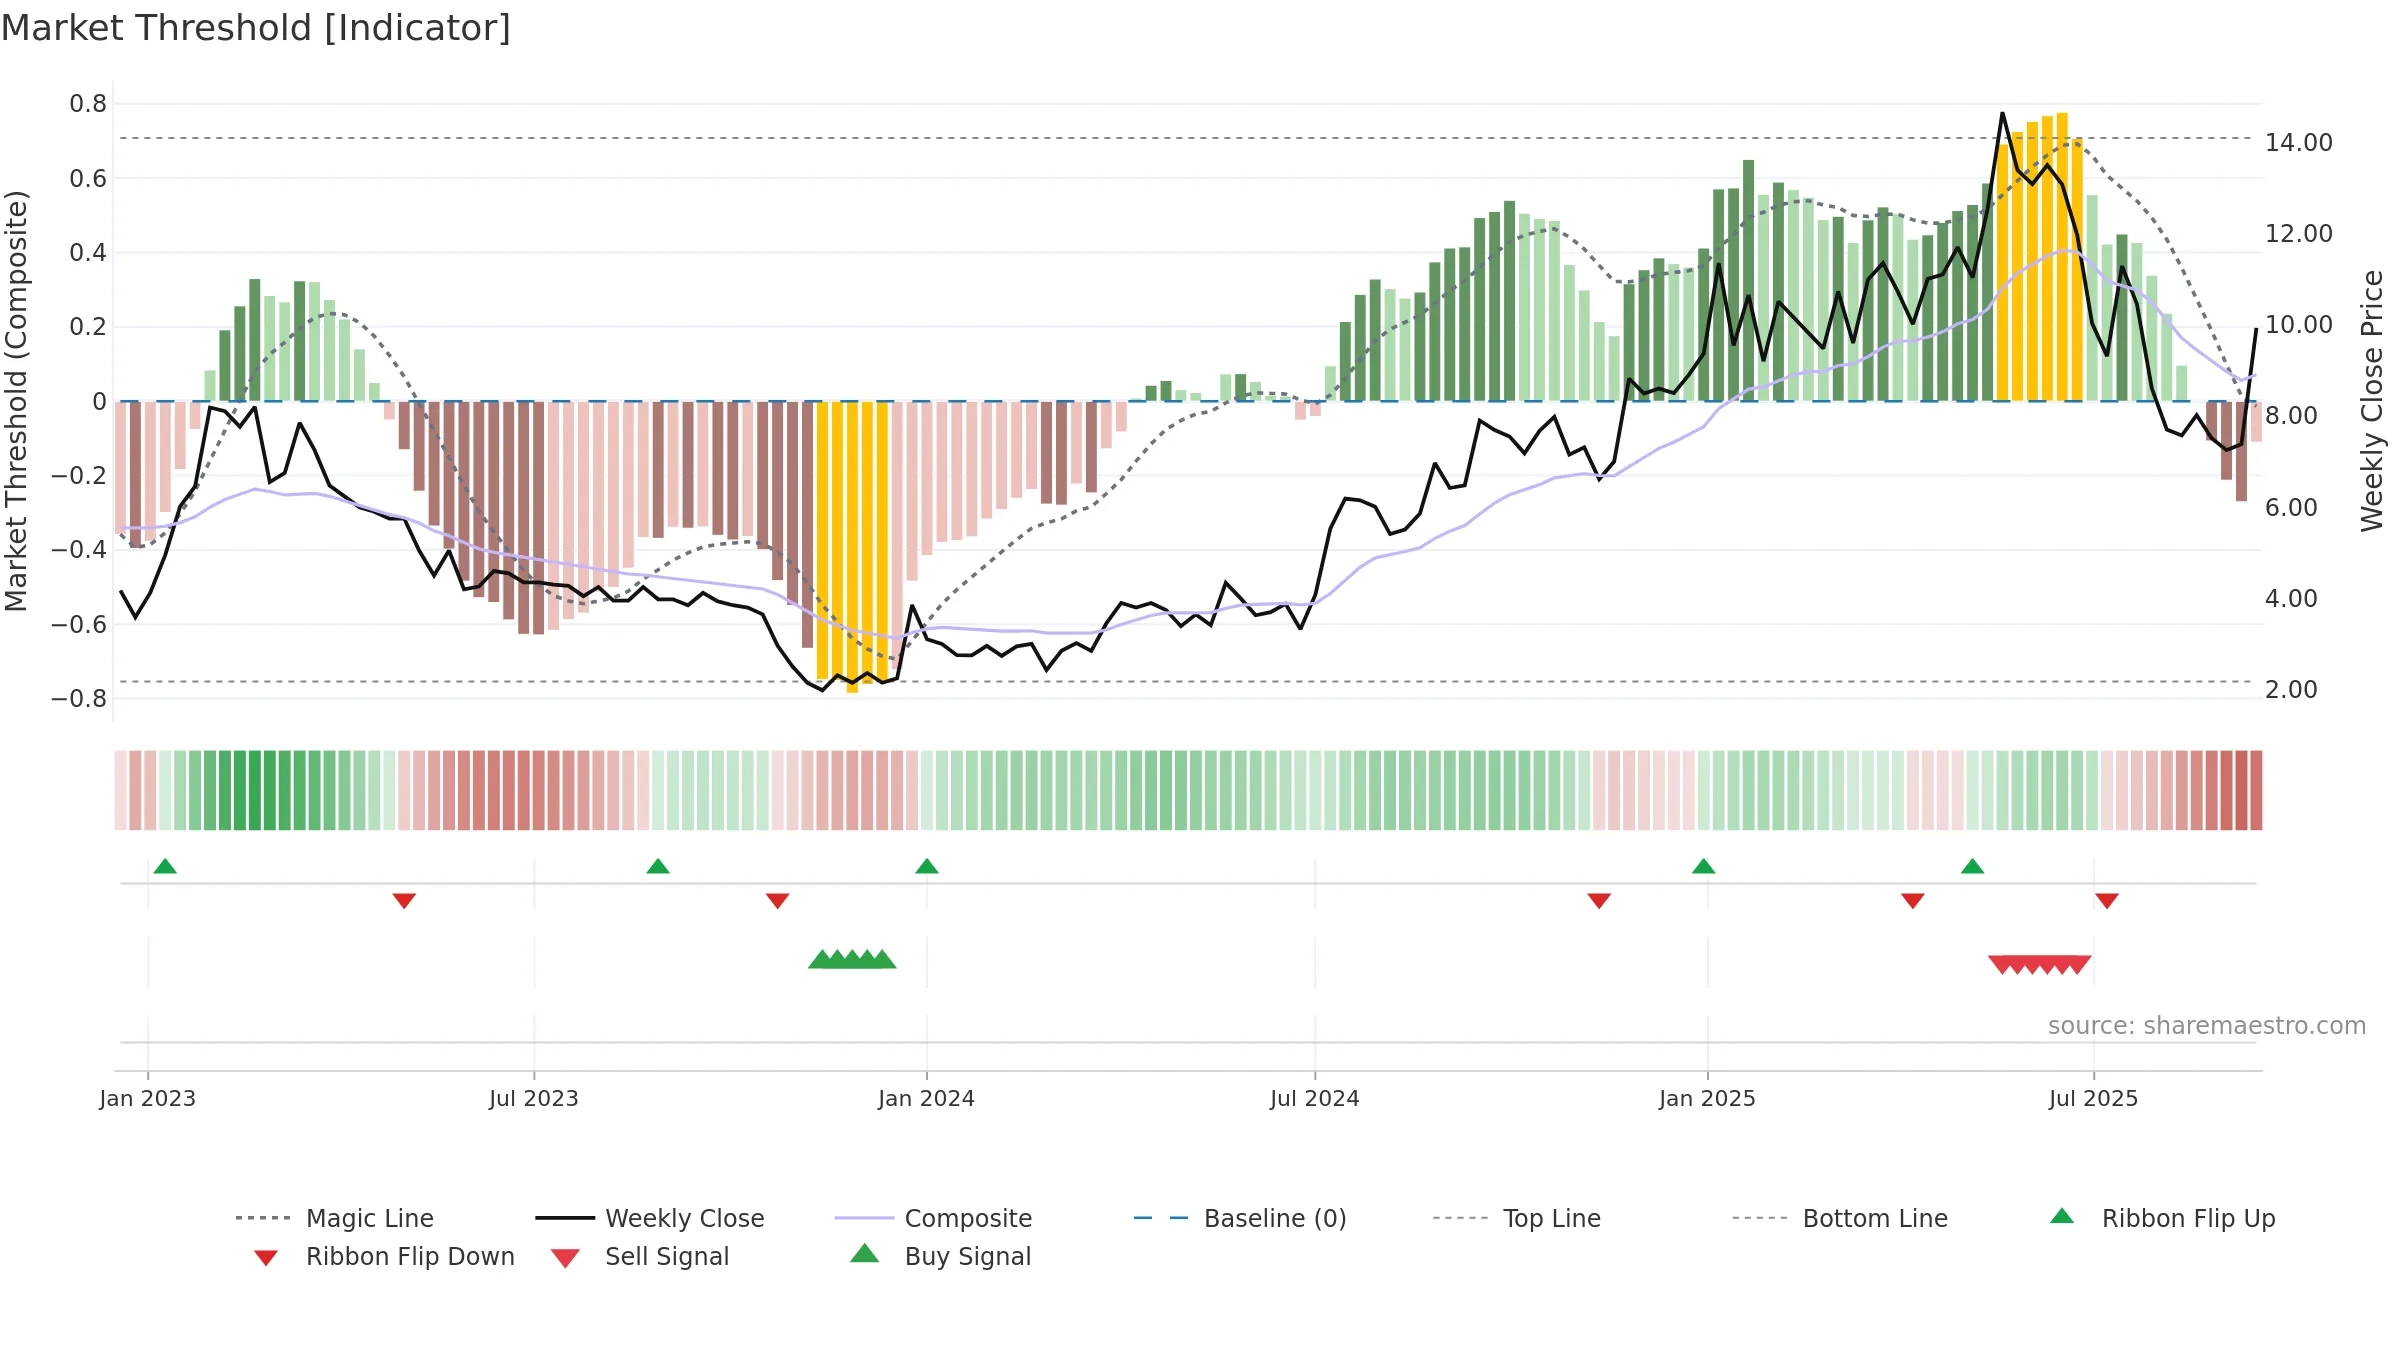
Gauge maps the trend signal to a 0–100 scale.
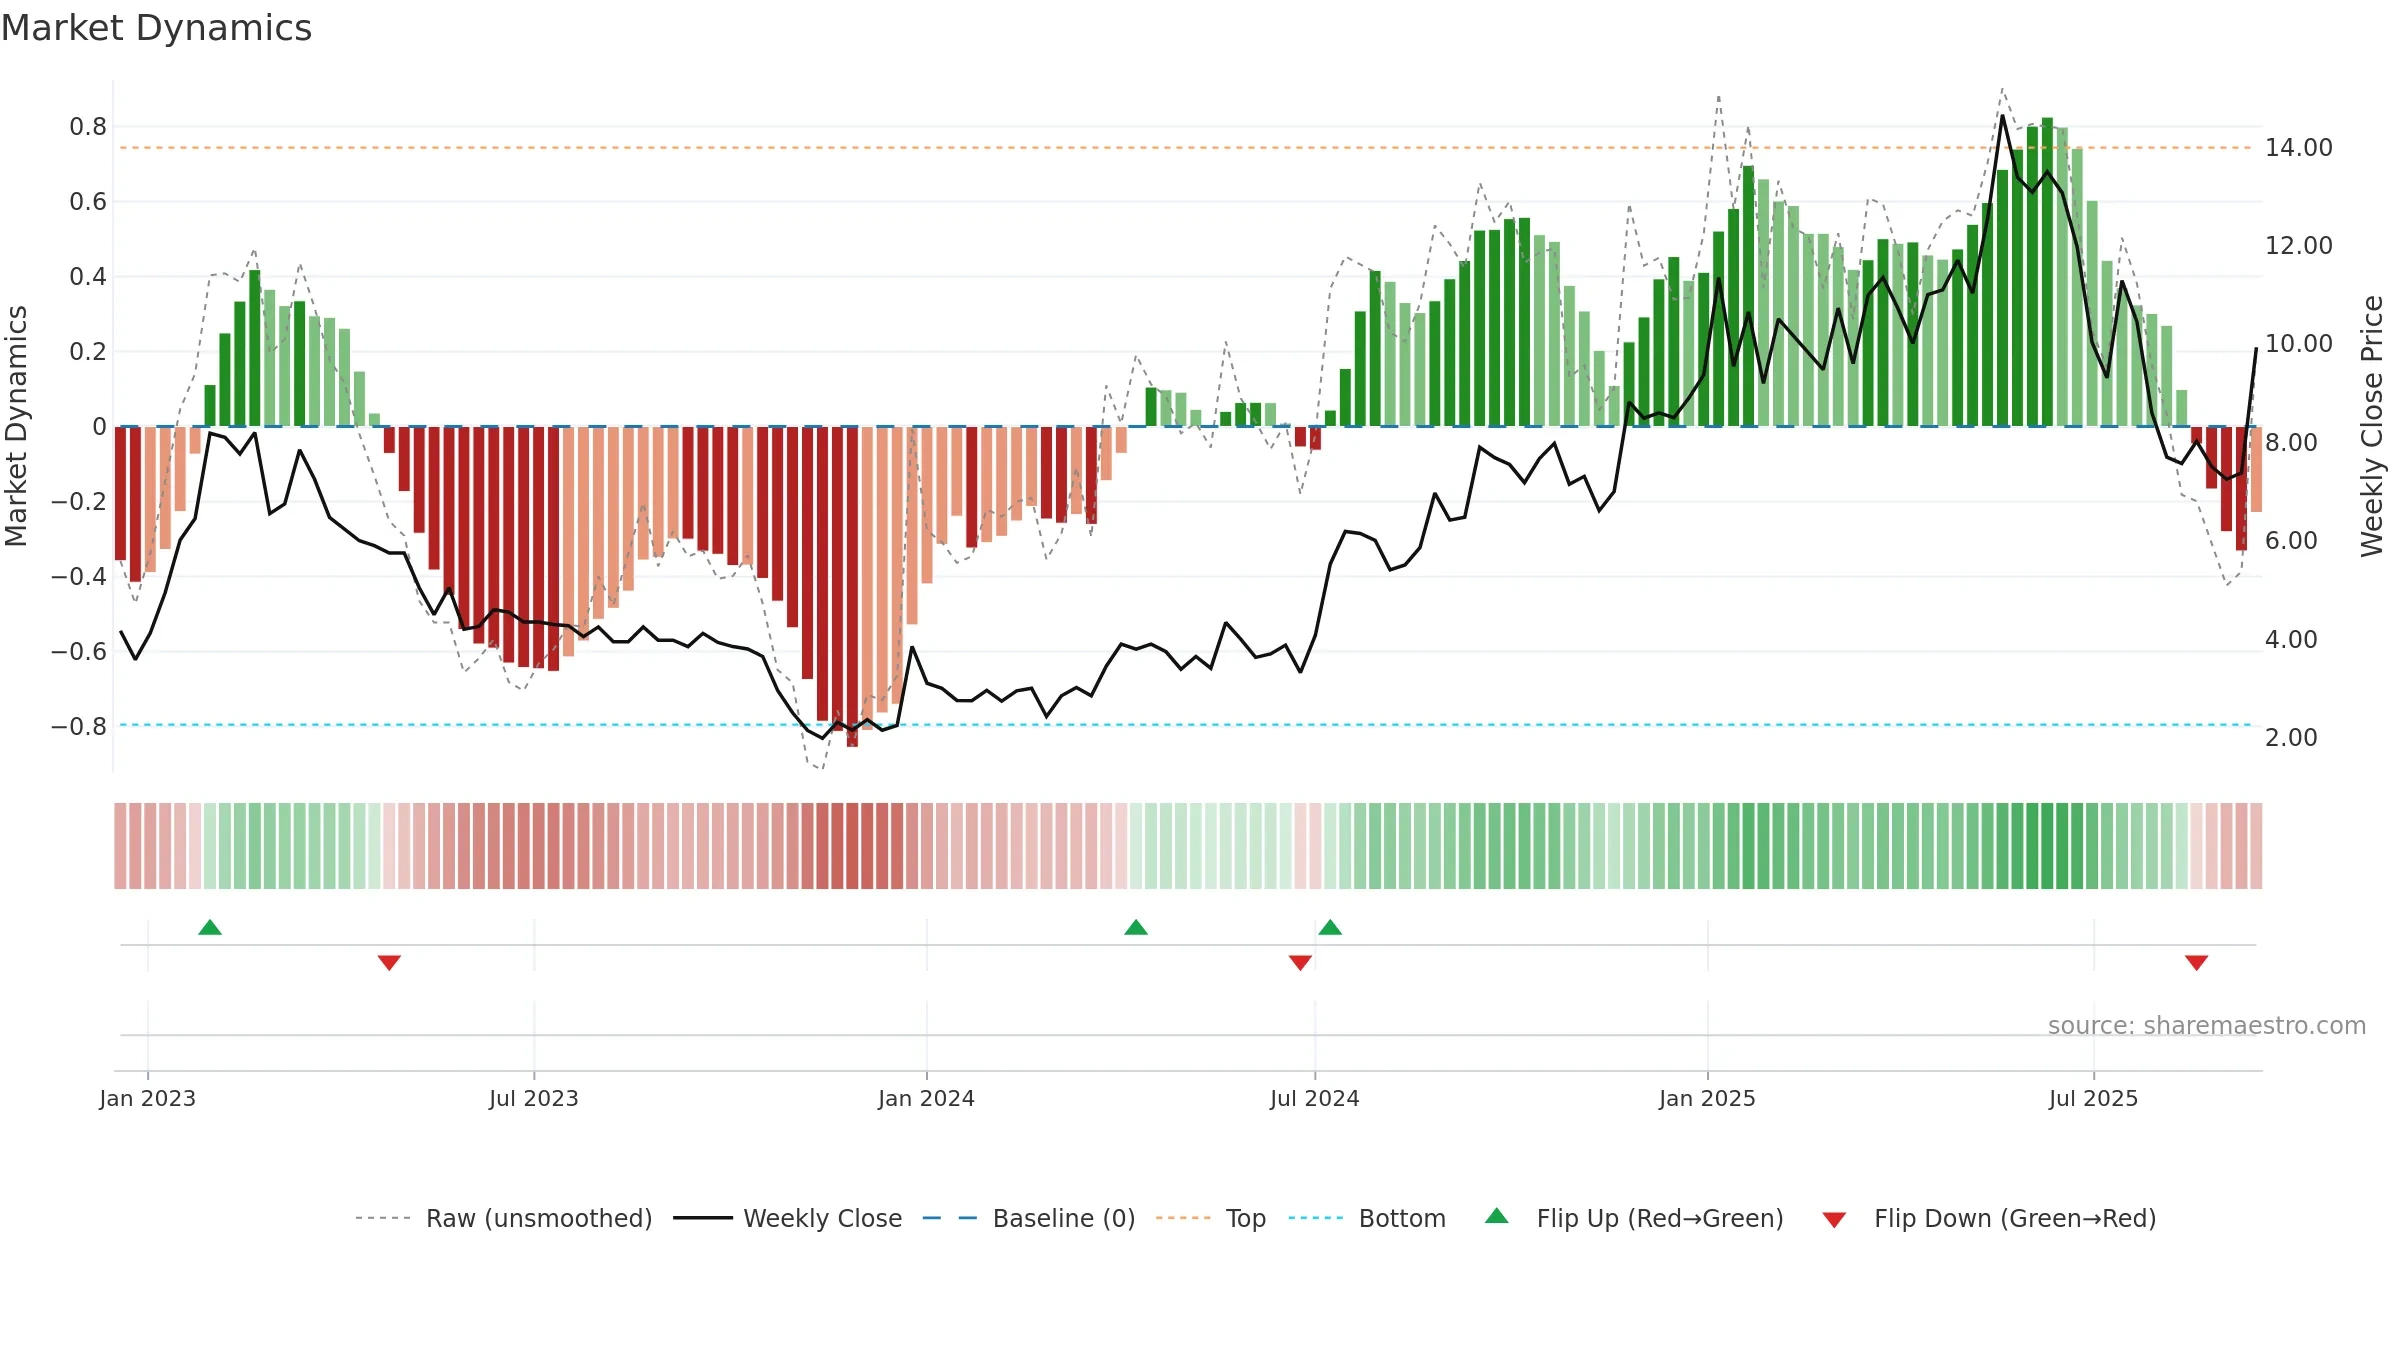
How to read this — Bearish zone with falling momentum — sellers in control. Sub-0.40 print confirms downside control.
Bias remains lower; rallies are suspect unless gauge reclaims 0.50/0.60.
Conclusion
Negative setup. ★★☆☆☆ confidence. Price window: 15. Trend: Downtrend Confirmed; gauge 19. In combination, liquidity confirms the move.
- Liquidity confirms the price trend
- Solid multi-week performance
- Bearish control with falling momentum
- Momentum is weak/falling
- Price is not above key averages
- High return volatility raises whipsaw risk
Why: Price window 15.47% over 8w. Close is 15.47% above the prior-window high. Return volatility 15.05%. Volume trend rising. Liquidity convergence with price. Trend state downtrend confirmed. 4–8w crossover bullish. Momentum bearish and falling.
Tip: Most metrics include a hover tooltip where they appear in the report.