Mercantile Ord
MRC LSE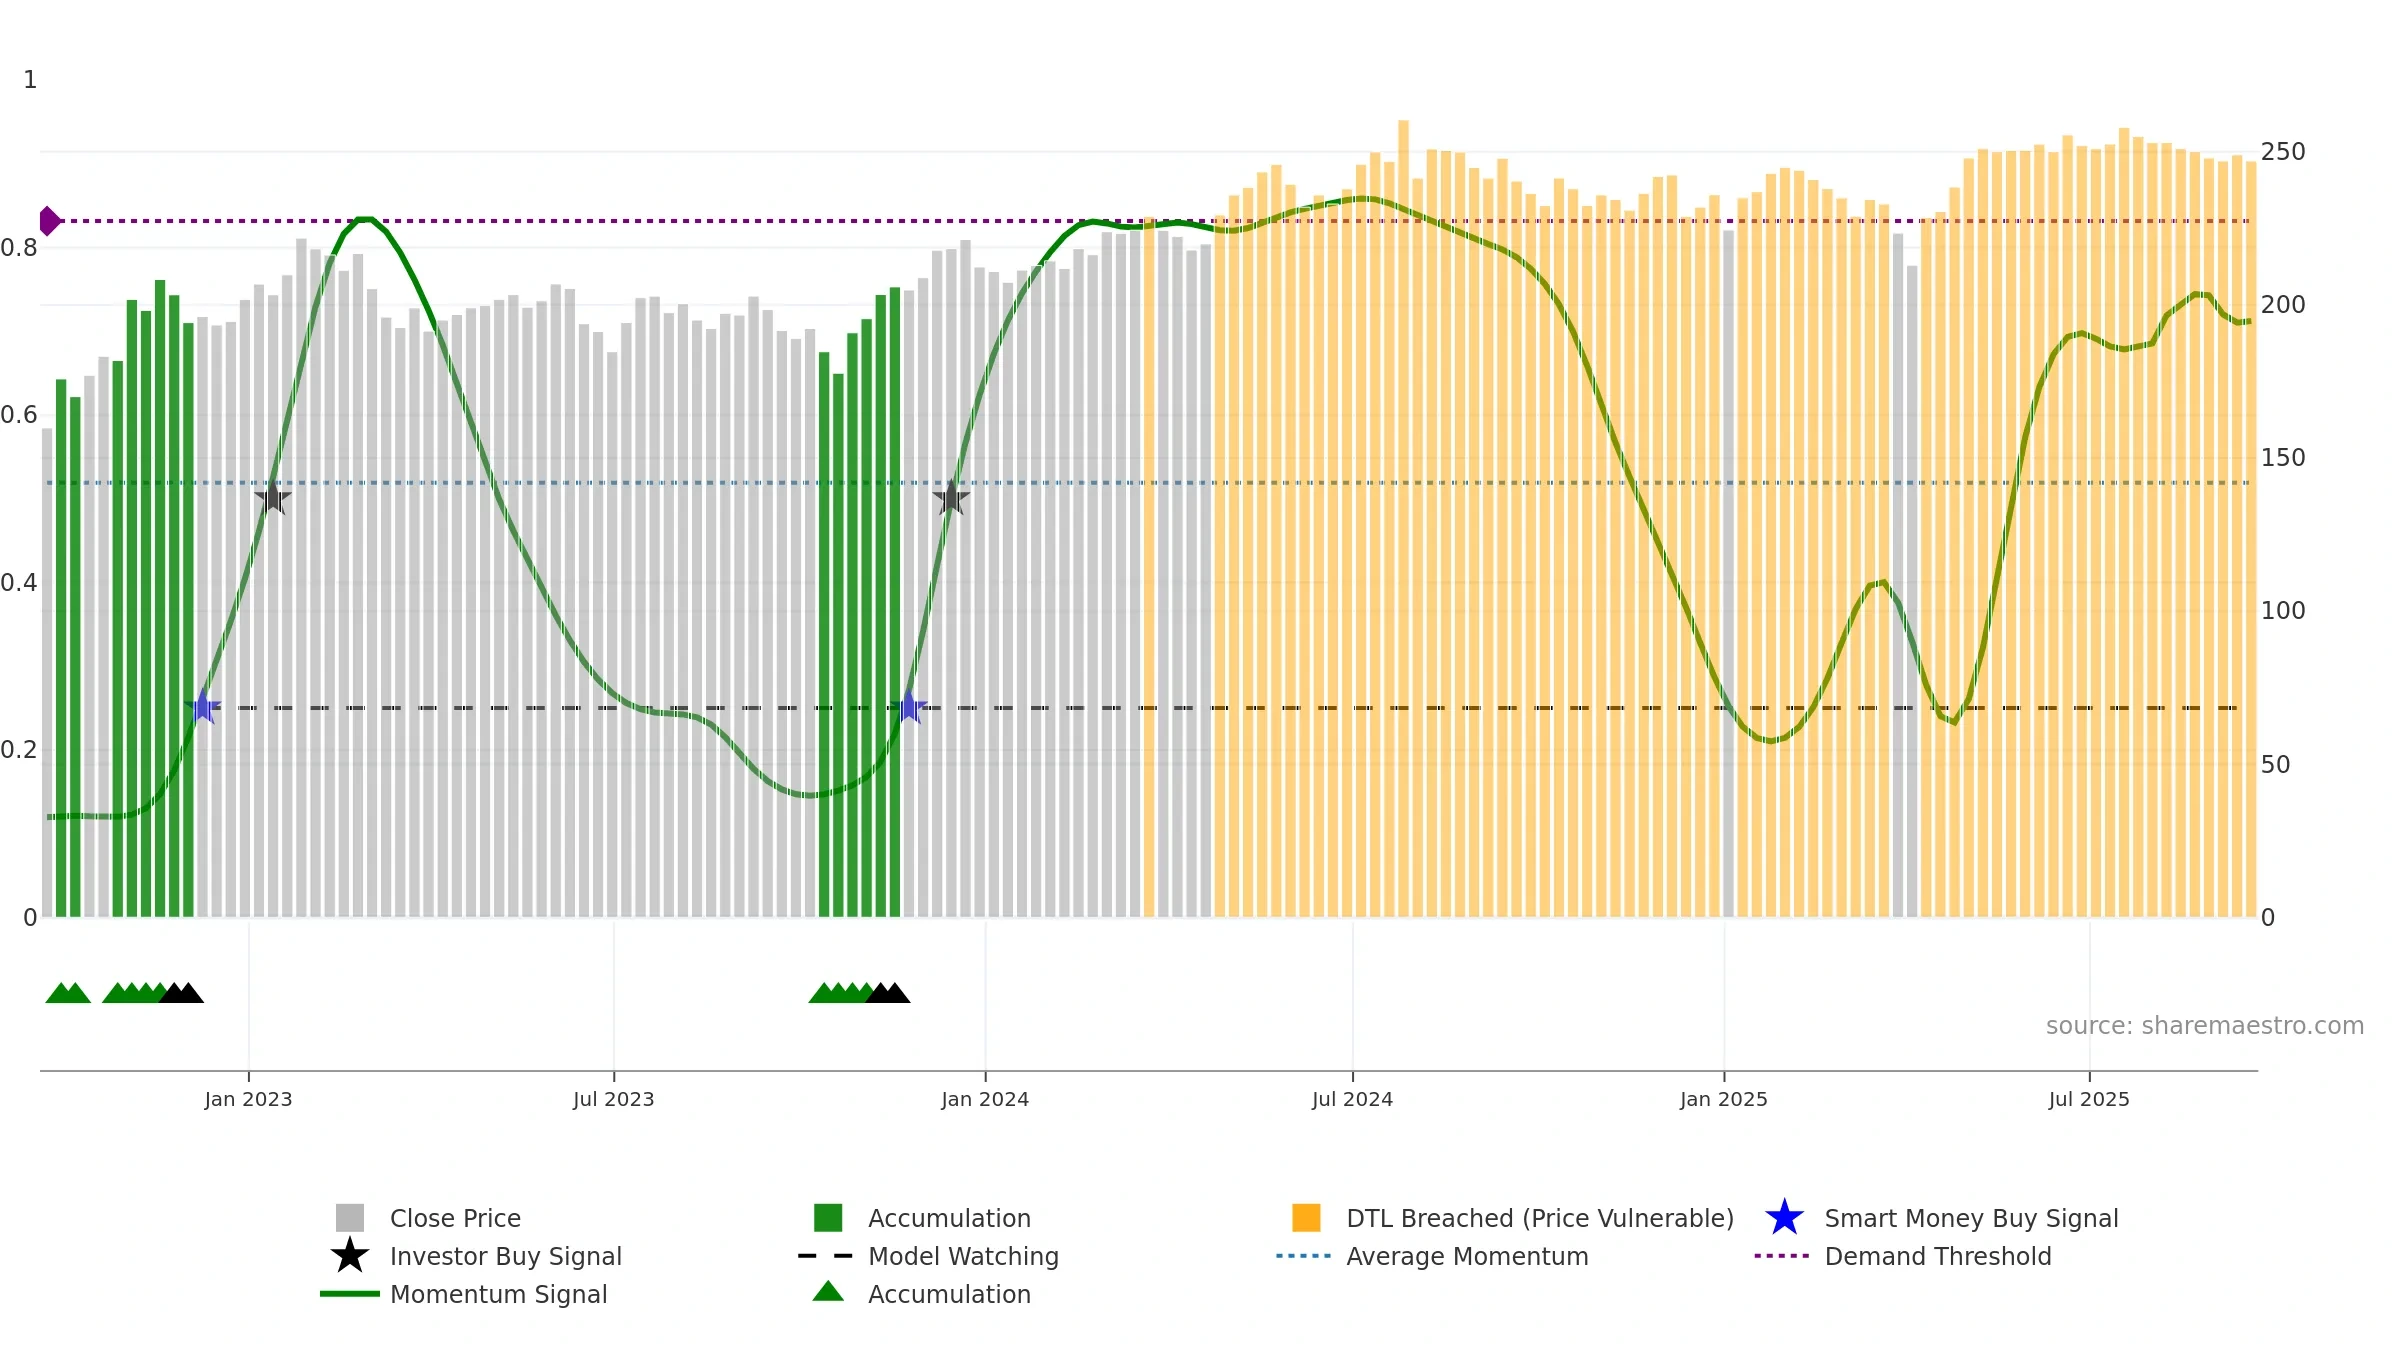
Weekly Report
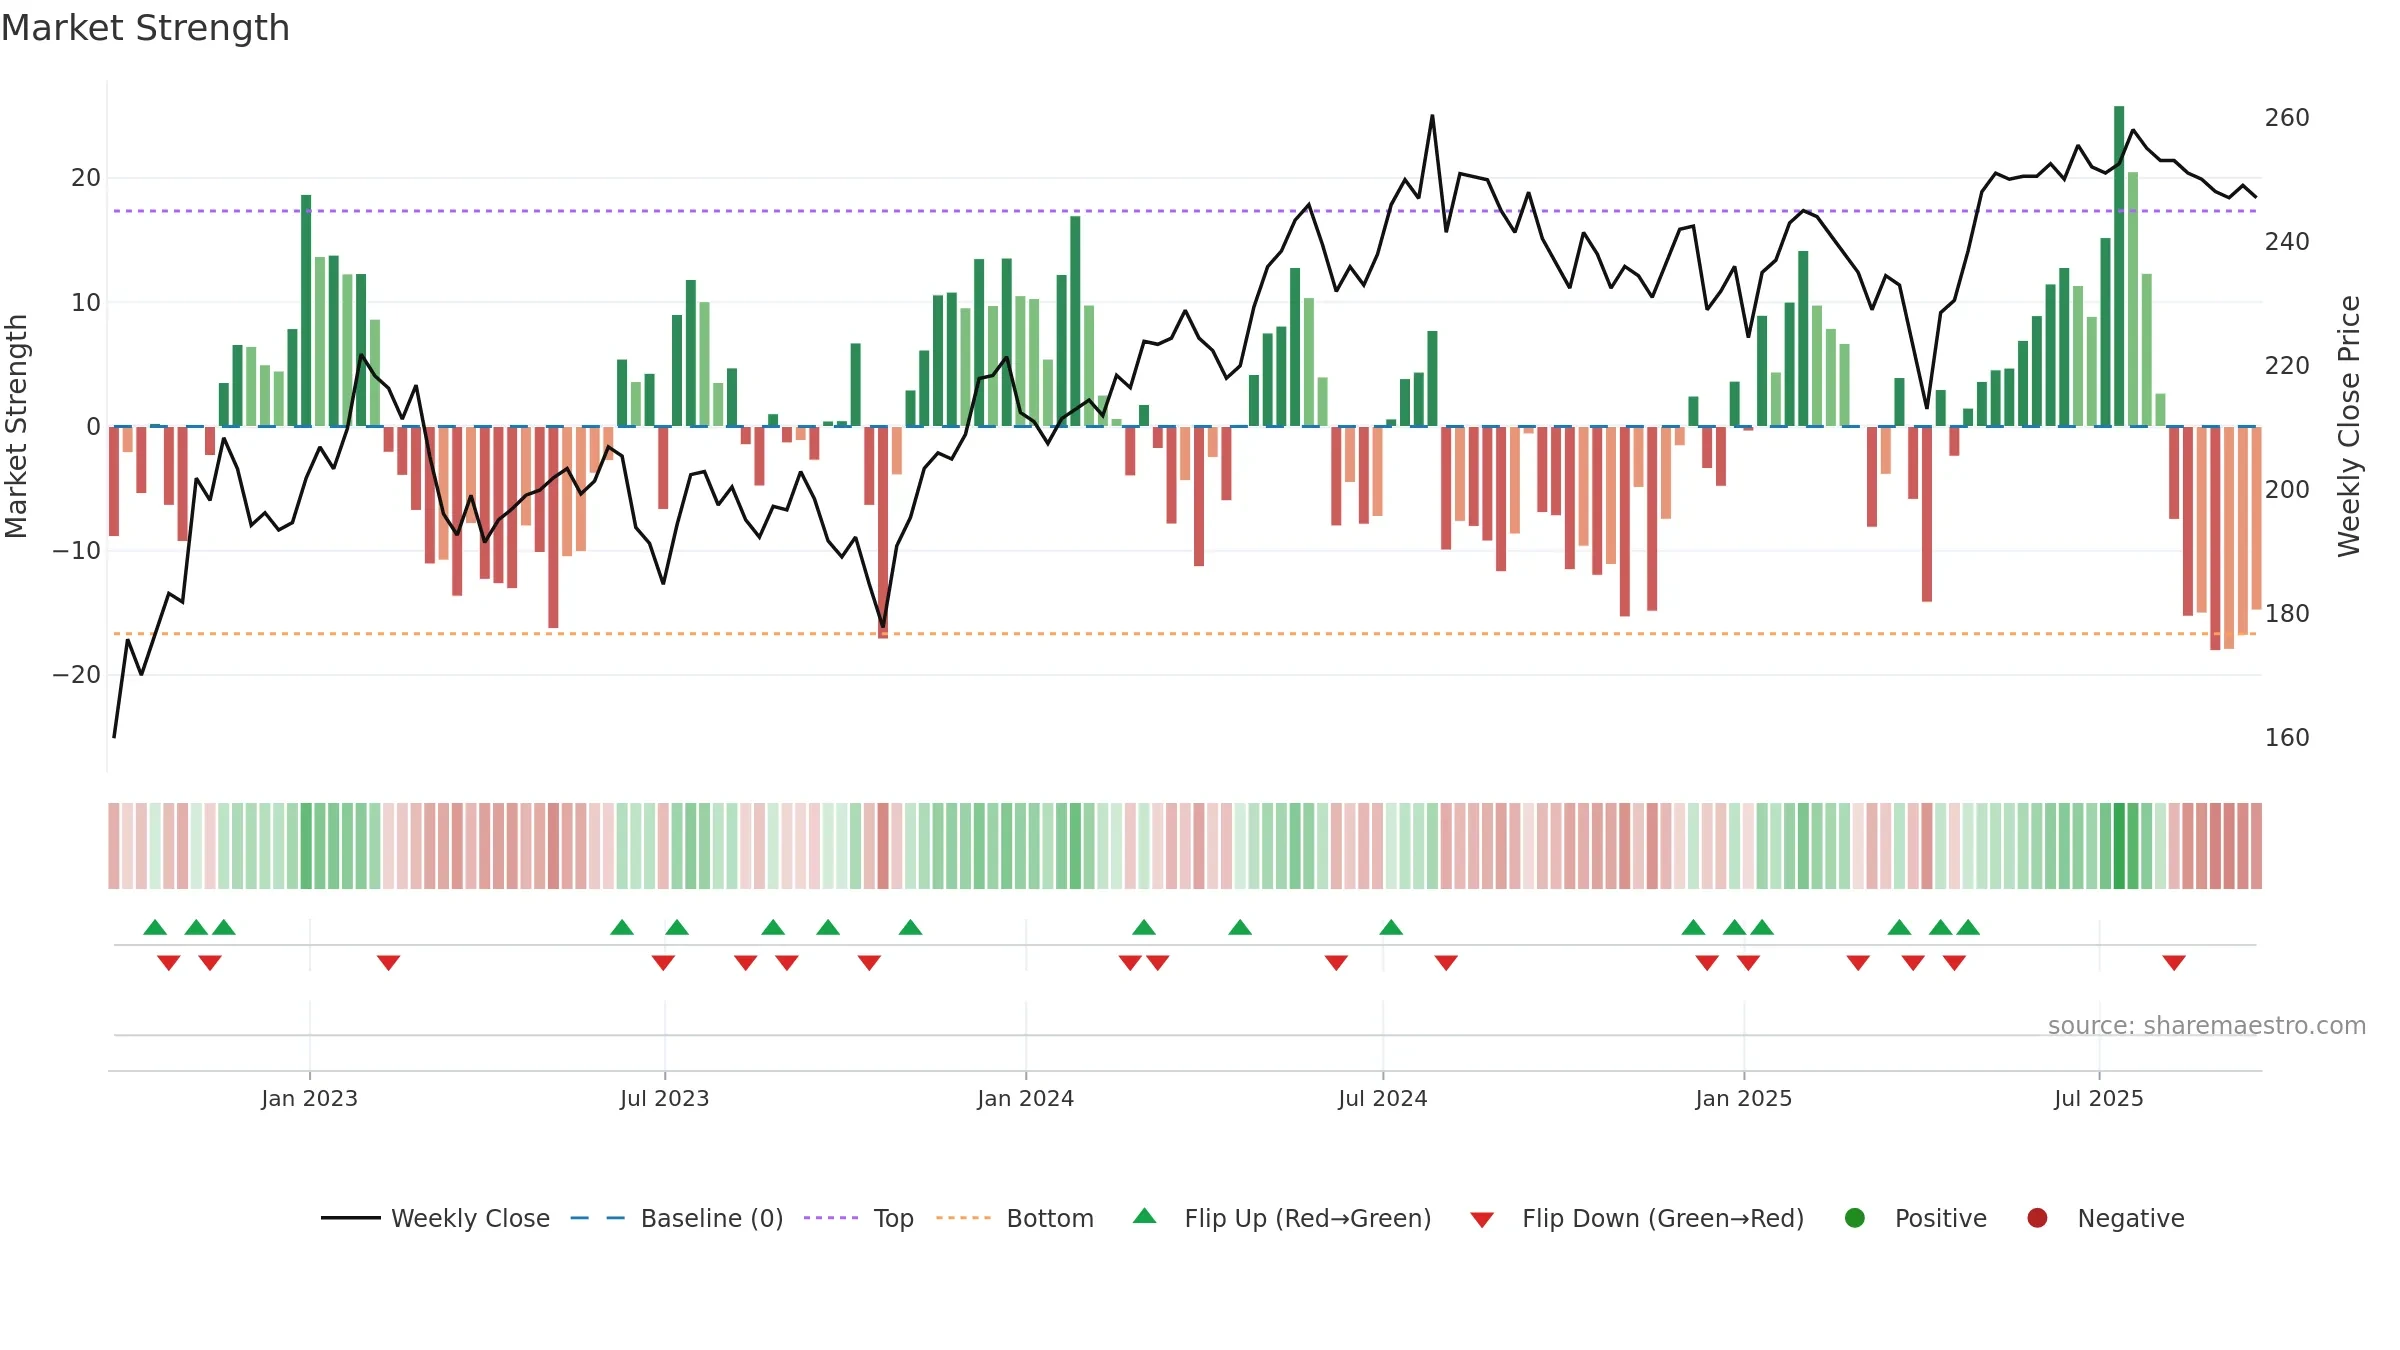
Mercantile Ord closed at 247.0000 (-0.40% WoW) . Data window ends Fri, 19 Sep 2025.
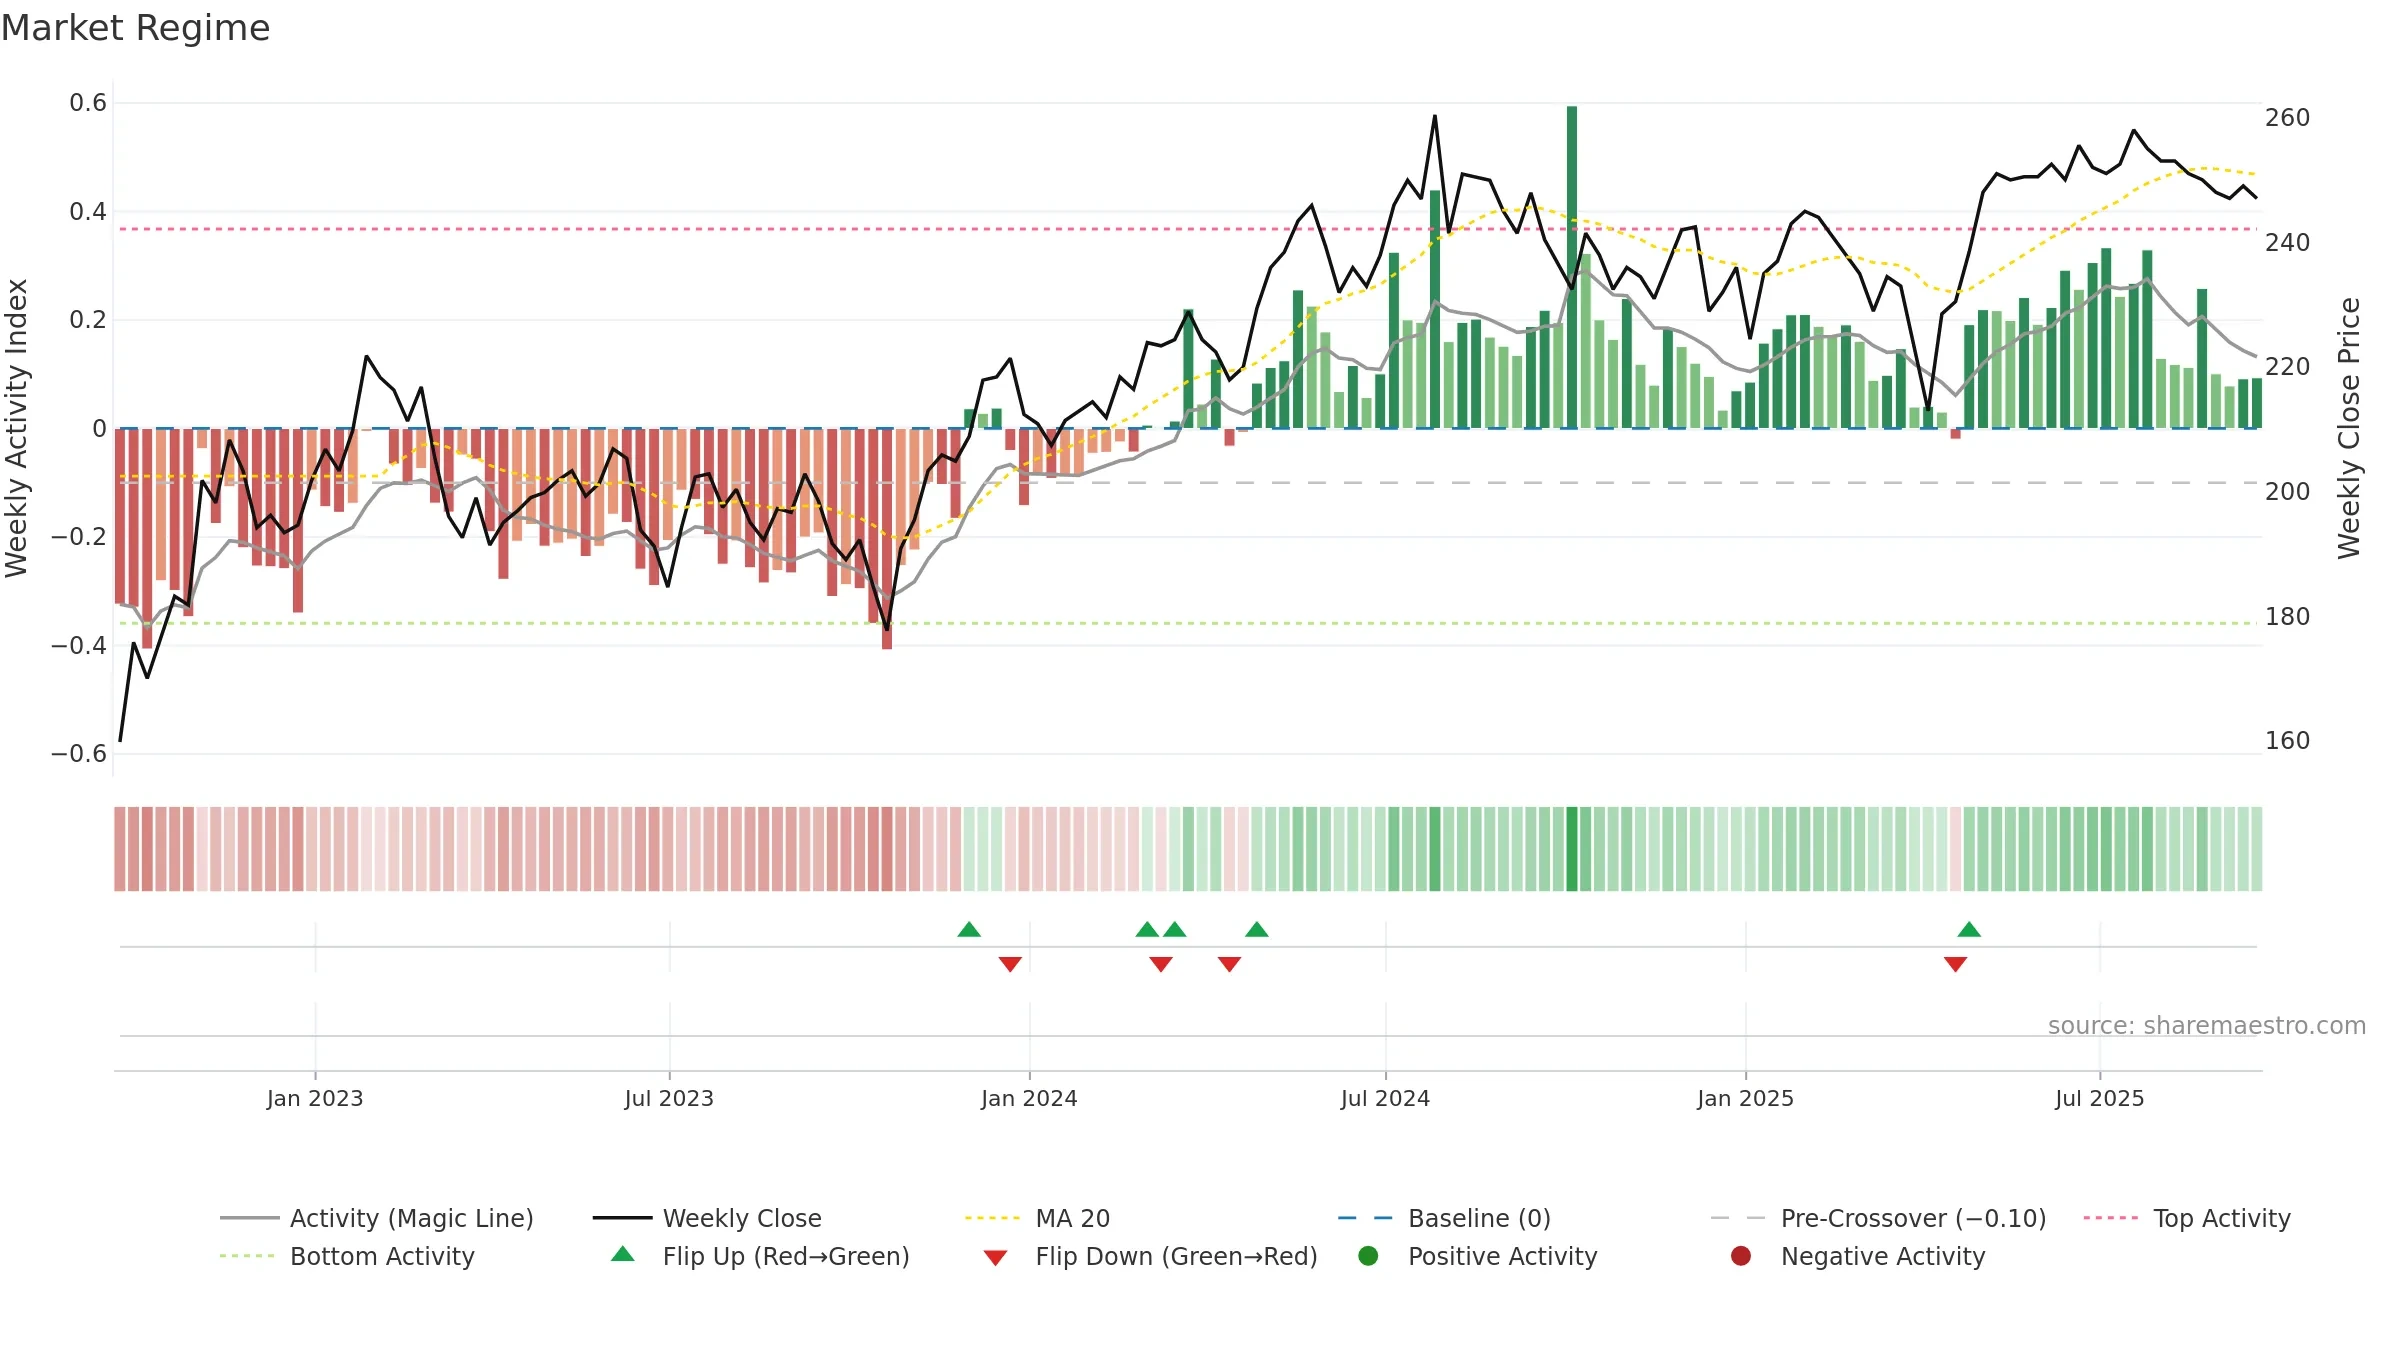
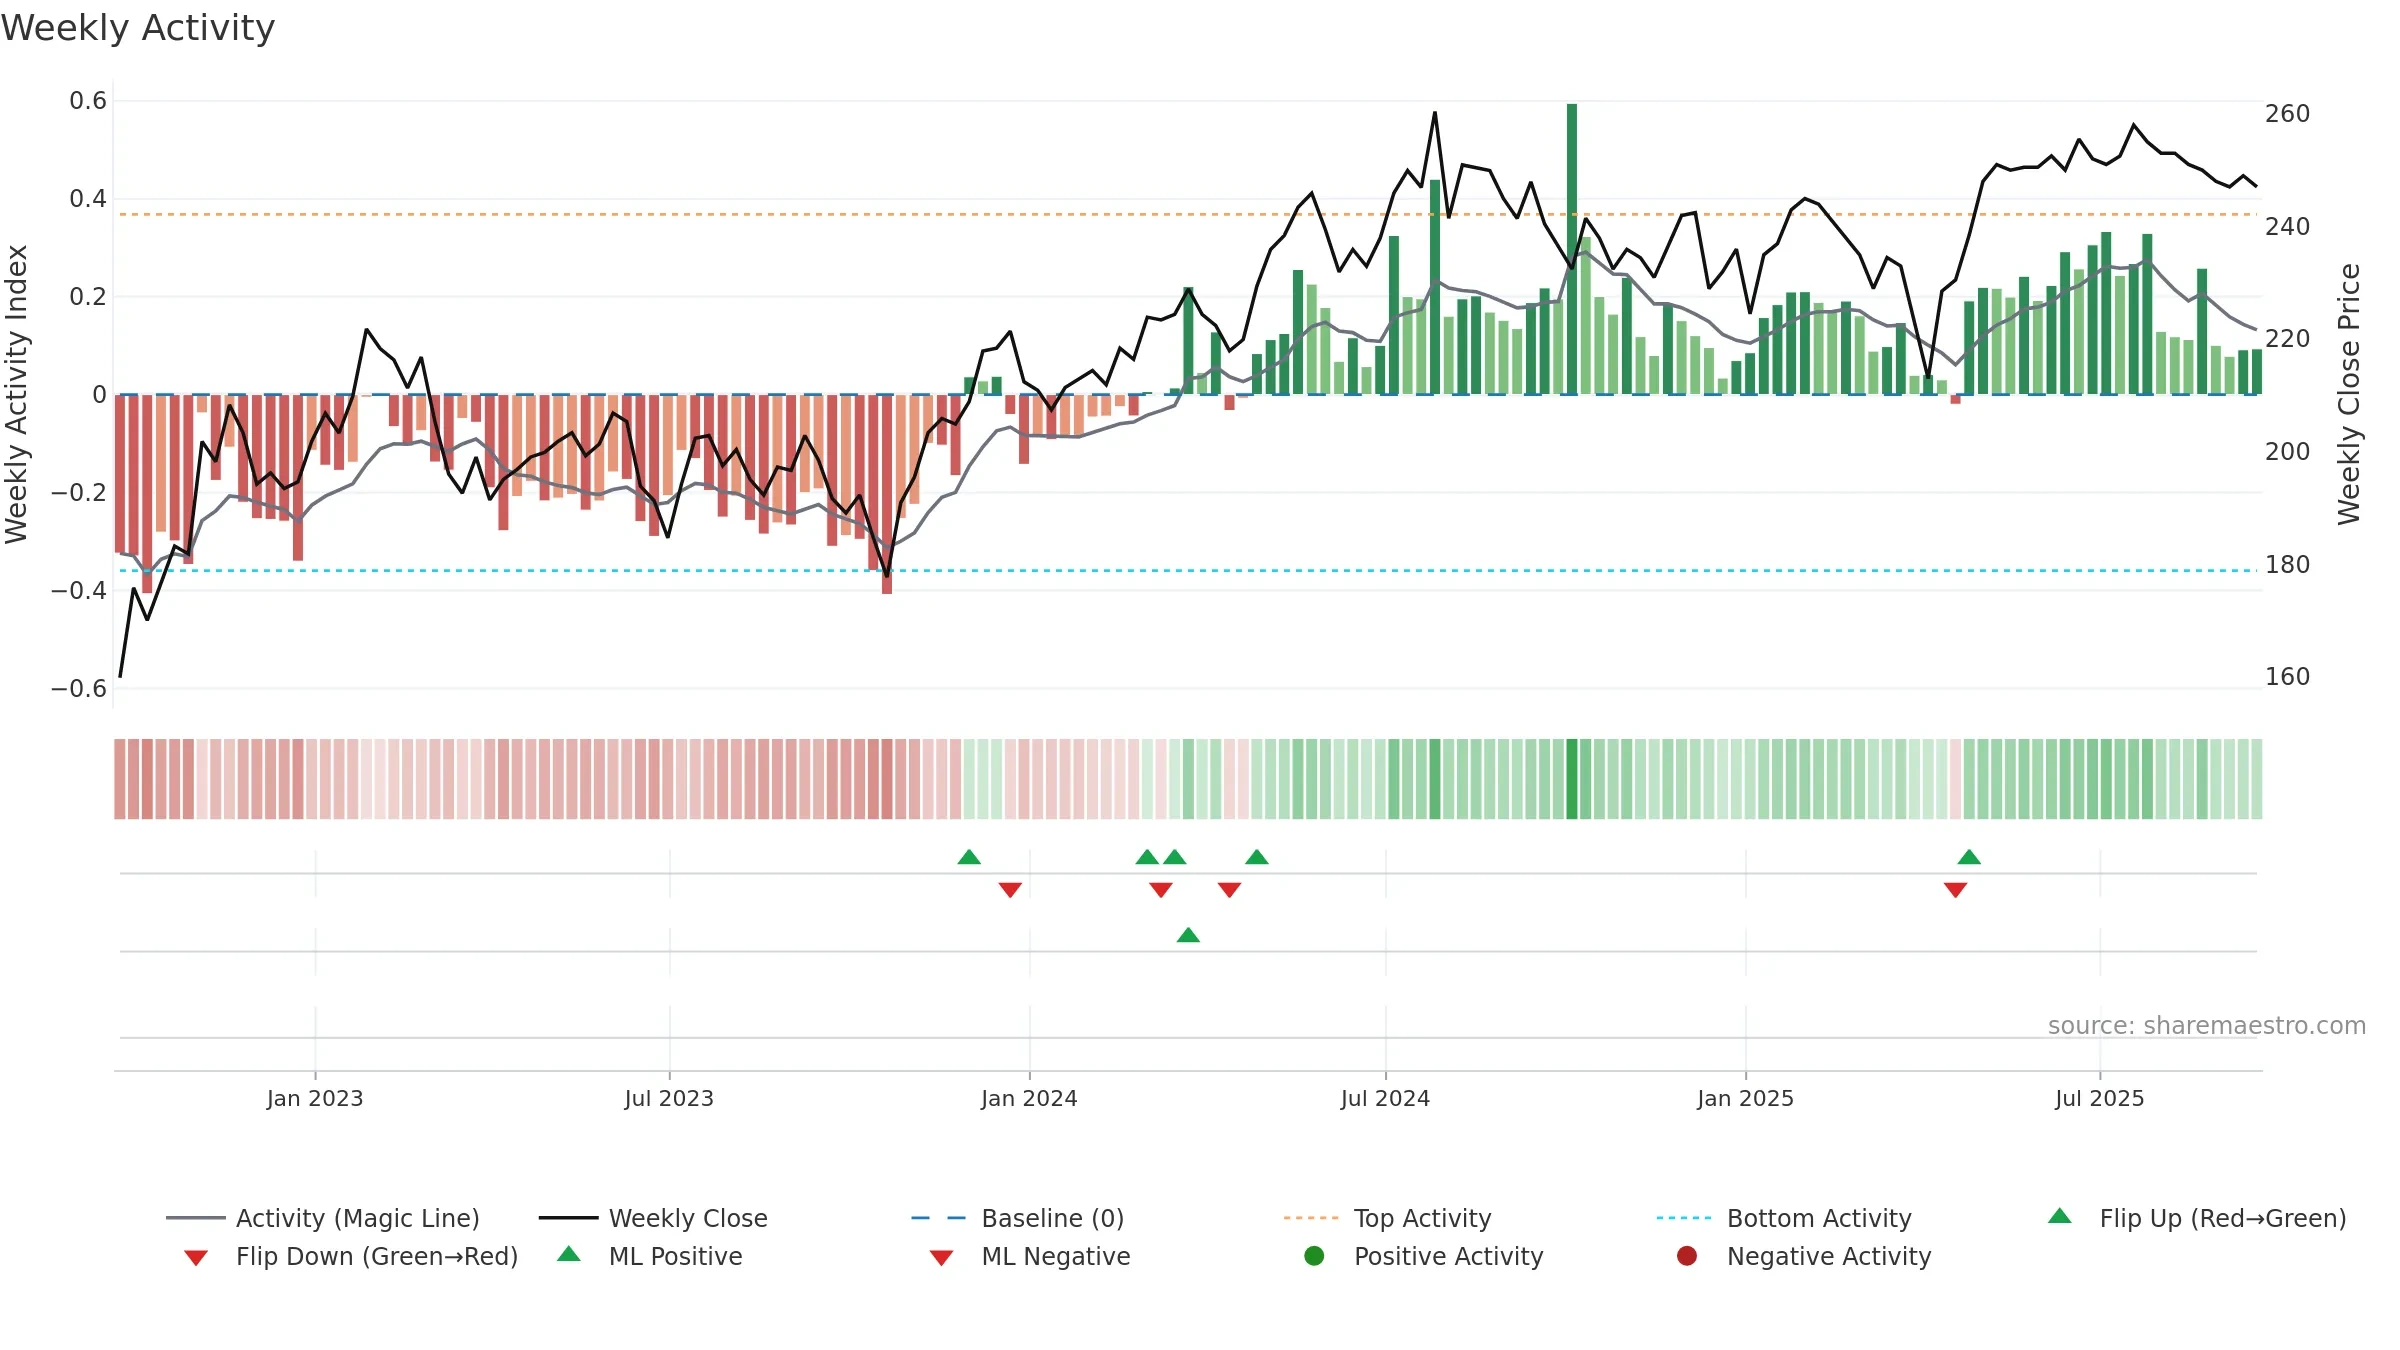
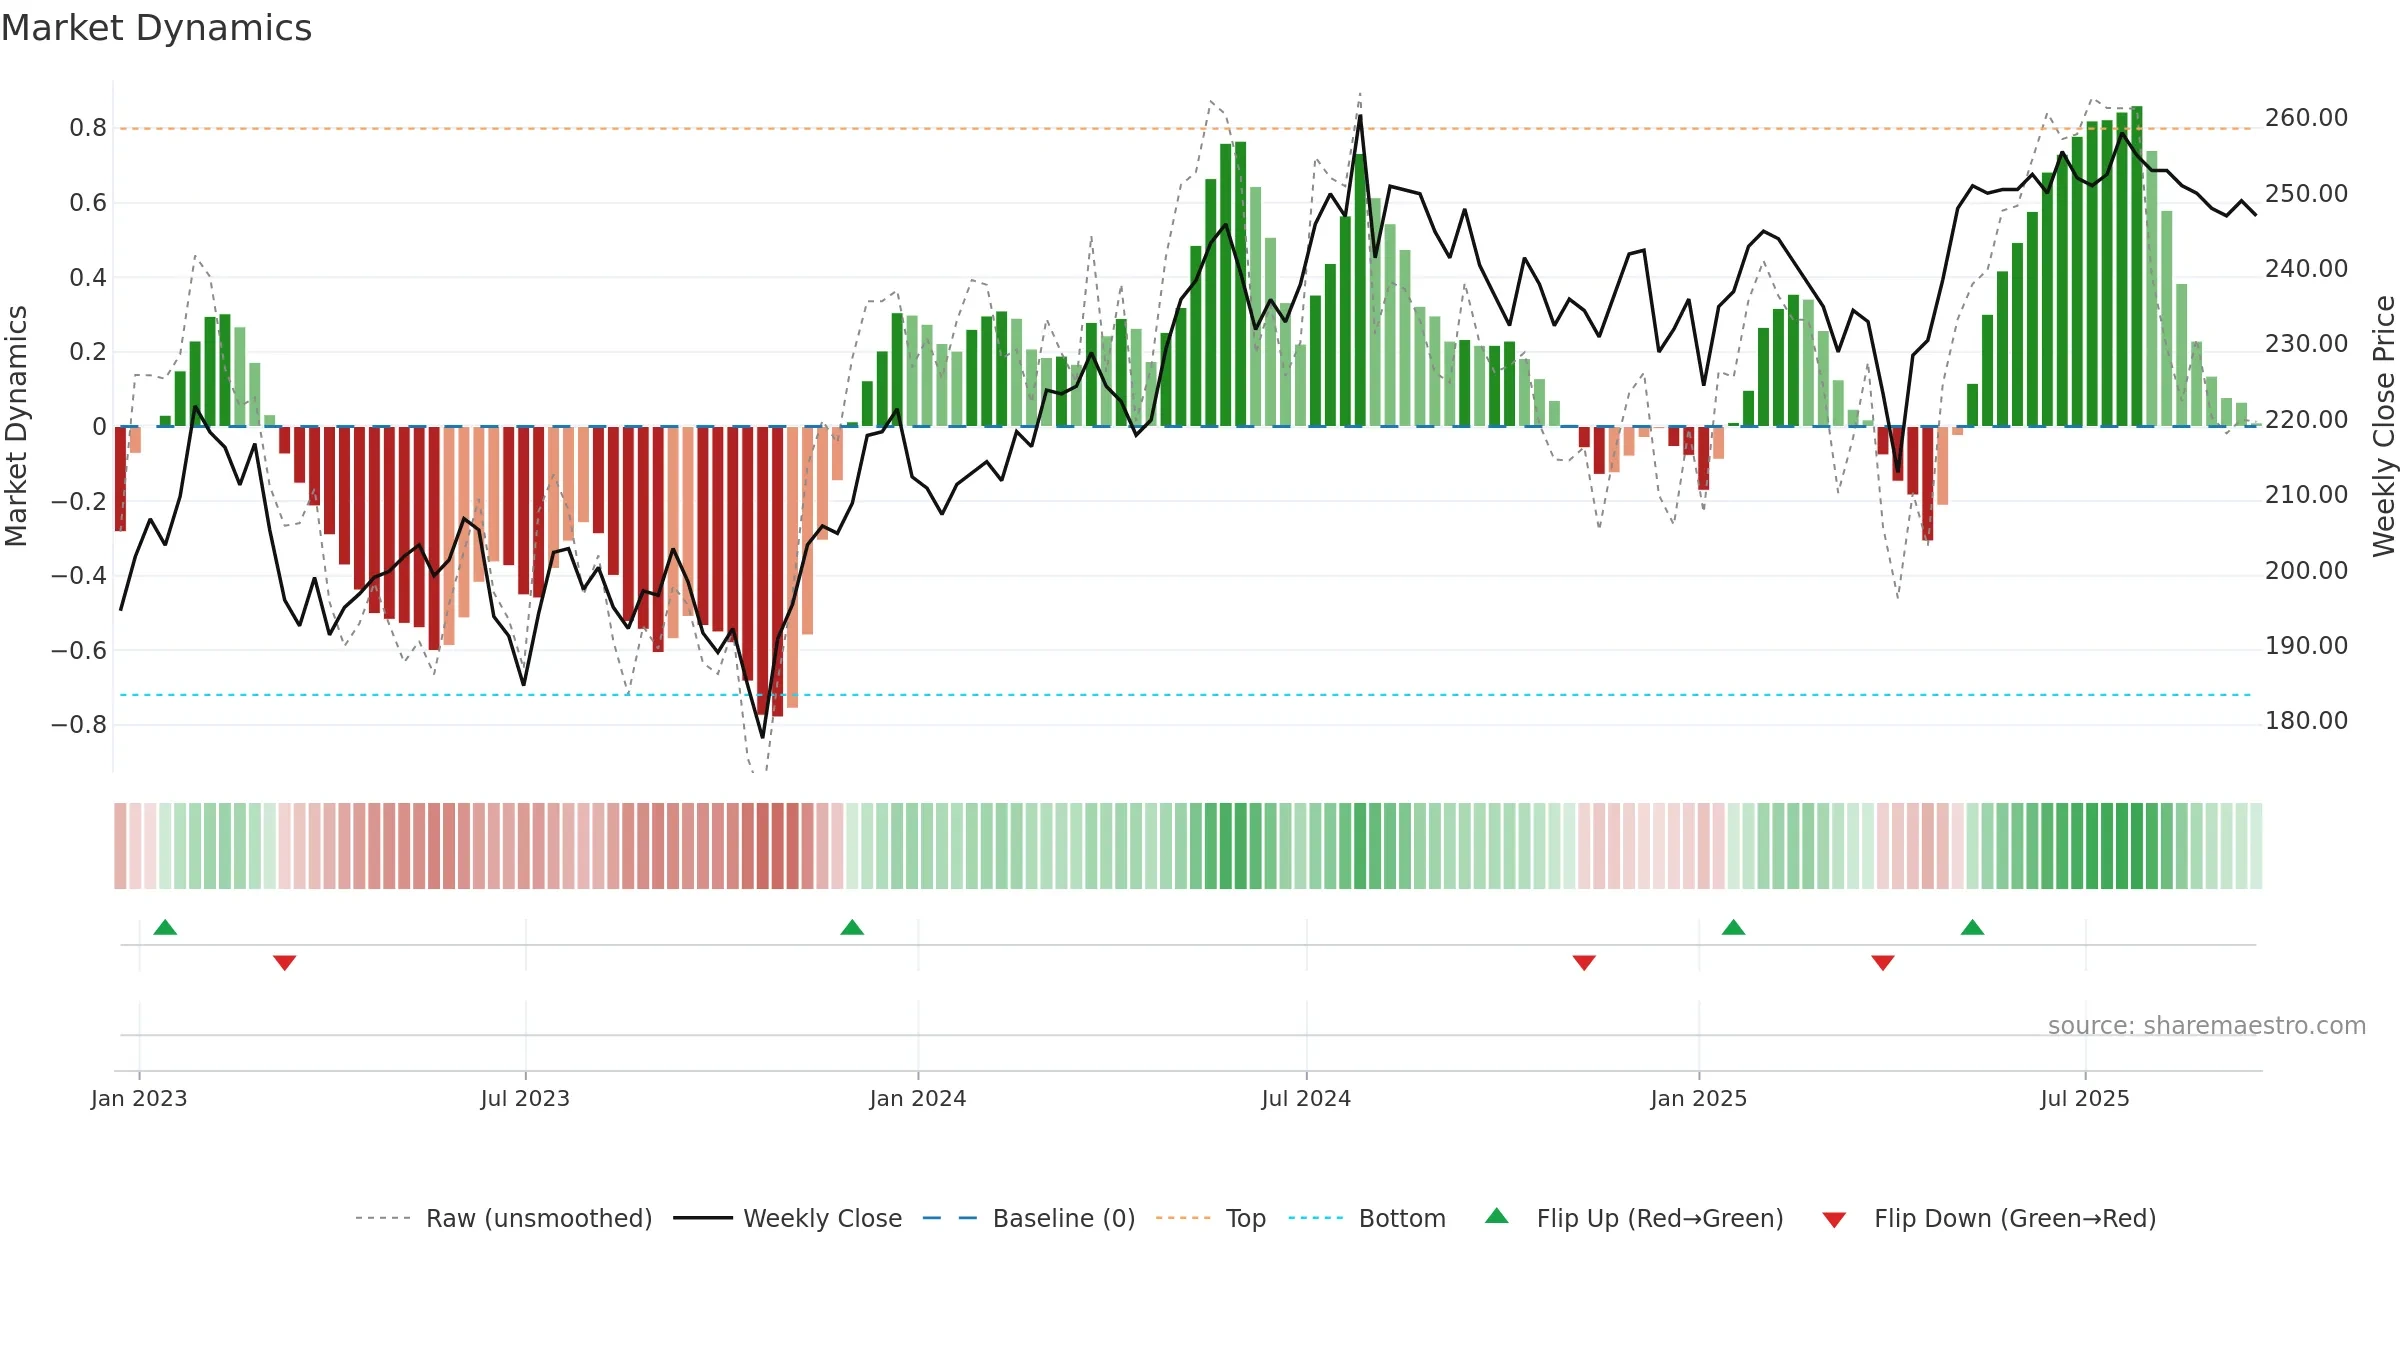
How to read this — Price slope is downward, indicating persistent supply pressure. Low weekly volatility favours steadier follow-through. Volume and price are moving in the same direction — a constructive confirmation. Returns are positively correlated with volume — strength tends to arrive on higher activity.
Down-slope argues for patience; rallies can fade sooner unless participation improves.
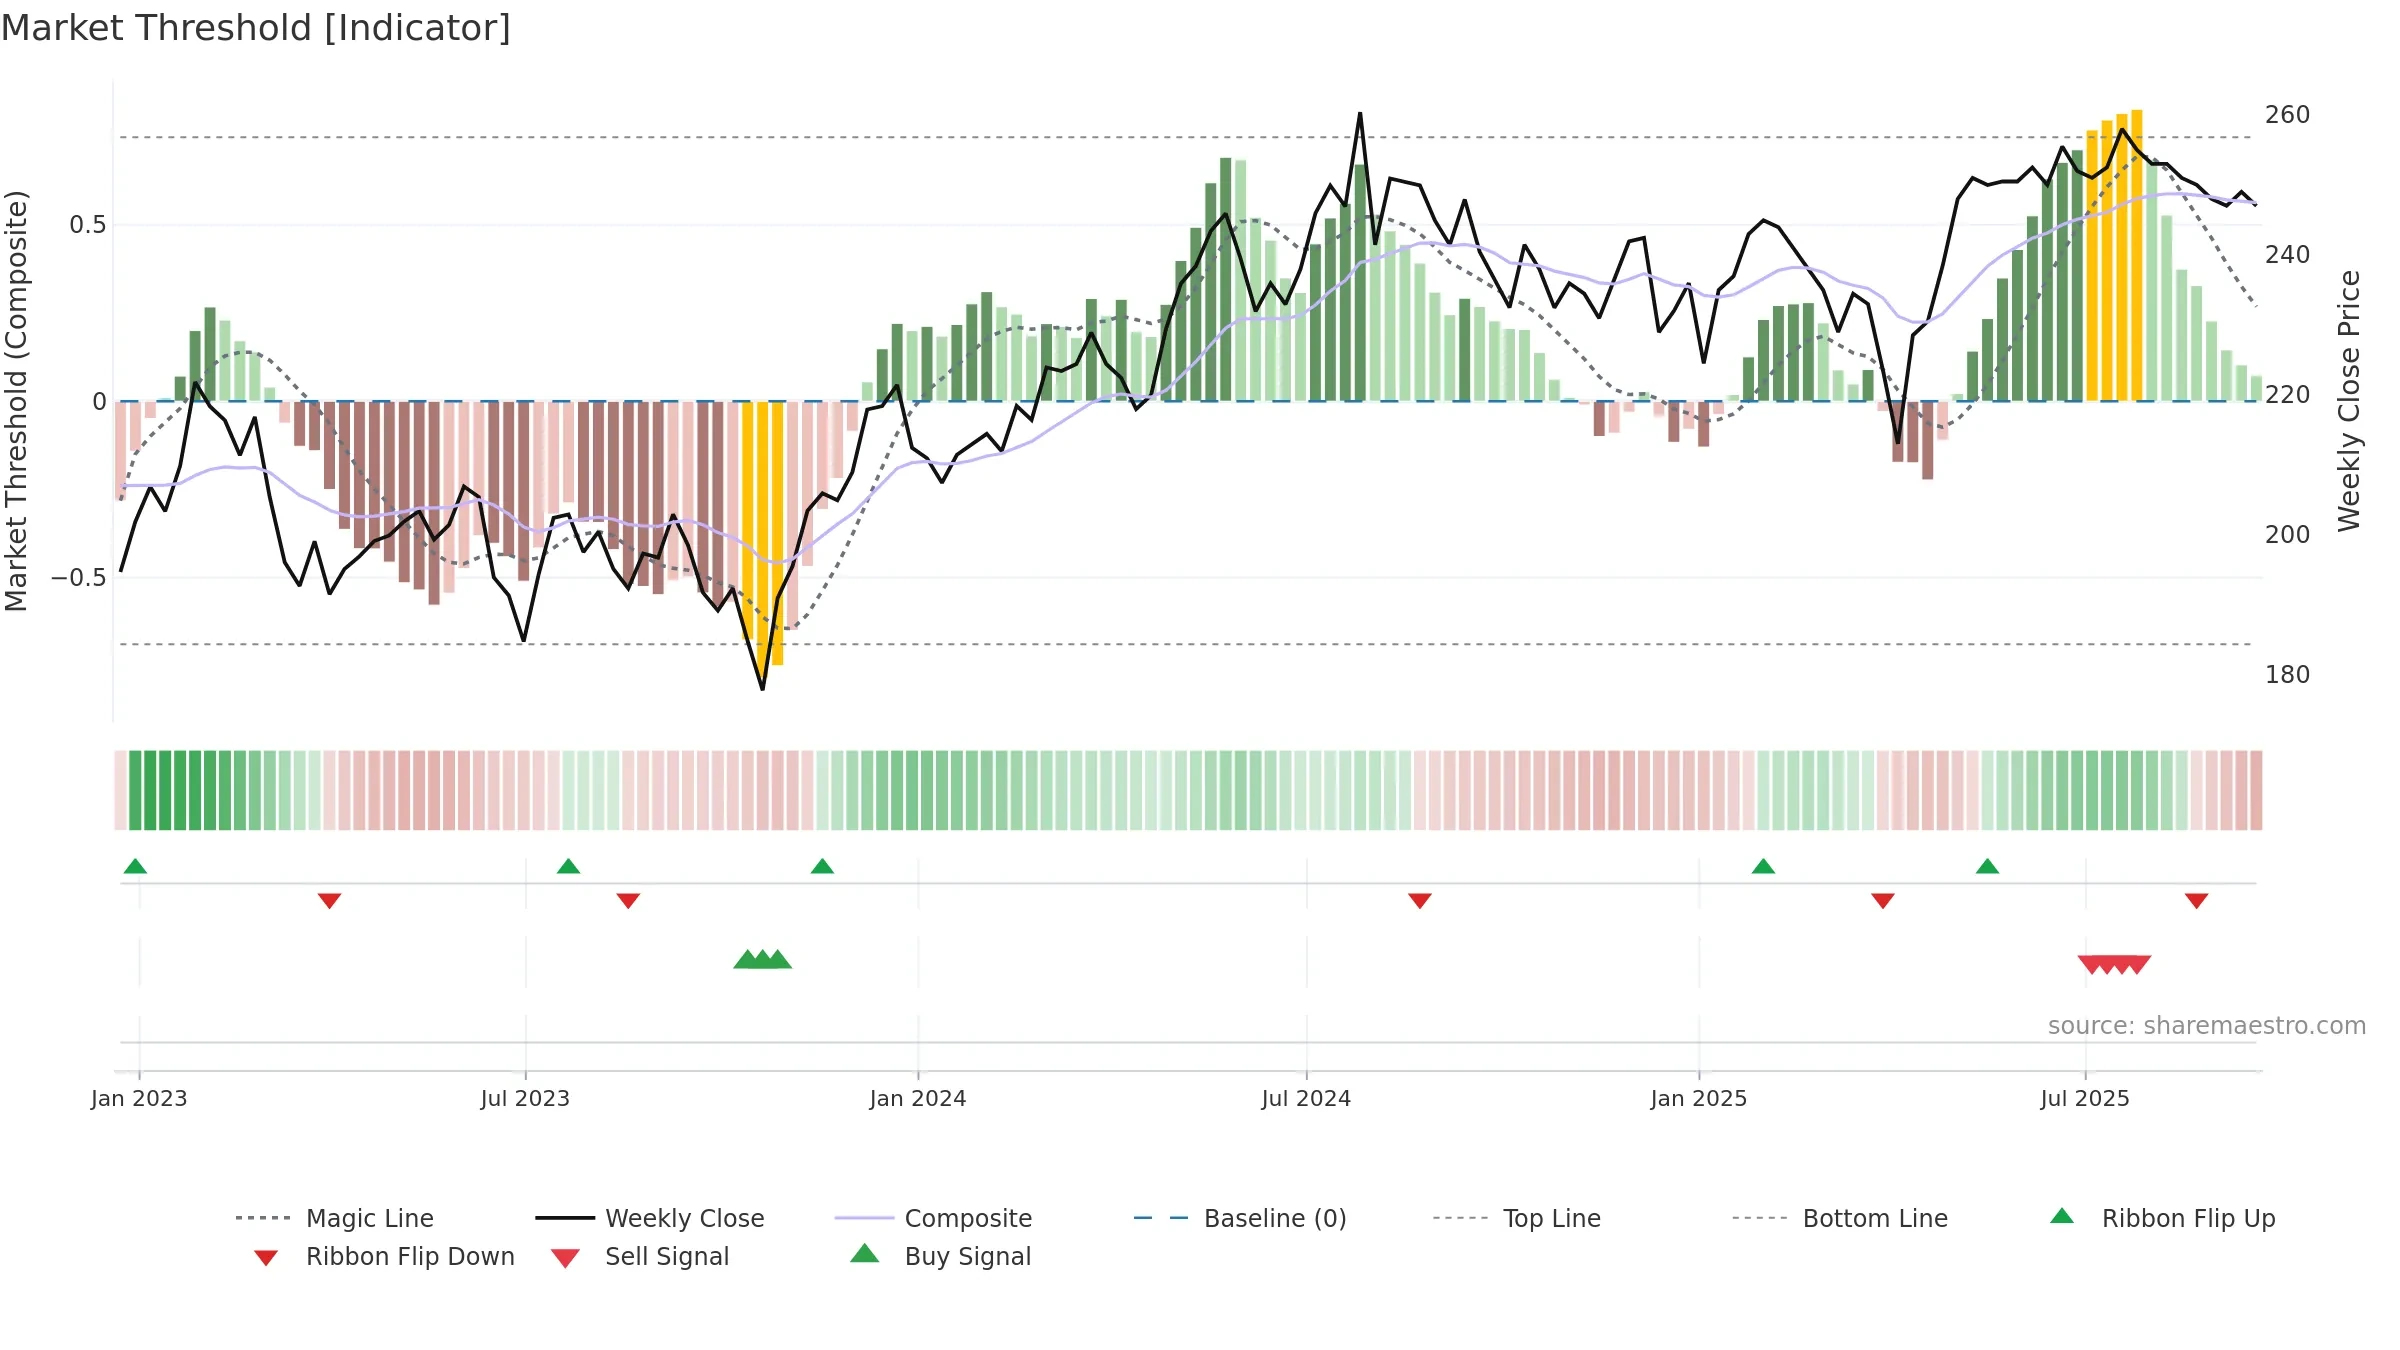
Gauge maps the trend signal to a 0–100 scale.
How to read this — Gauge is elevated but momentum is rolling over; topping risk is rising.
Stay alert: protect gains or seek confirmation before adding risk.
Conclusion
Neutral setup. ★★★☆☆ confidence. Price window: -2. Trend: Uptrend at Risk; gauge 71. In combination, liquidity confirms the move.
- Liquidity confirms the price trend
- Low return volatility supports durability
- High-level but rolling over (topping risk)
- Price is not above key averages
- Negative multi-week performance
Why: Price window -2.37% over 8w. Close is -2.37% below the prior-window high. Return volatility 0.44%. Volume trend falling. Liquidity convergence with price. Trend state uptrend at risk. Momentum neutral and rising.
Tip: Most metrics include a hover tooltip where they appear in the report.