Spire Global, Inc.
SPIR NYSE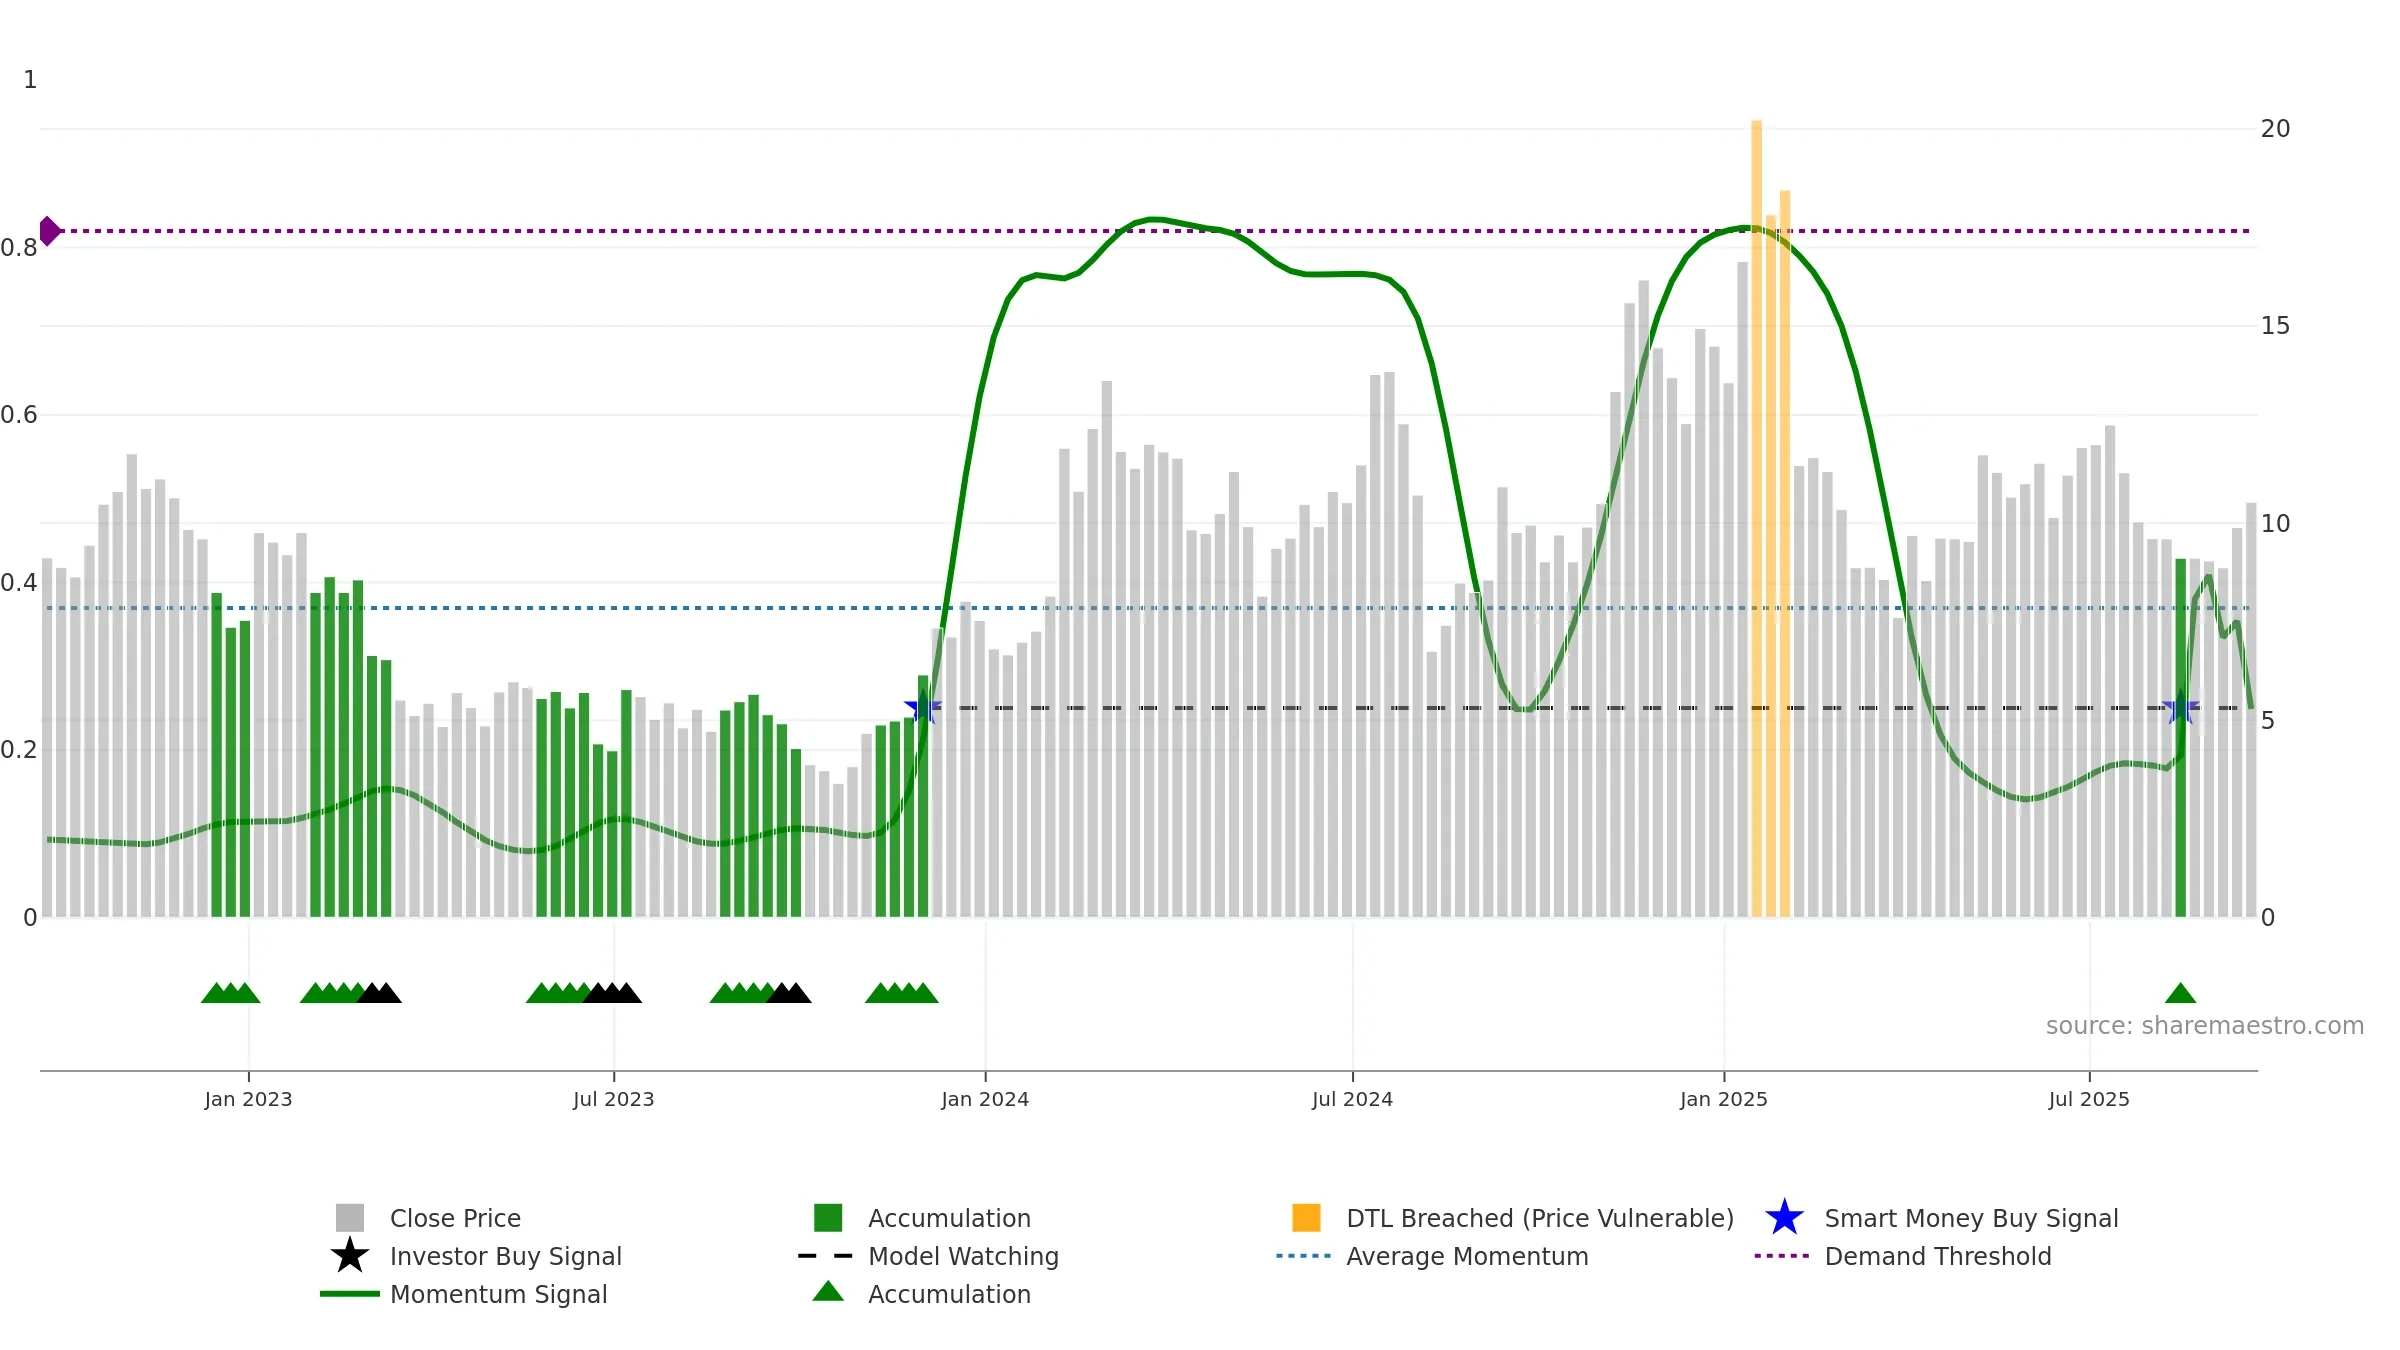
Weekly Report
Spire Global, Inc. closed at 10.5300 (4.26% WoW) . Data window ends Fri, 19 Sep 2025.
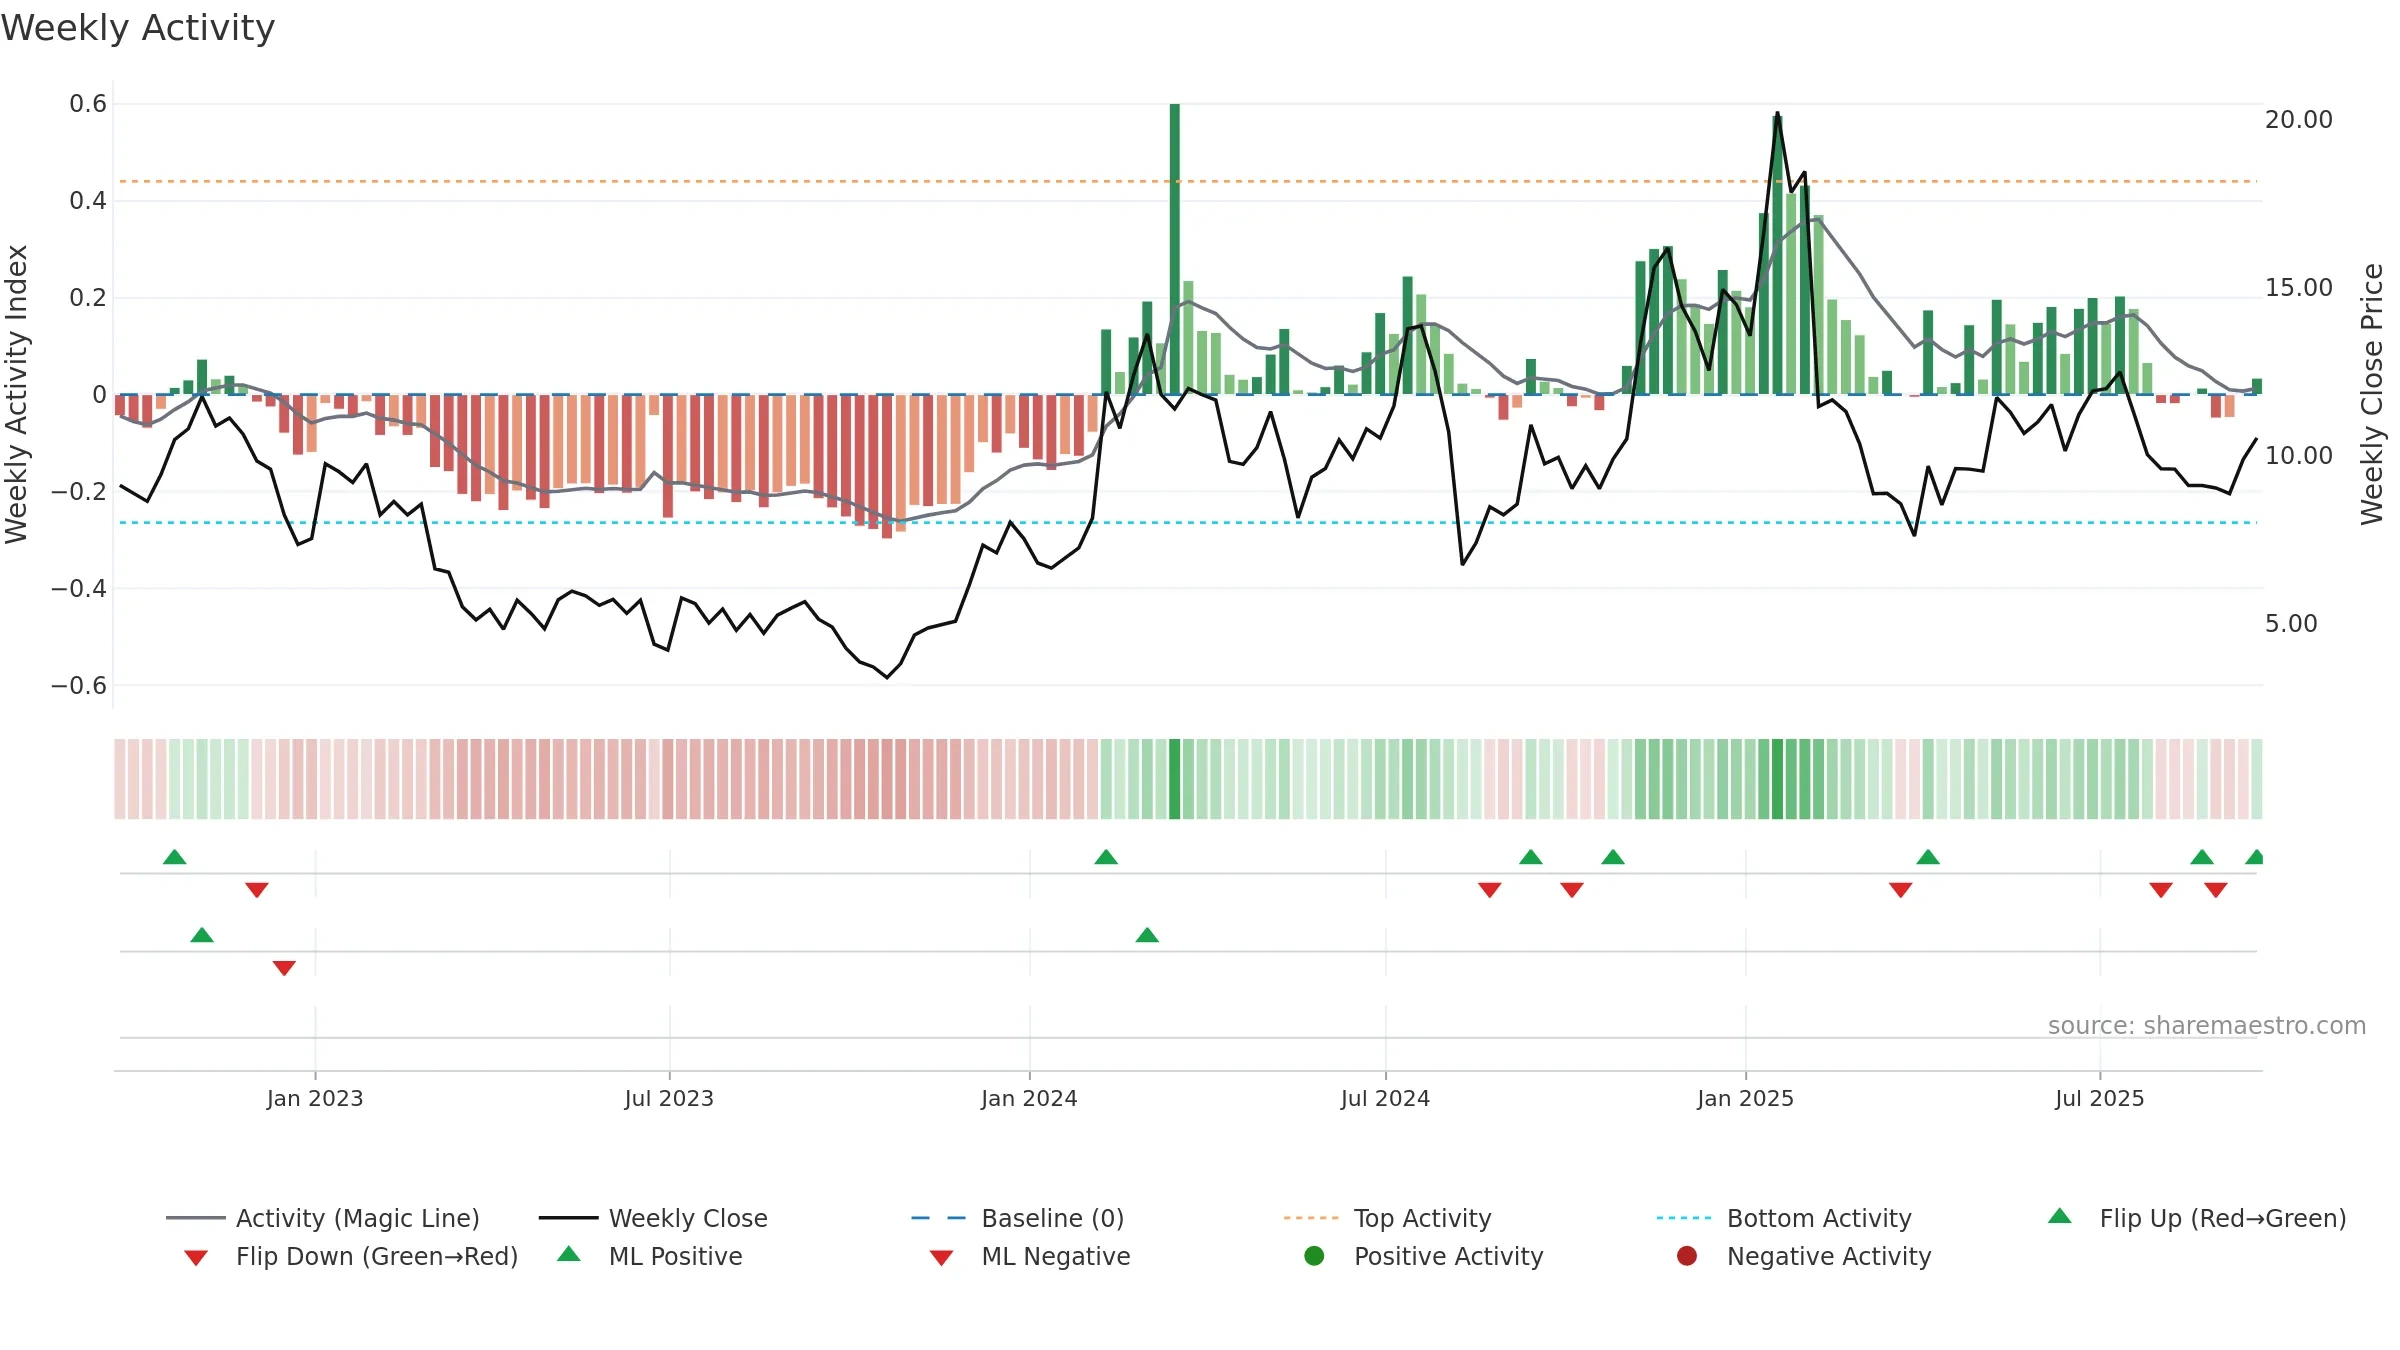
How to read this — Price slope is upward, indicating persistent buying over the window. Elevated weekly volatility increases whipsaw risk. Volume trend diverges from price — watch for fatigue or rotation. Fresh short-term crossover improves near-term tone. Price holds above key averages, indicating constructive participation.
Up-slope supports buying interest; pullbacks may be contained if activity stays firm. Because liquidity isn’t confirming, prefer evidence of fresh demand before chasing moves.
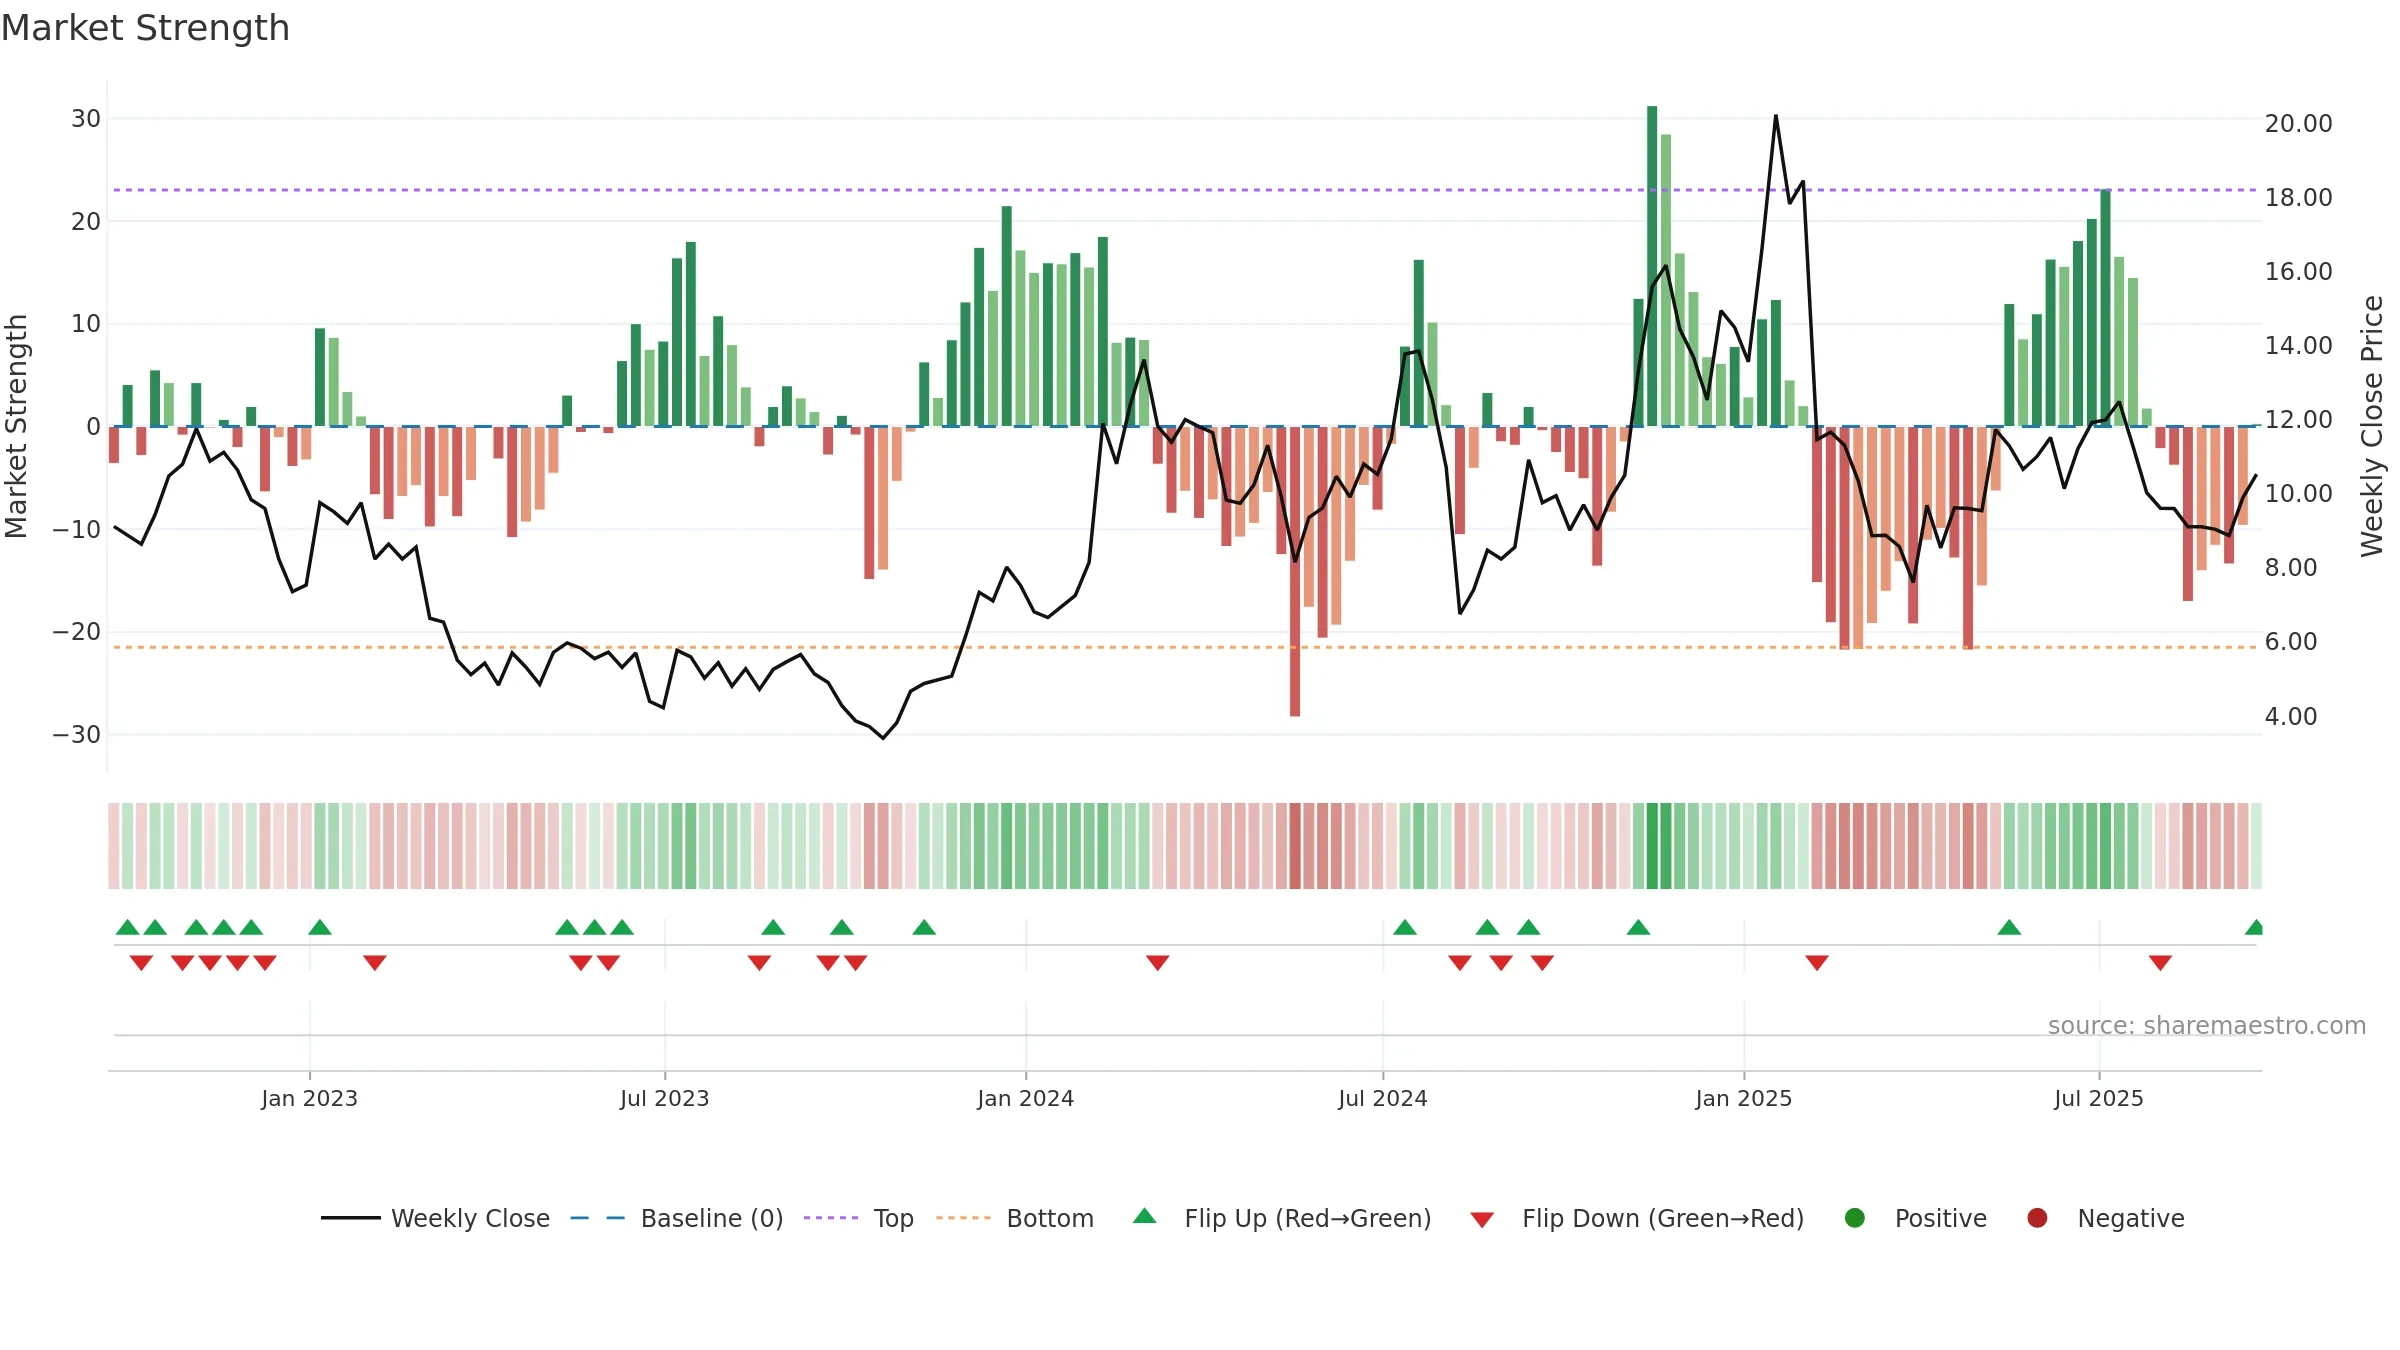
Gauge maps the trend signal to a 0–100 scale.
How to read this — Range-bound conditions; conviction is limited until a break or acceleration emerges. Sub-0.40 print confirms downside control.
Wait for a directional break or improving acceleration.
Conclusion
Negative setup. ★★☆☆☆ confidence. Price window: 9. Trend: Range / Neutral; gauge 24. In combination, liquidity diverges from price.
- Price holds above 8w & 26w averages
- Buyers step in at depressed levels (accumulation)
- Momentum is weak/falling
- Liquidity diverges from price
- High return volatility raises whipsaw risk
- Sub-0.40 print confirms bear control
Why: Price window 9.57% over 8w. Close is 6.47% above the prior-window high. Return volatility 4.44%. Volume trend falling. Liquidity divergence with price. Trend state range / neutral. Low-regime (≤0.25) upticks 2/3 (67.0%) • Accumulating. 4–8w crossover bullish. Momentum bearish and rising.
Tip: Most metrics include a hover tooltip where they appear in the report.