Summit Midstream Corporation
SMC NYSE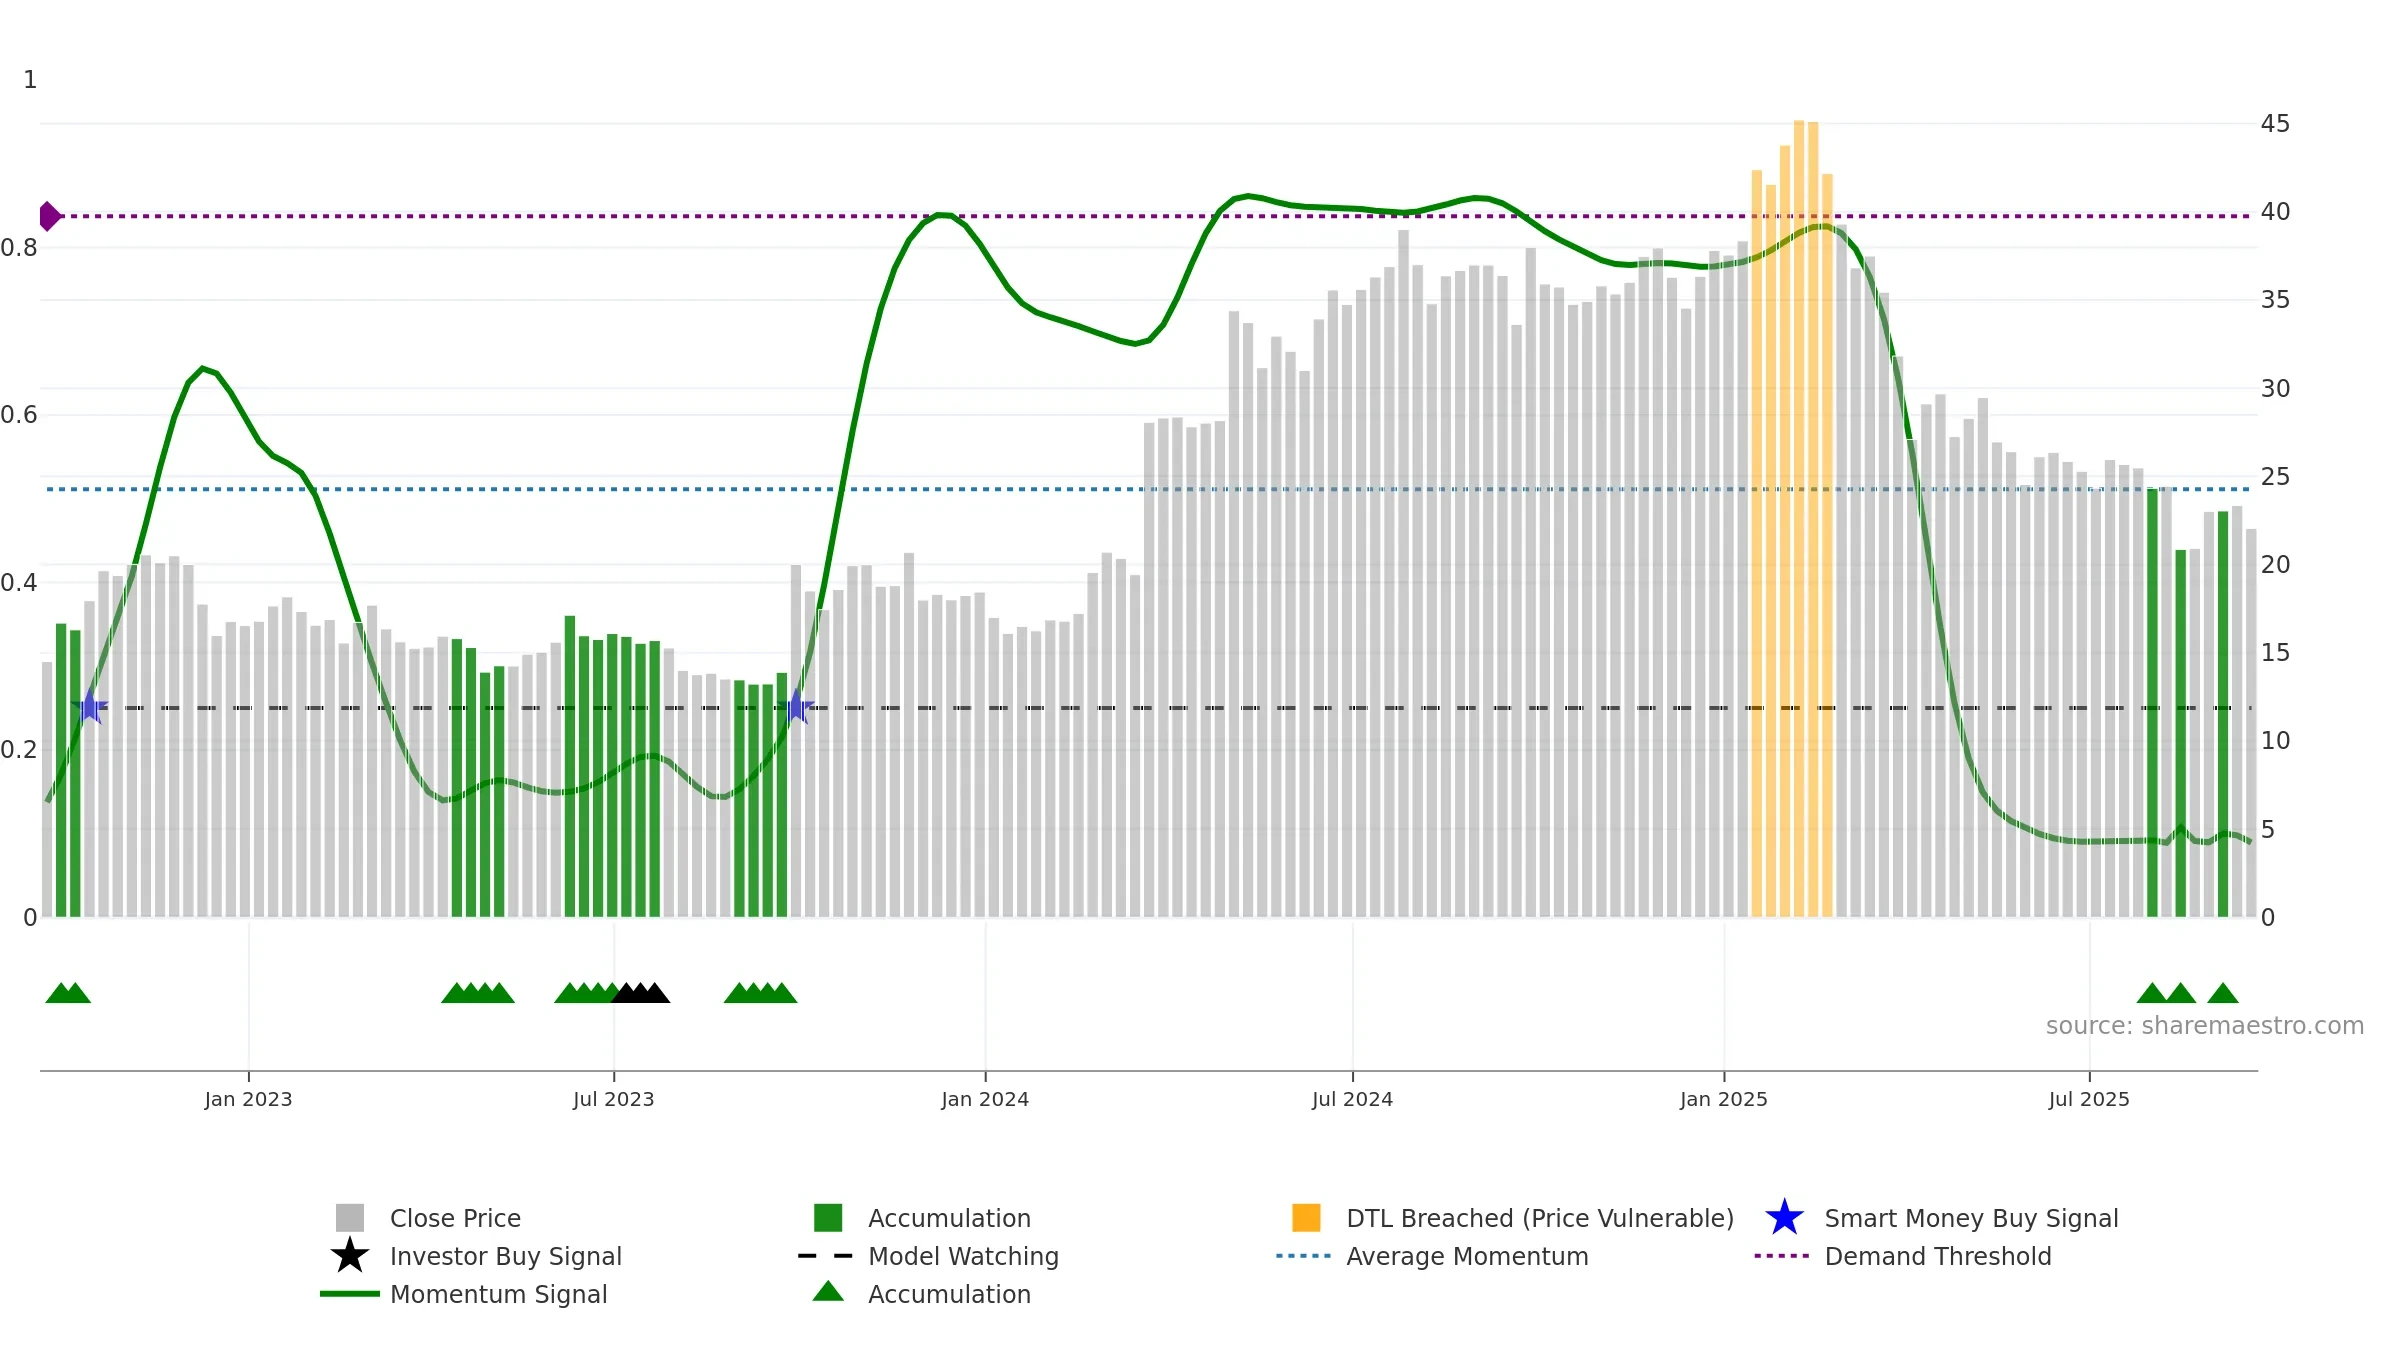
Weekly Report
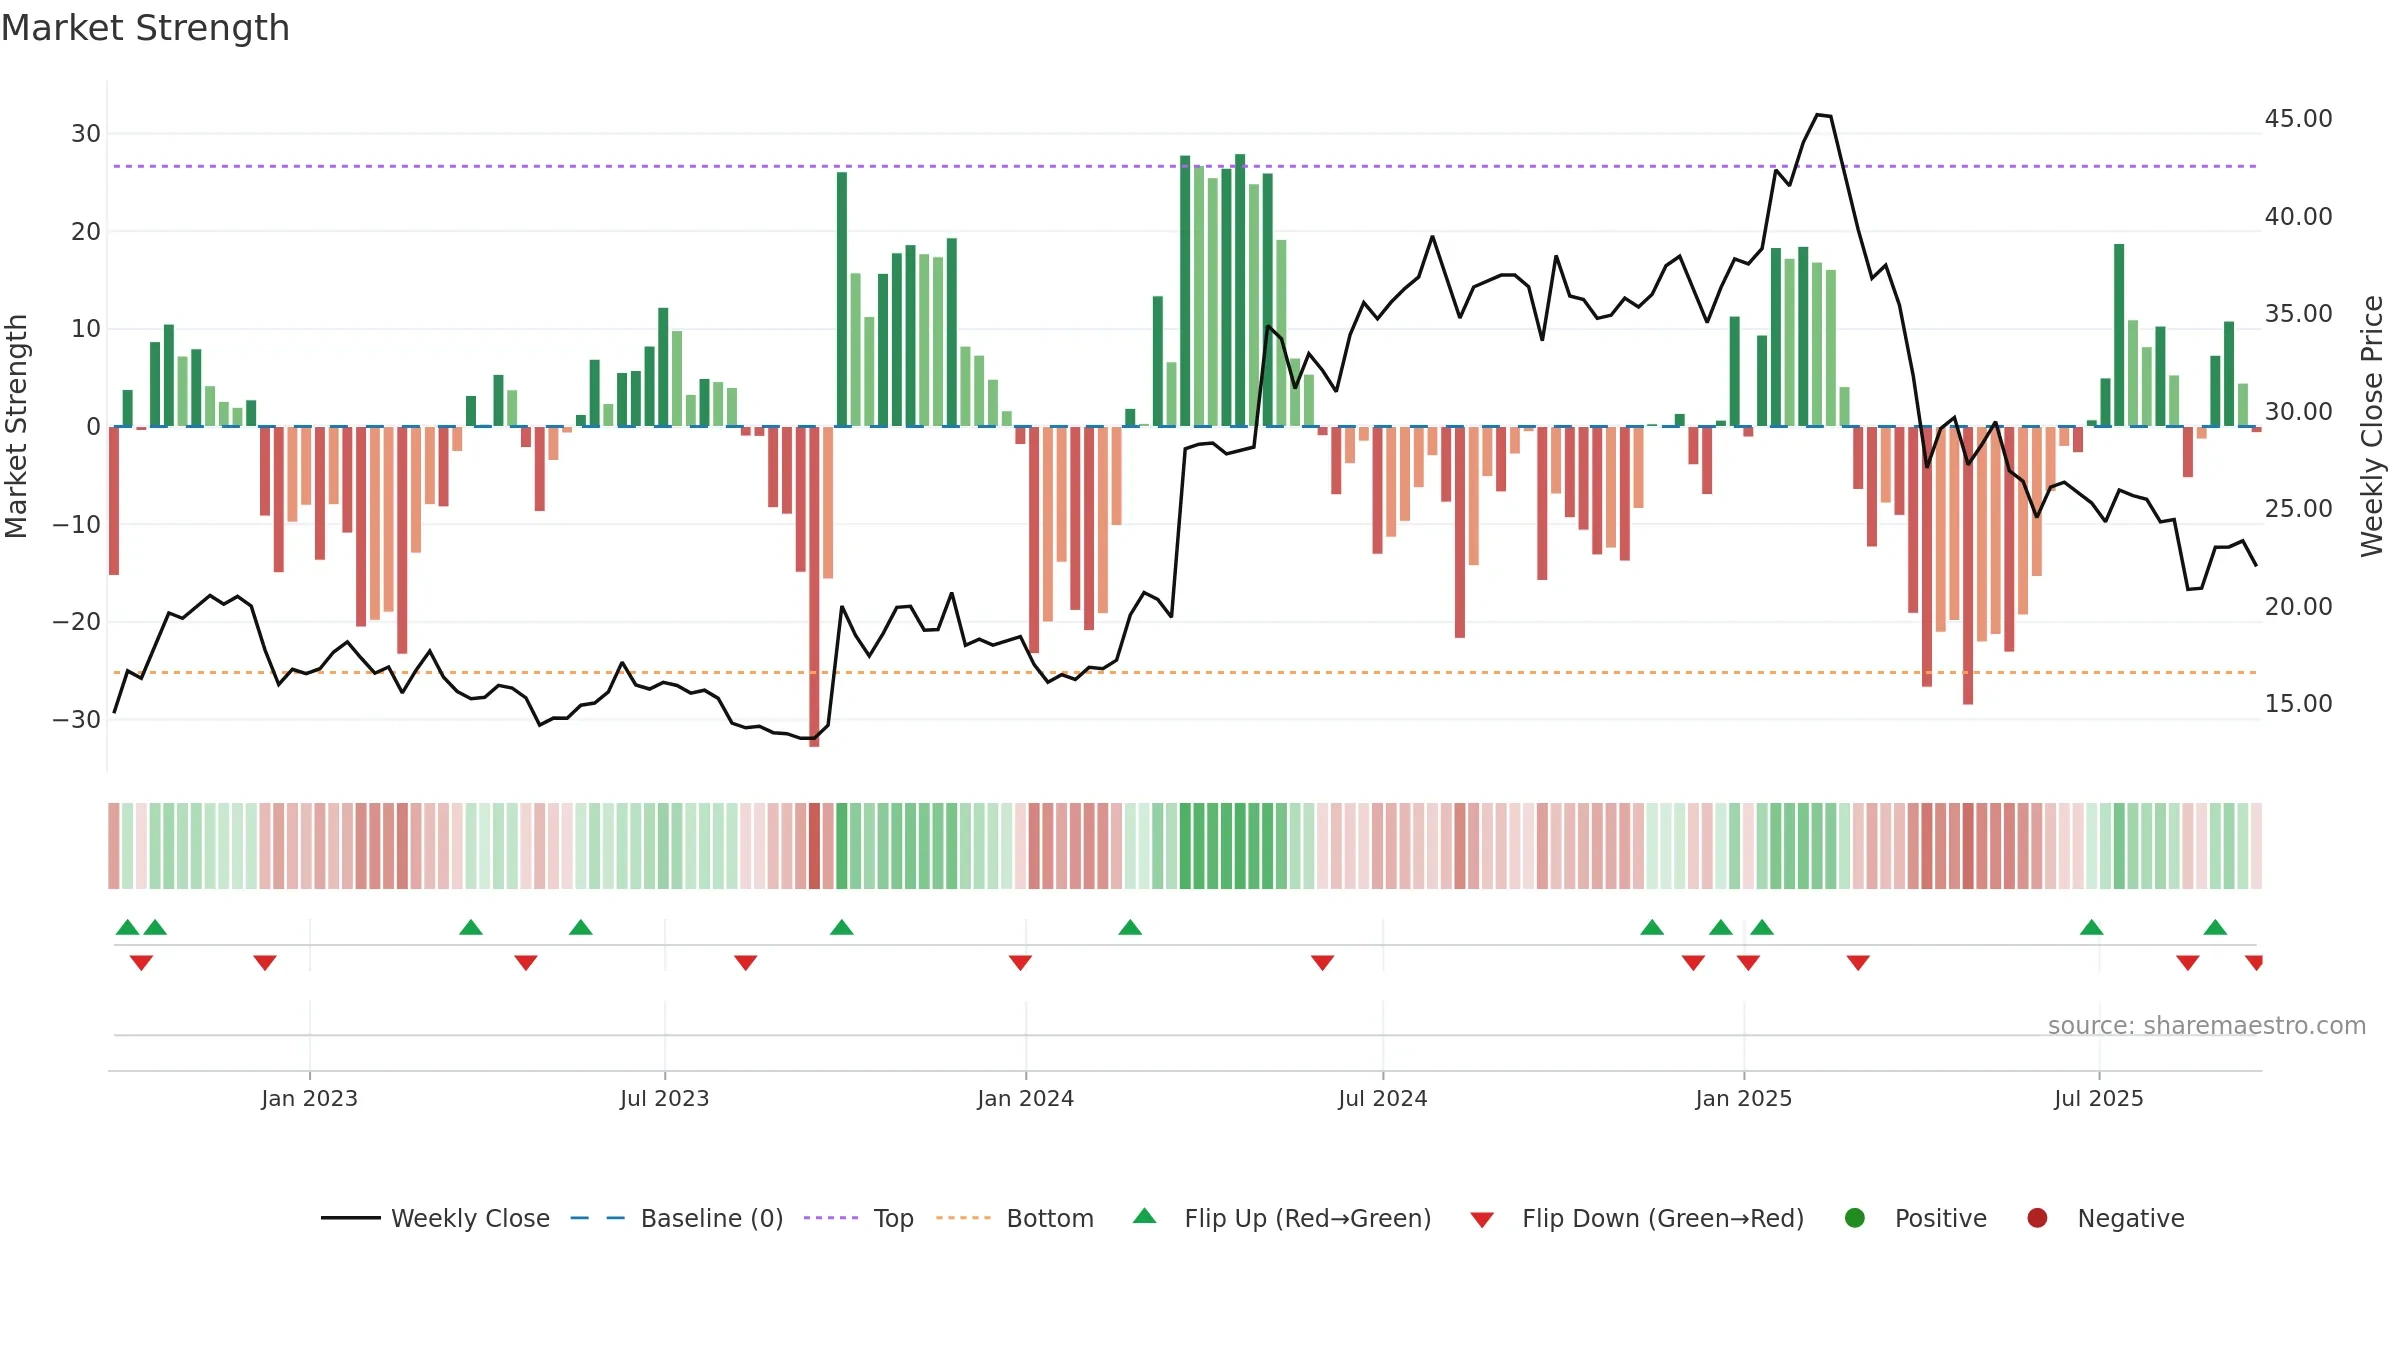
Summit Midstream Corporation closed at 22.0400 (-5.12% WoW) . Data window ends Fri, 19 Sep 2025.
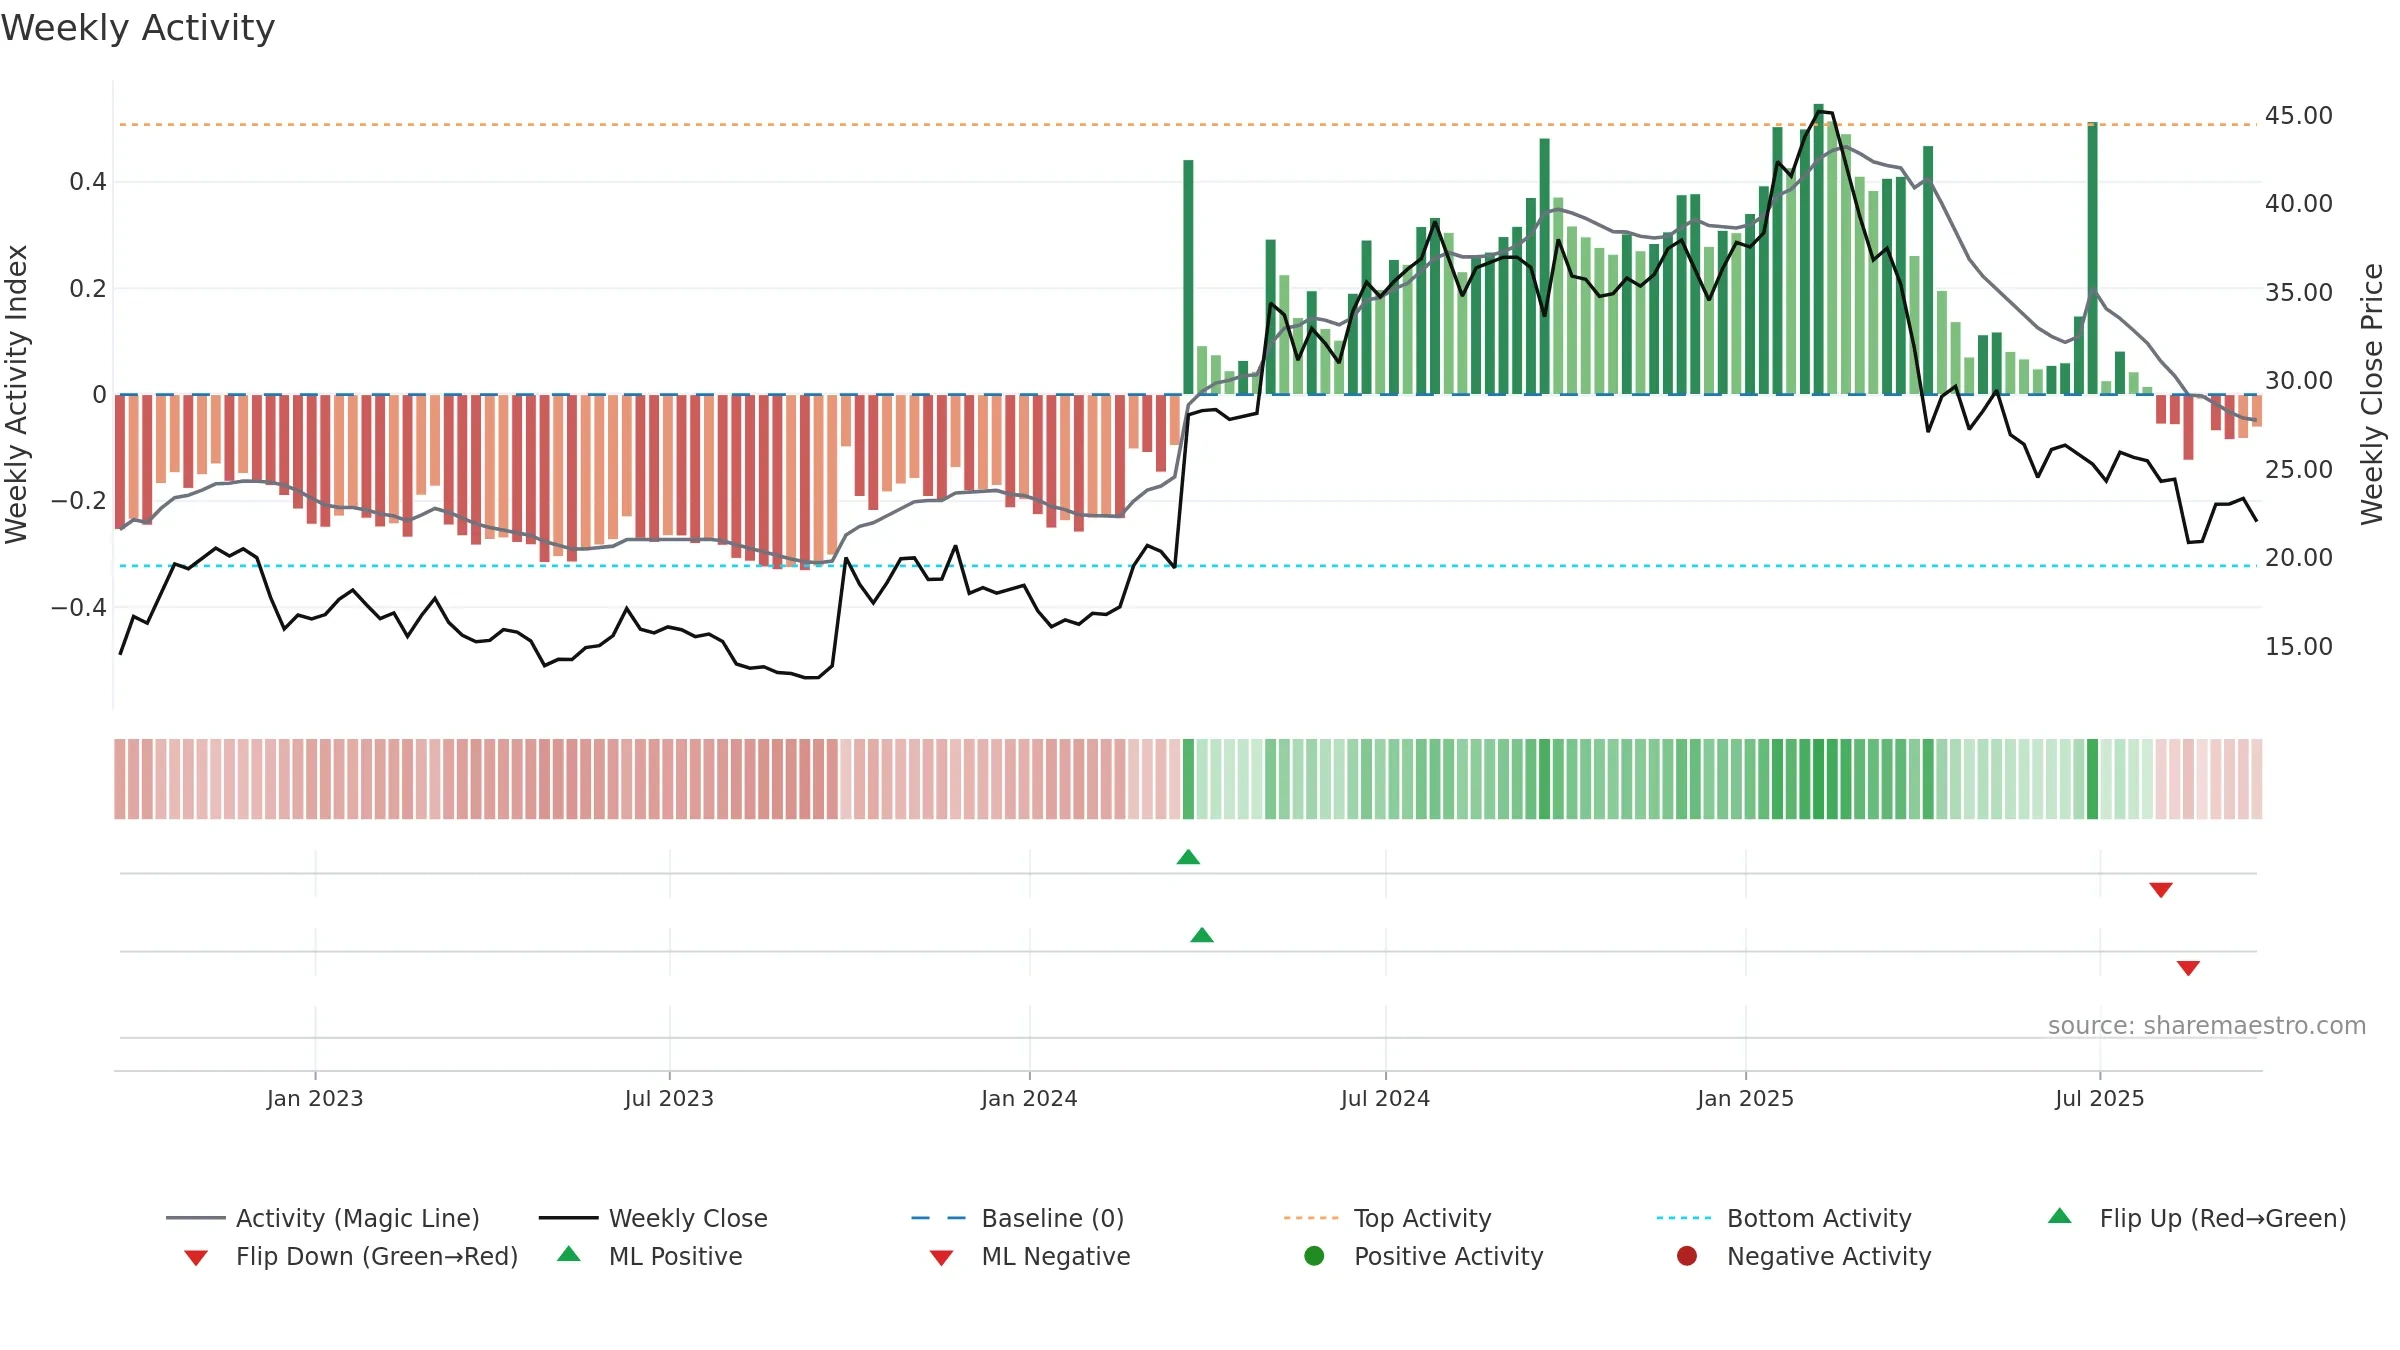
How to read this — Price slope is downward, indicating persistent supply pressure. Volume trend diverges from price — watch for fatigue or rotation. Returns are positively correlated with volume — strength tends to arrive on higher activity. Distance to baseline is narrowing — reverting closer to its fair-value track. Fresh short-term crossover improves near-term tone. Price sits below key averages, keeping pressure on the tape.
Down-slope argues for patience; rallies can fade sooner unless participation improves. Because liquidity isn’t confirming, prefer evidence of fresh demand before chasing moves.
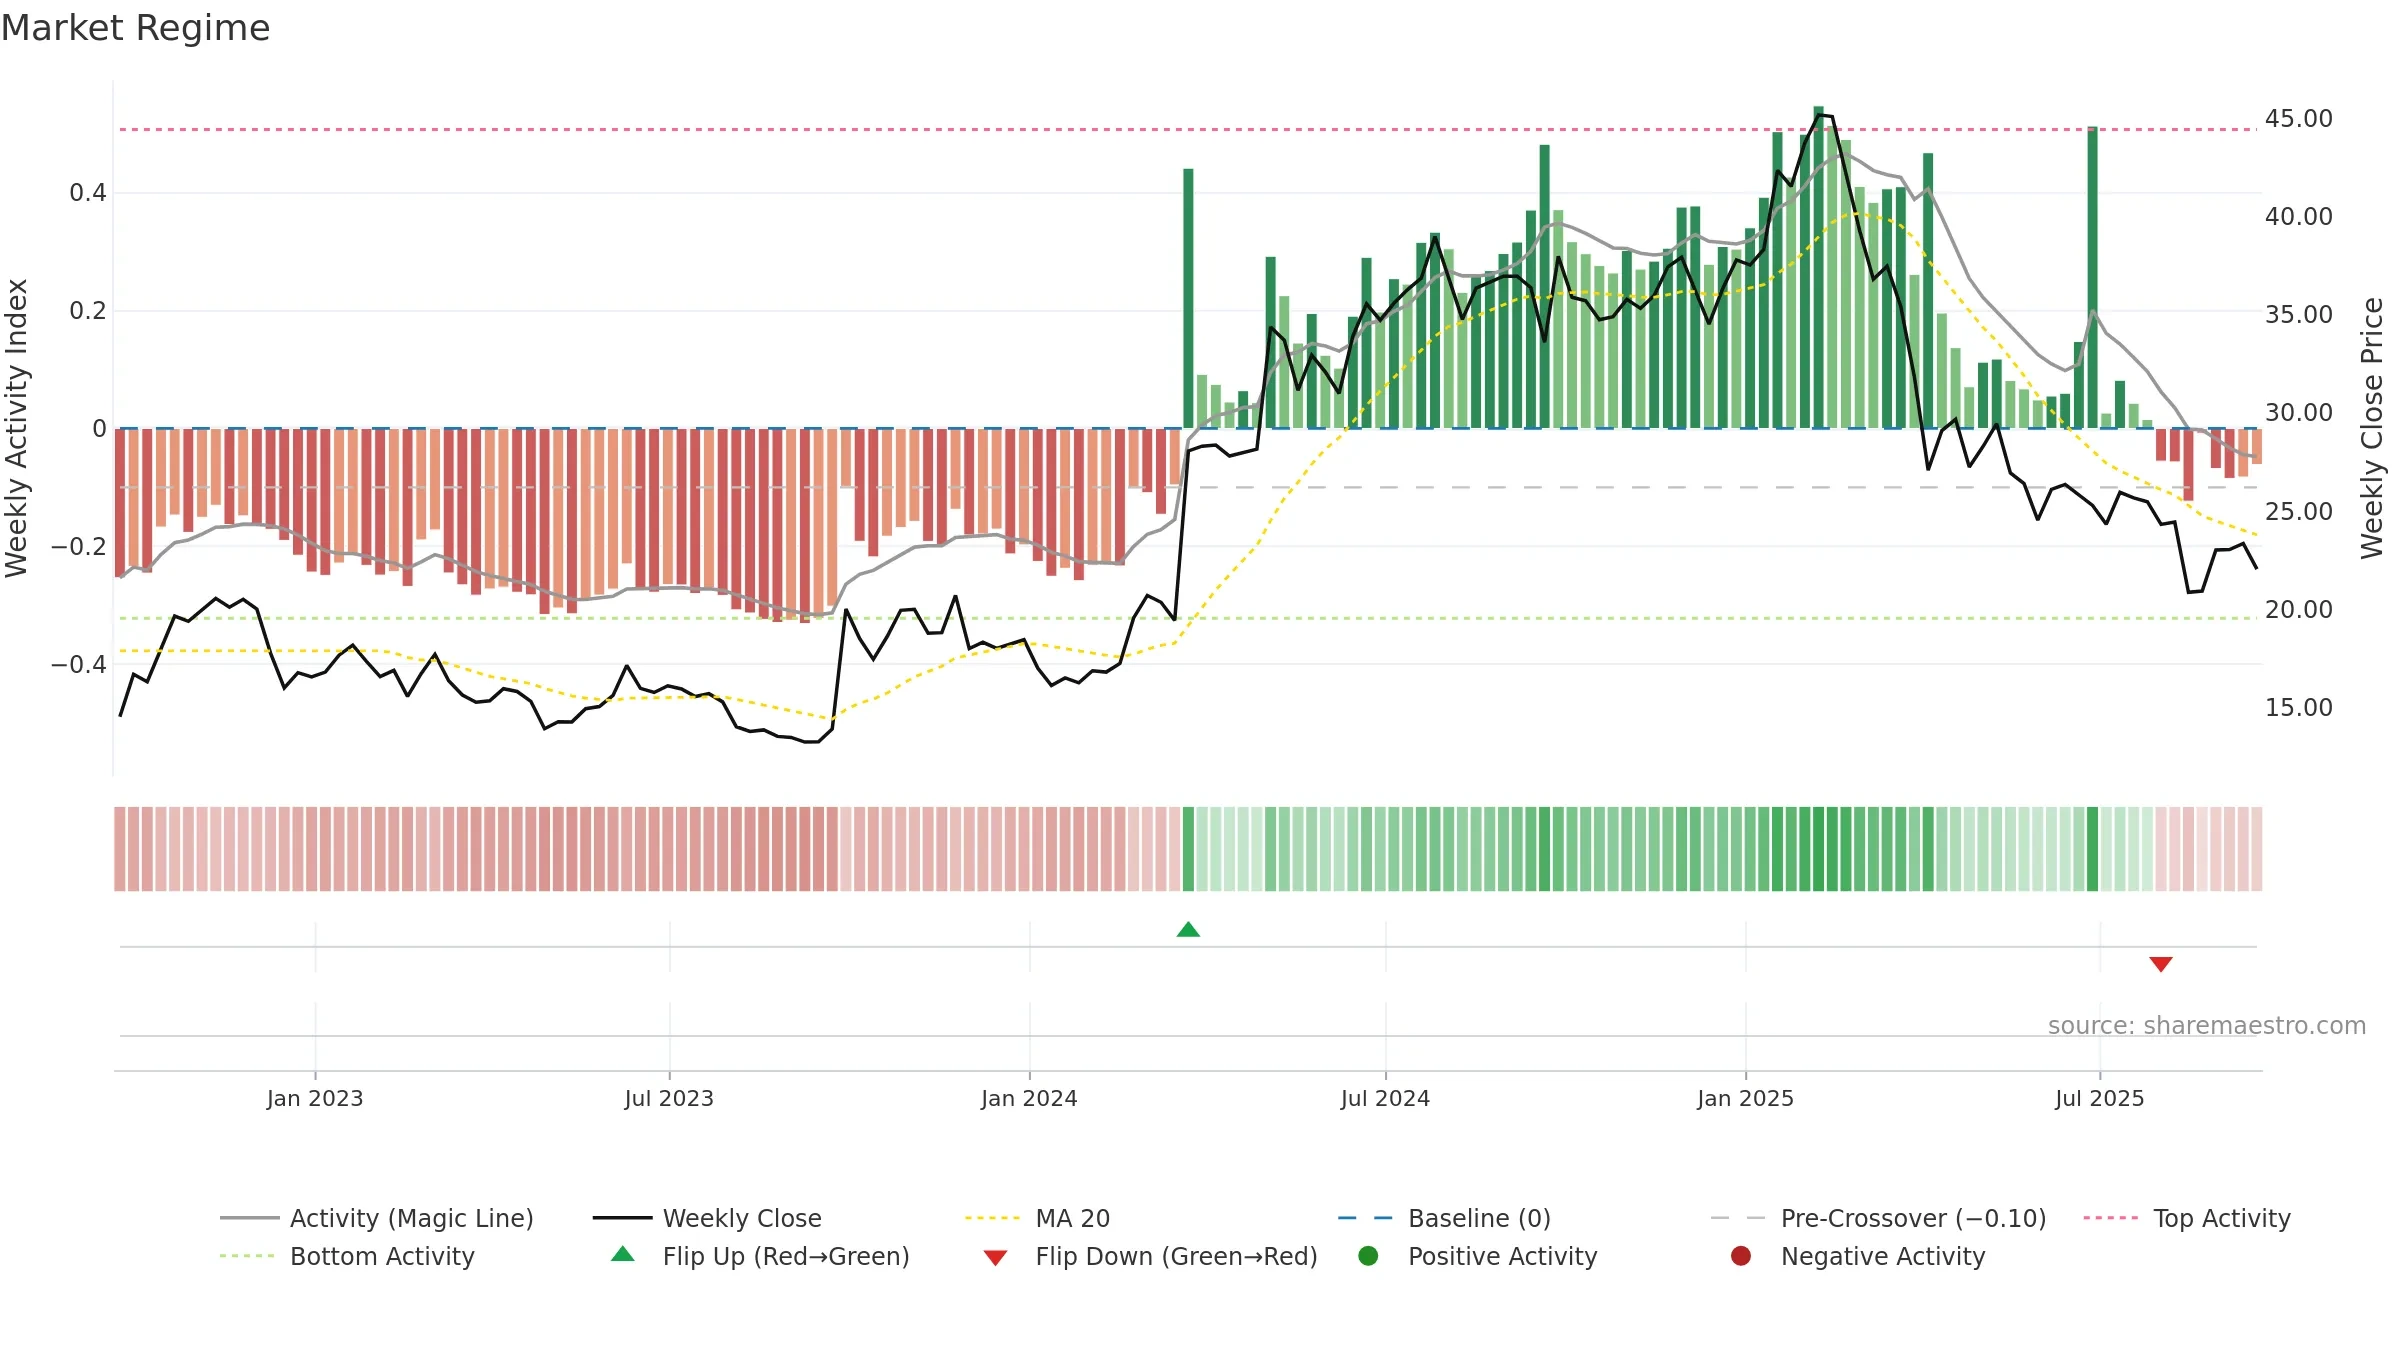
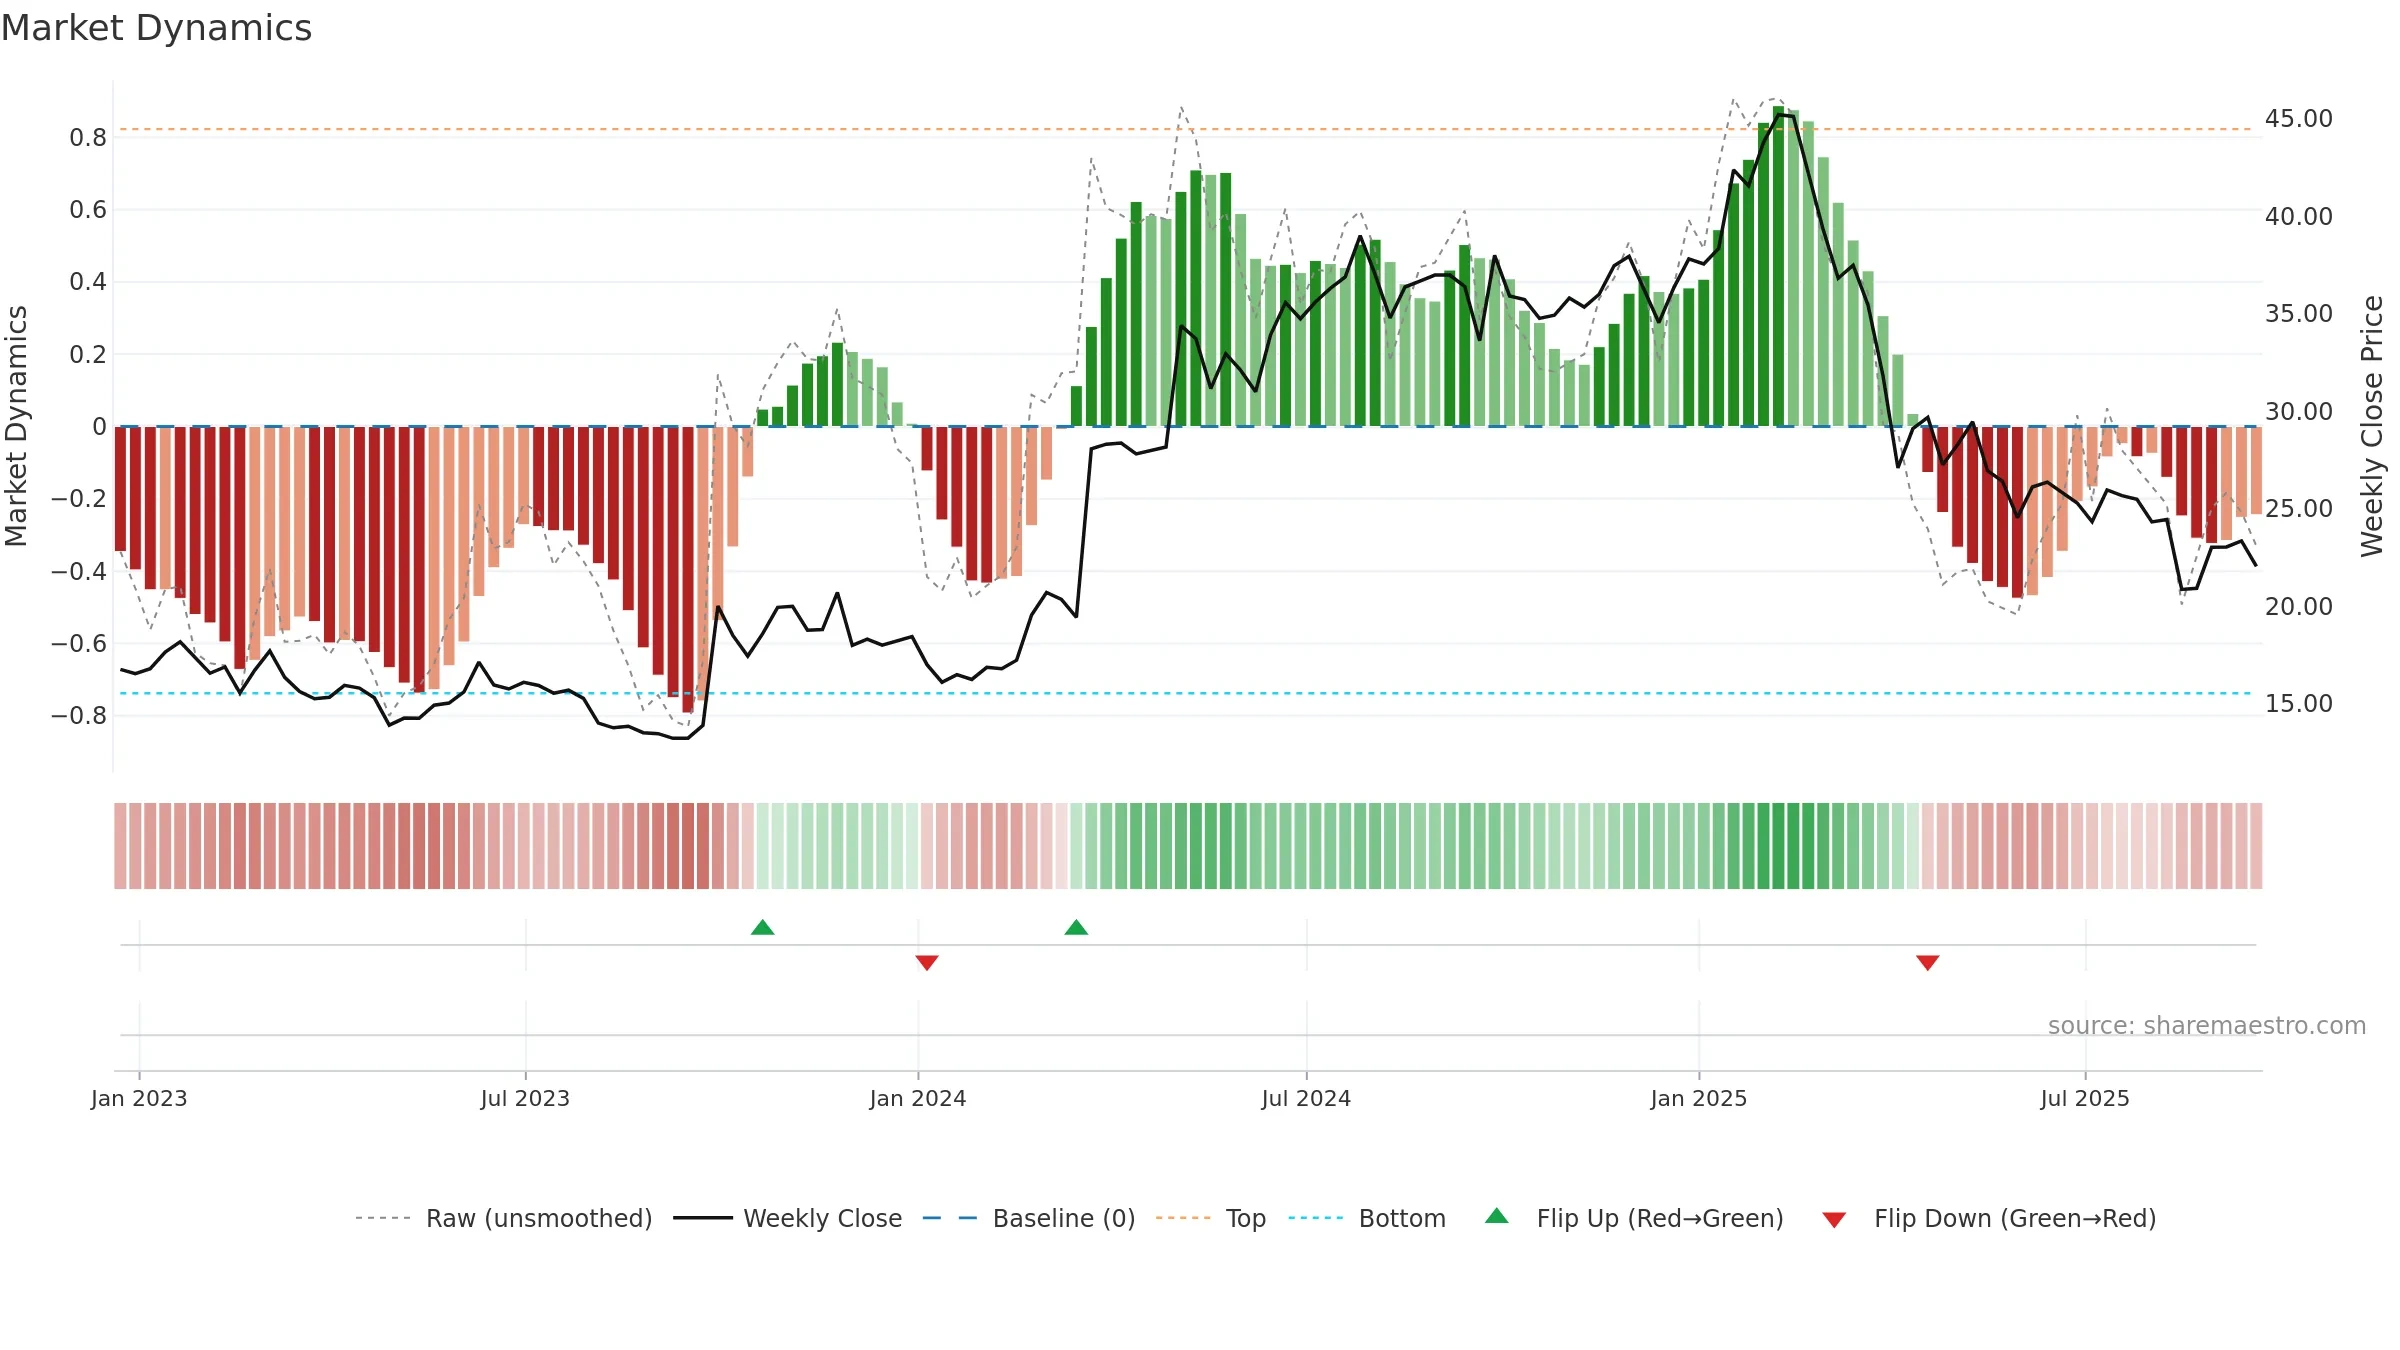
Gauge maps the trend signal to a 0–100 scale.
How to read this — Range-bound conditions; conviction is limited until a break or acceleration emerges.
Wait for a directional break or improving acceleration.
Conclusion
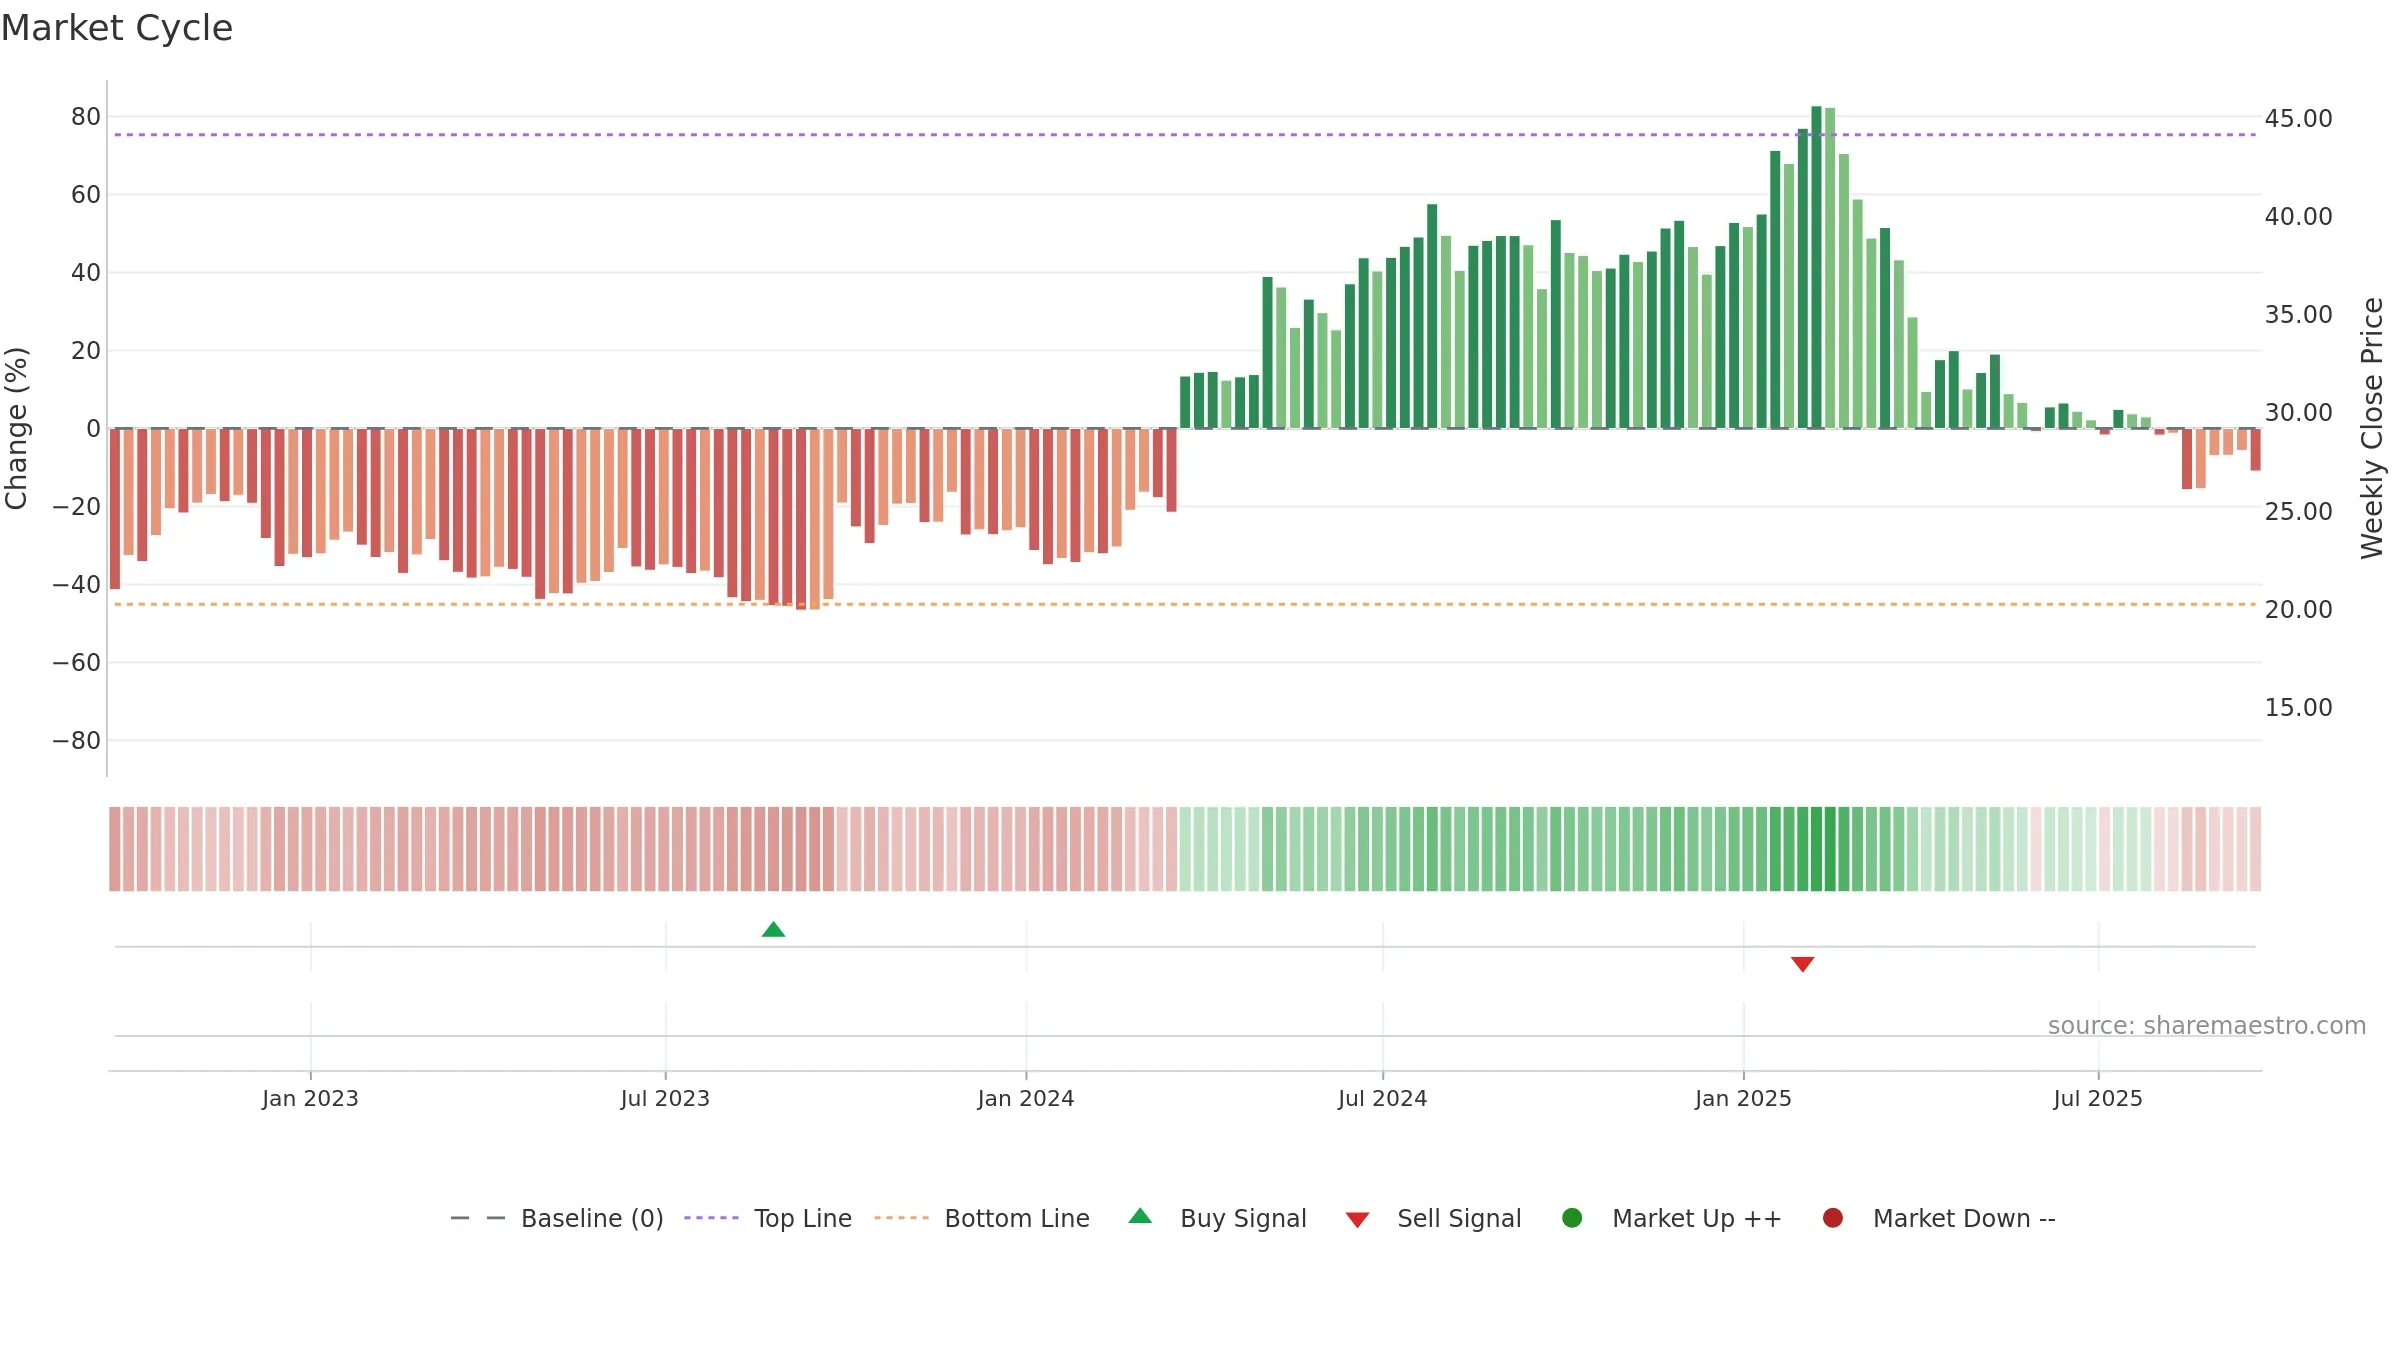
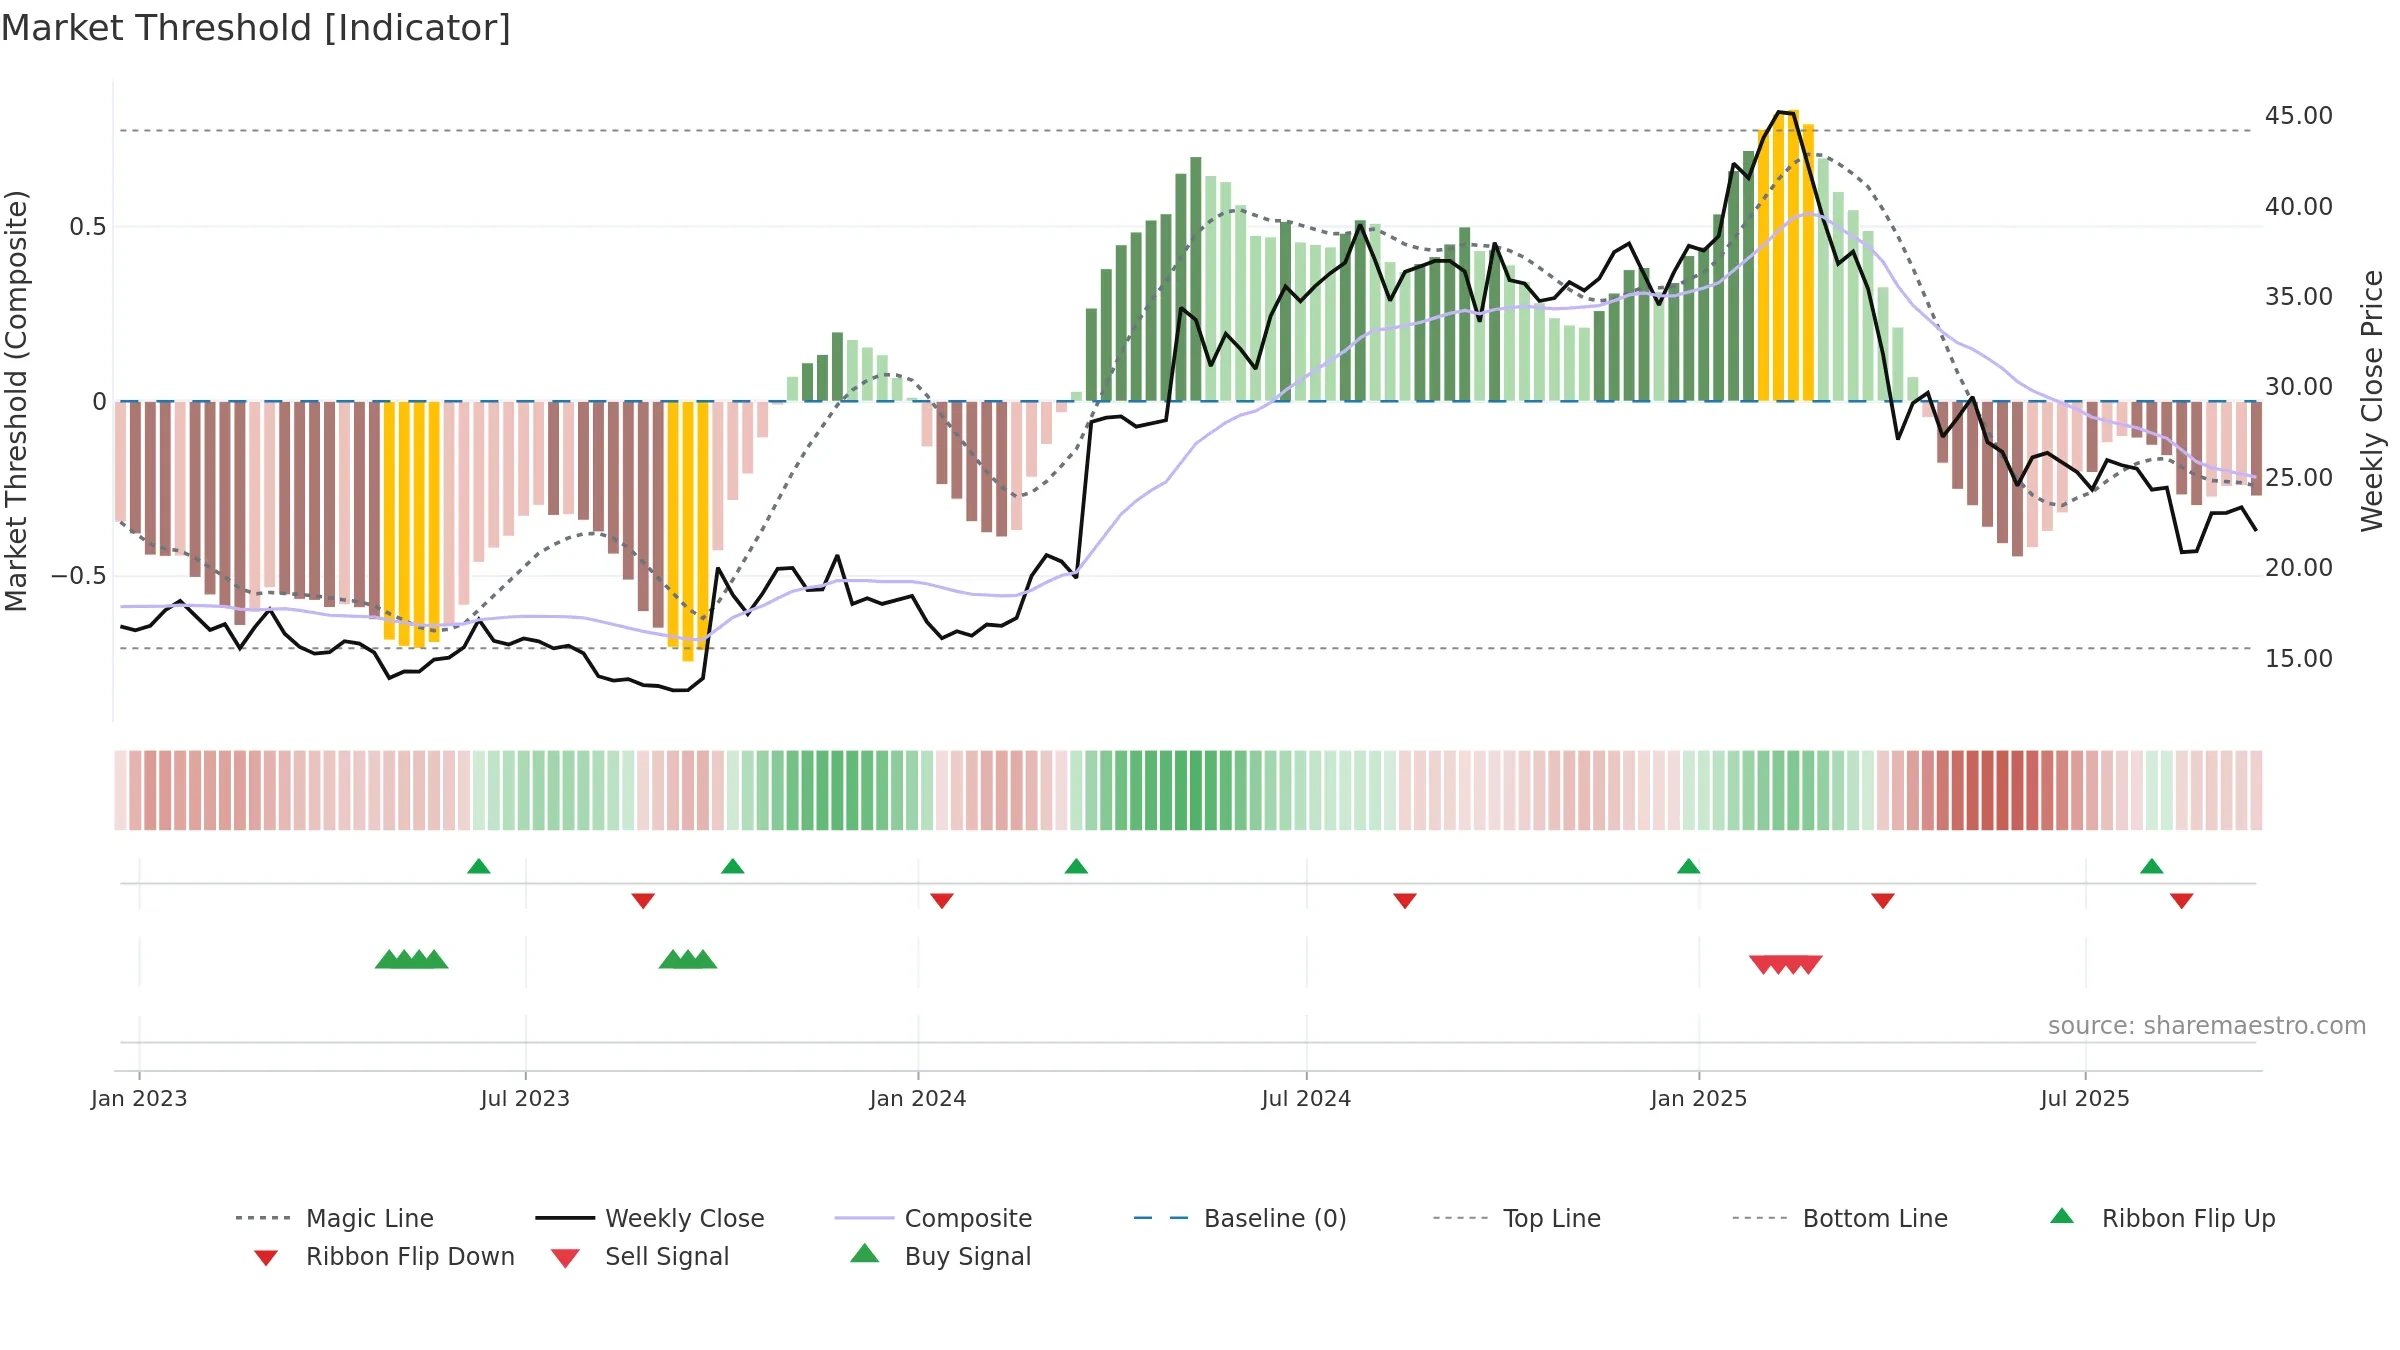
Negative setup. ★★☆☆☆ confidence. Price window: -9. Trend: Range / Neutral; gauge 8. In combination, liquidity diverges from price.
- Momentum is weak/falling
- Price is not above key averages
- Liquidity diverges from price
- Negative multi-week performance
Why: Price window -9.38% over 8w. Close is -9.82% below the prior-window high. Volume trend rising. Liquidity divergence with price. Trend state range / neutral. Low-regime (≤0.25) upticks 2/7 (29.0%) • Distributing. 4–8w crossover bullish. Momentum bearish and rising.
Tip: Most metrics include a hover tooltip where they appear in the report.