Beijing Trust&Far Technology CO.,LTD
300231 SHE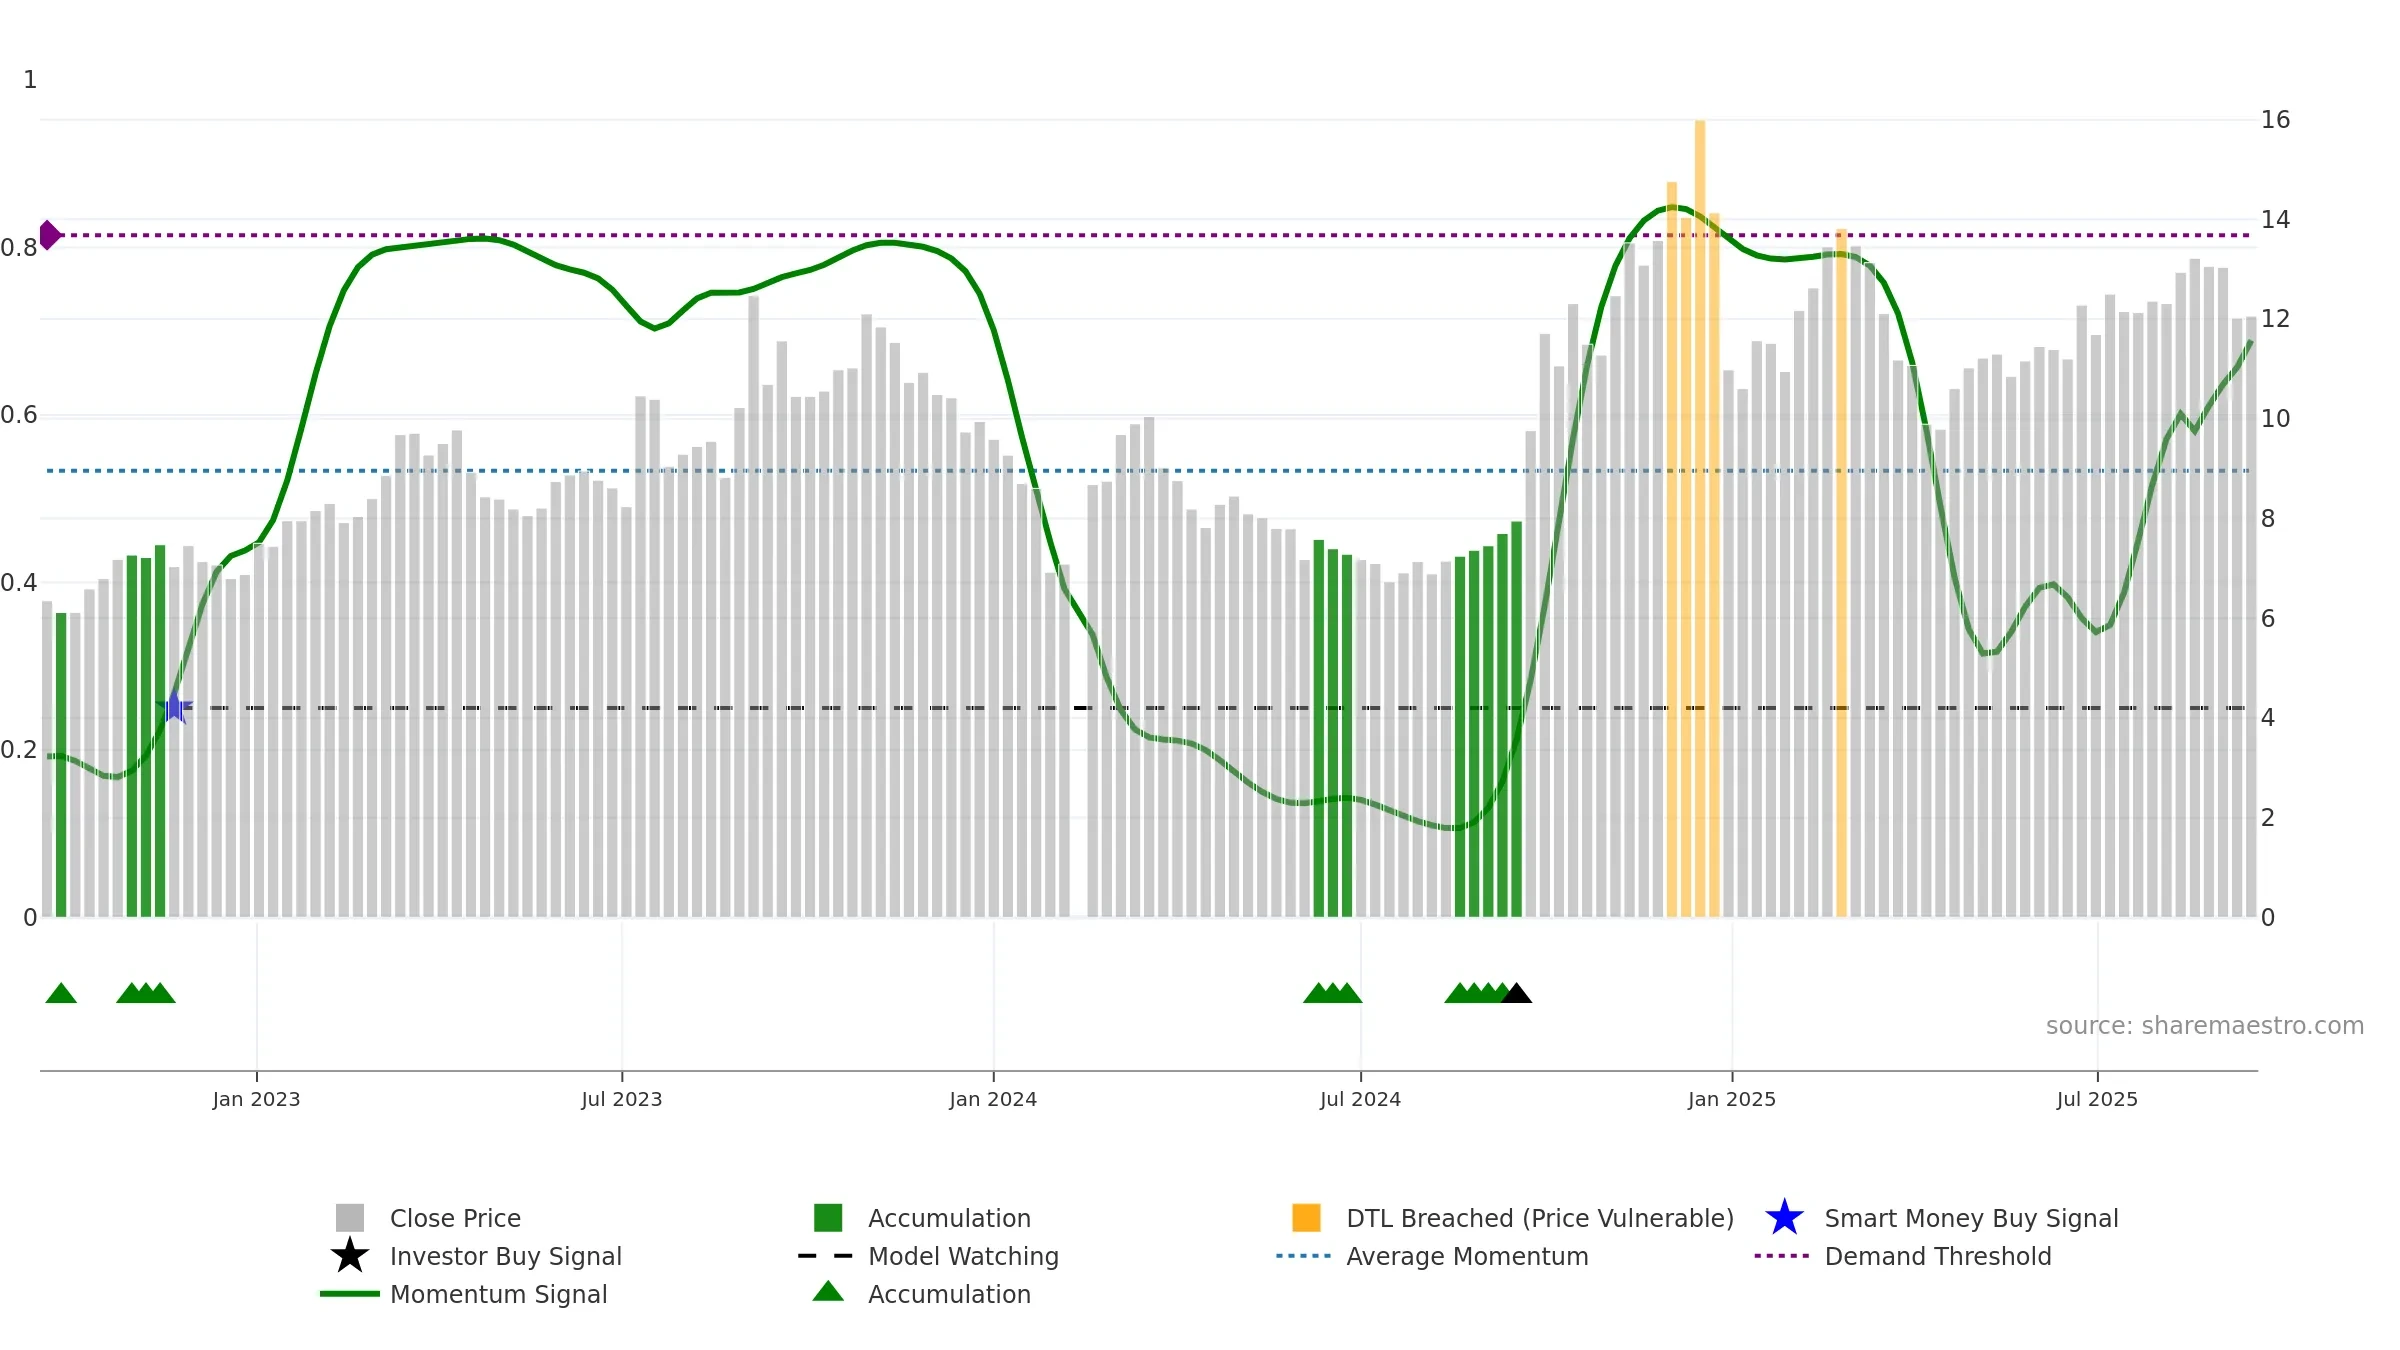
Weekly Report
Beijing Trust&Far Technology CO.,LTD closed at 12.0600 (-1.31% WoW) . Data window ends Mon, 15 Sep 2025.
How to read this — Price slope is downward, indicating persistent supply pressure. Low weekly volatility favours steadier follow-through. Volume and price are moving in the same direction — a constructive confirmation. Distance to baseline is narrowing — reverting closer to its fair-value track. Fresh short-term downside crossover weakens near-term tone.
Down-slope argues for patience; rallies can fade sooner unless participation improves.
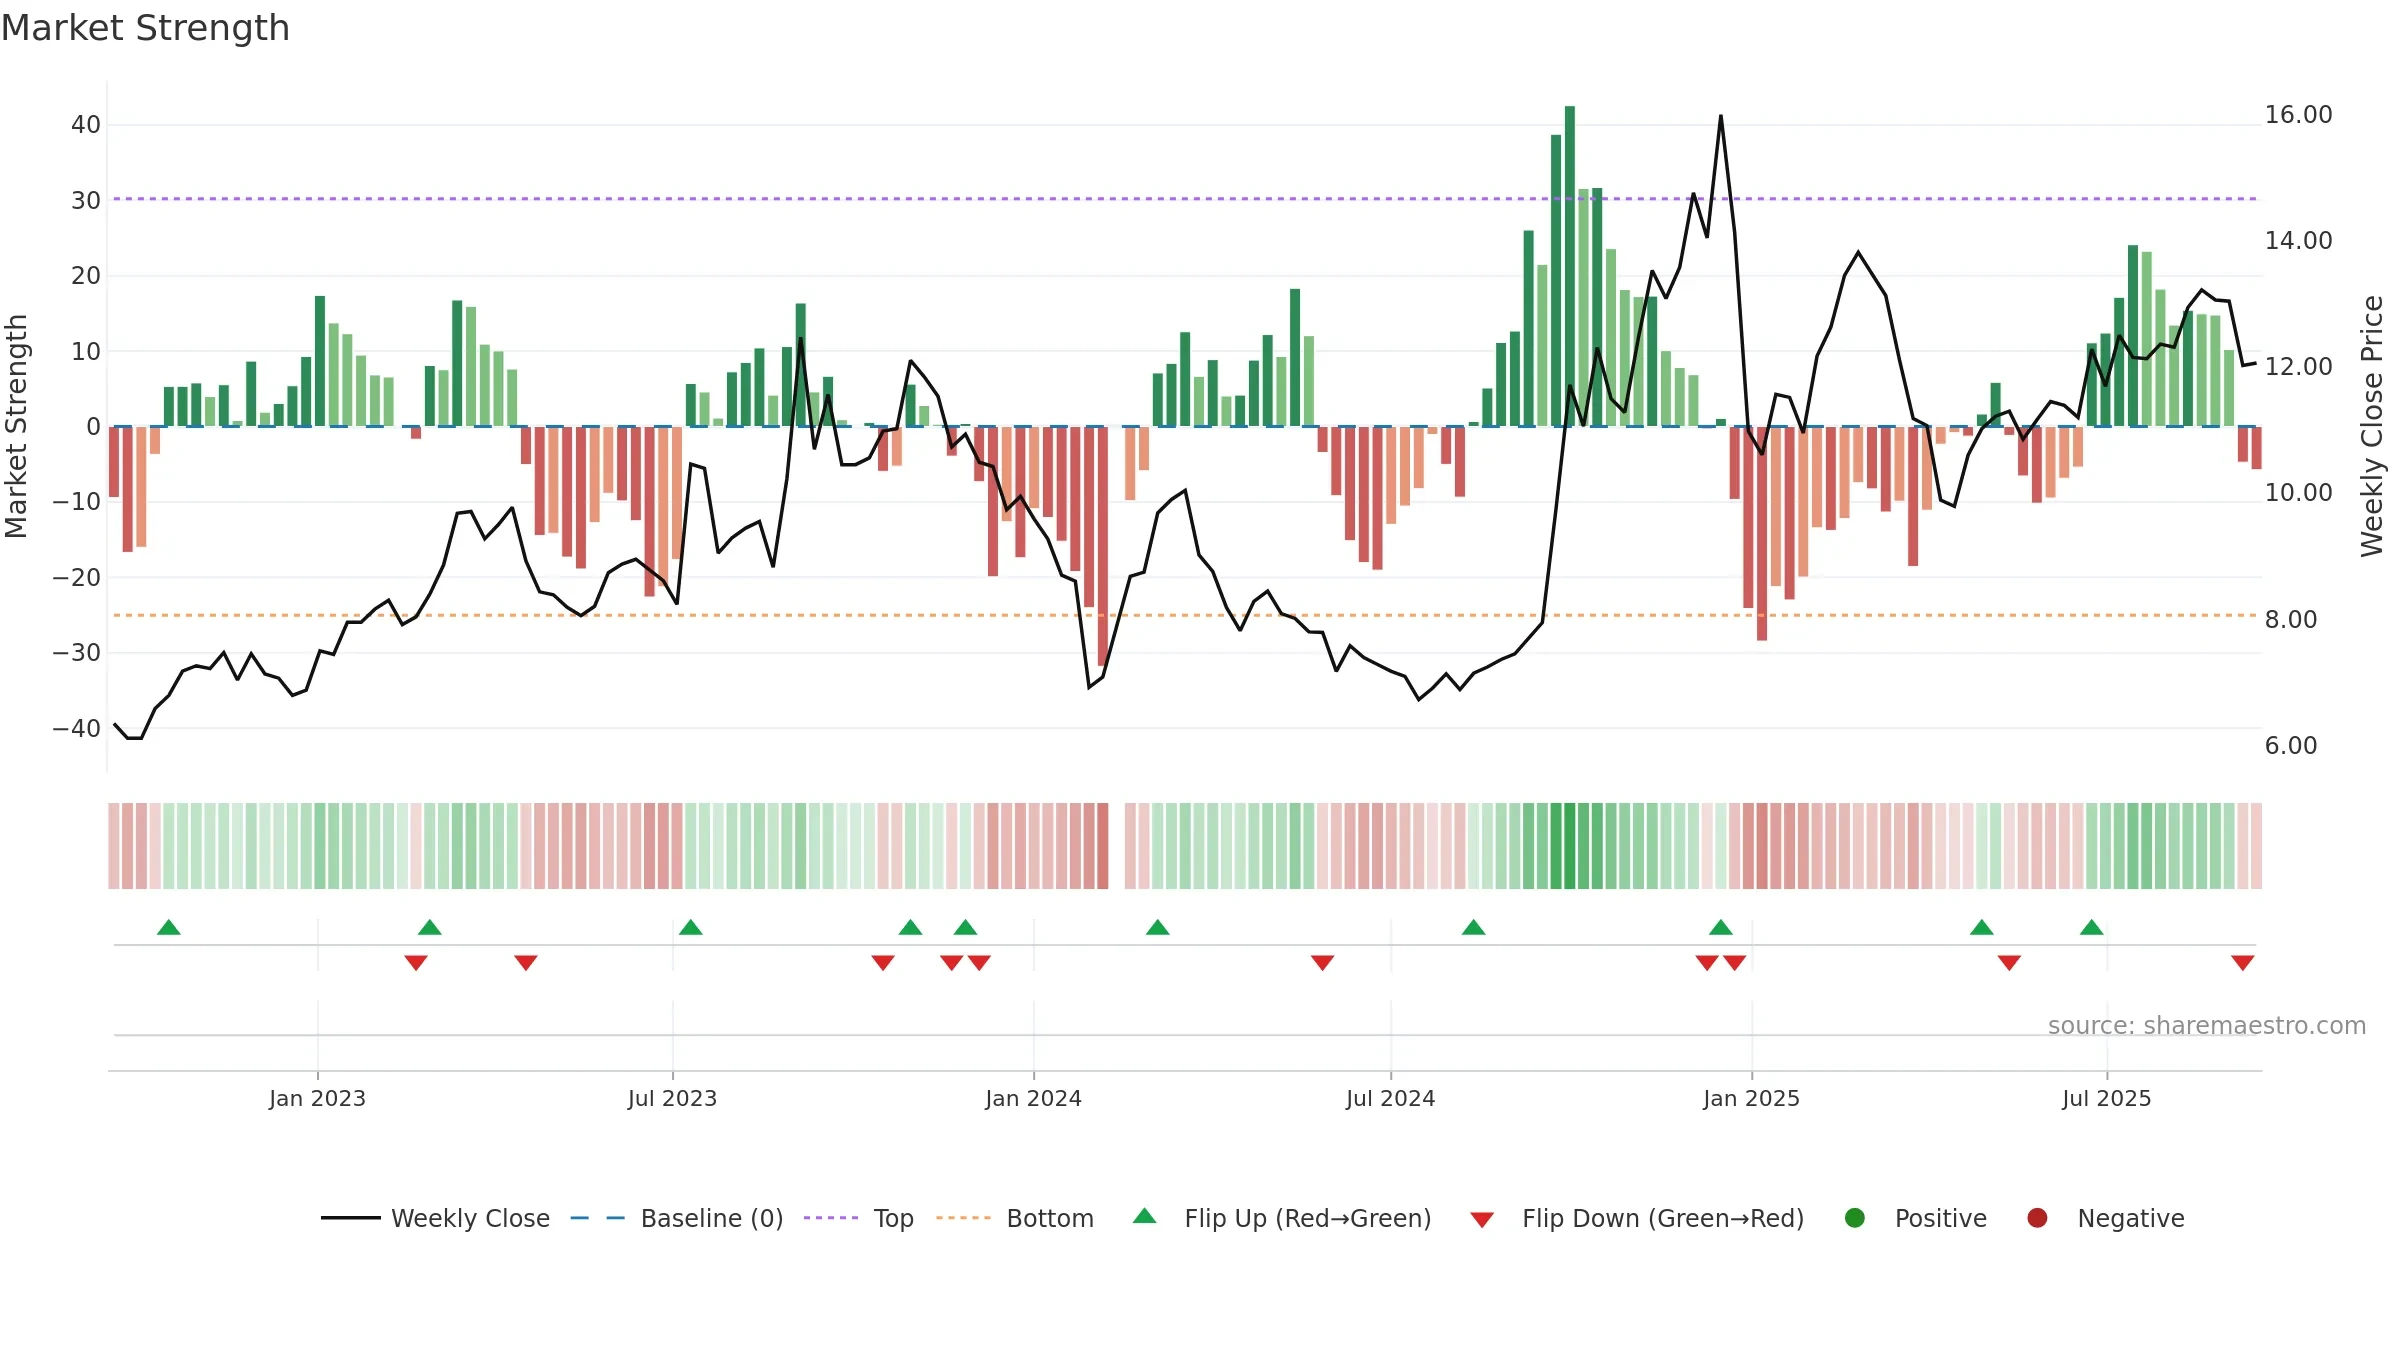
Gauge maps the trend signal to a 0–100 scale.
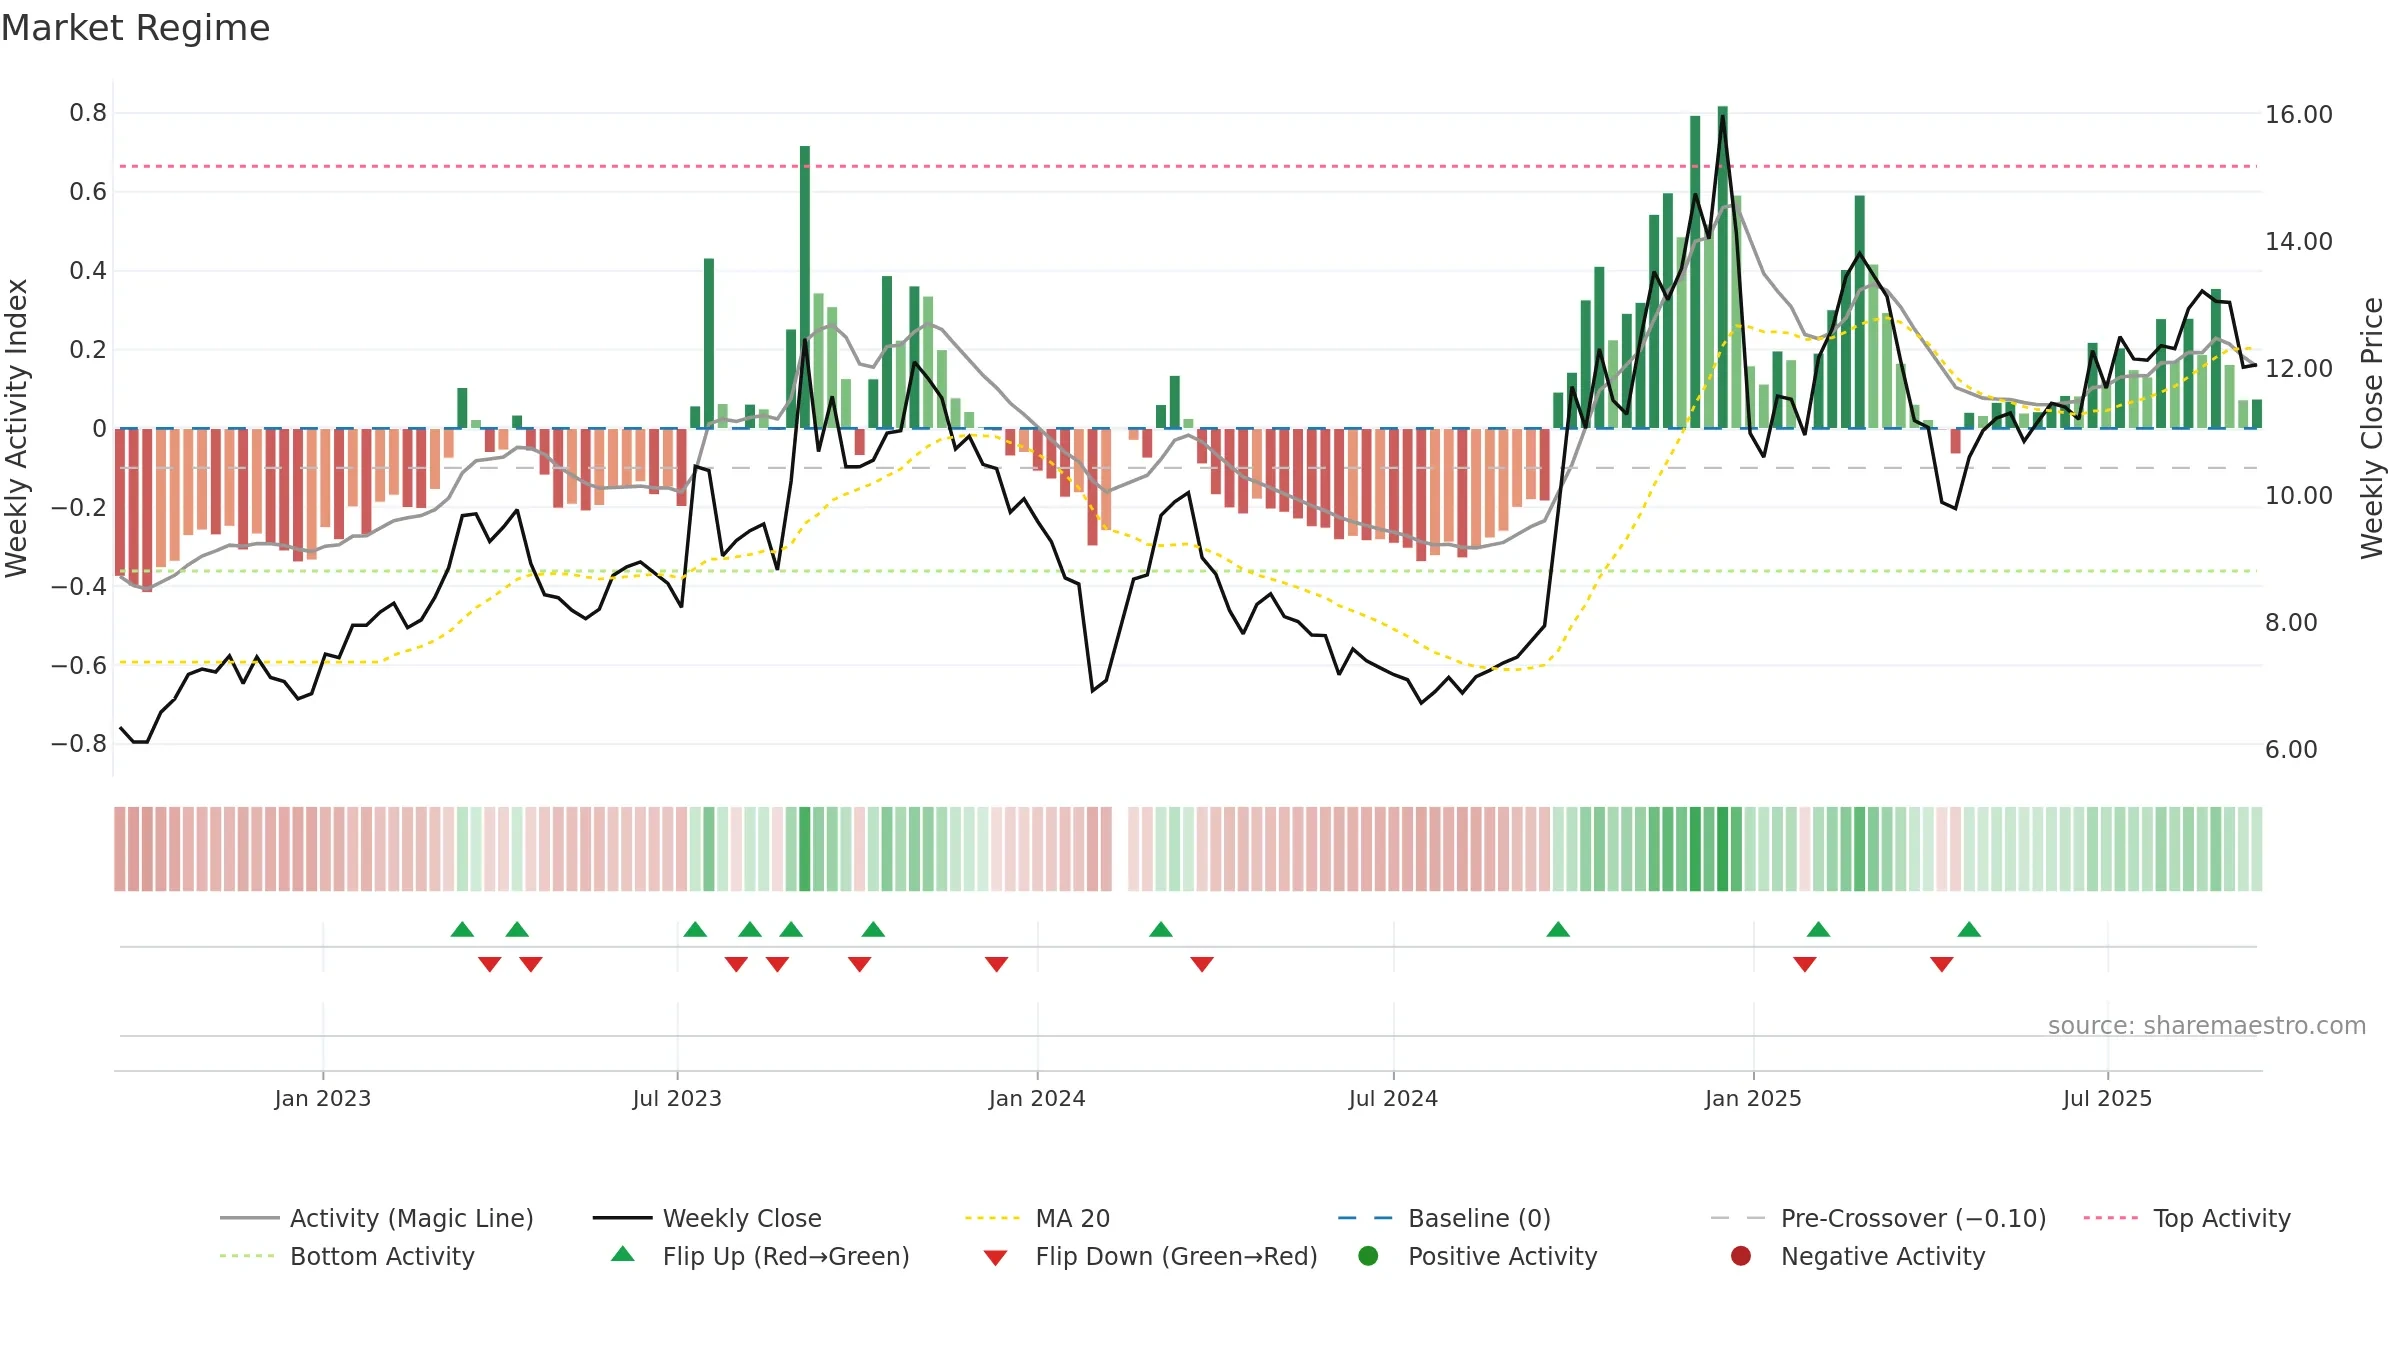
How to read this — Range-bound conditions; conviction is limited until a break or acceleration emerges.
Wait for a directional break or improving acceleration.
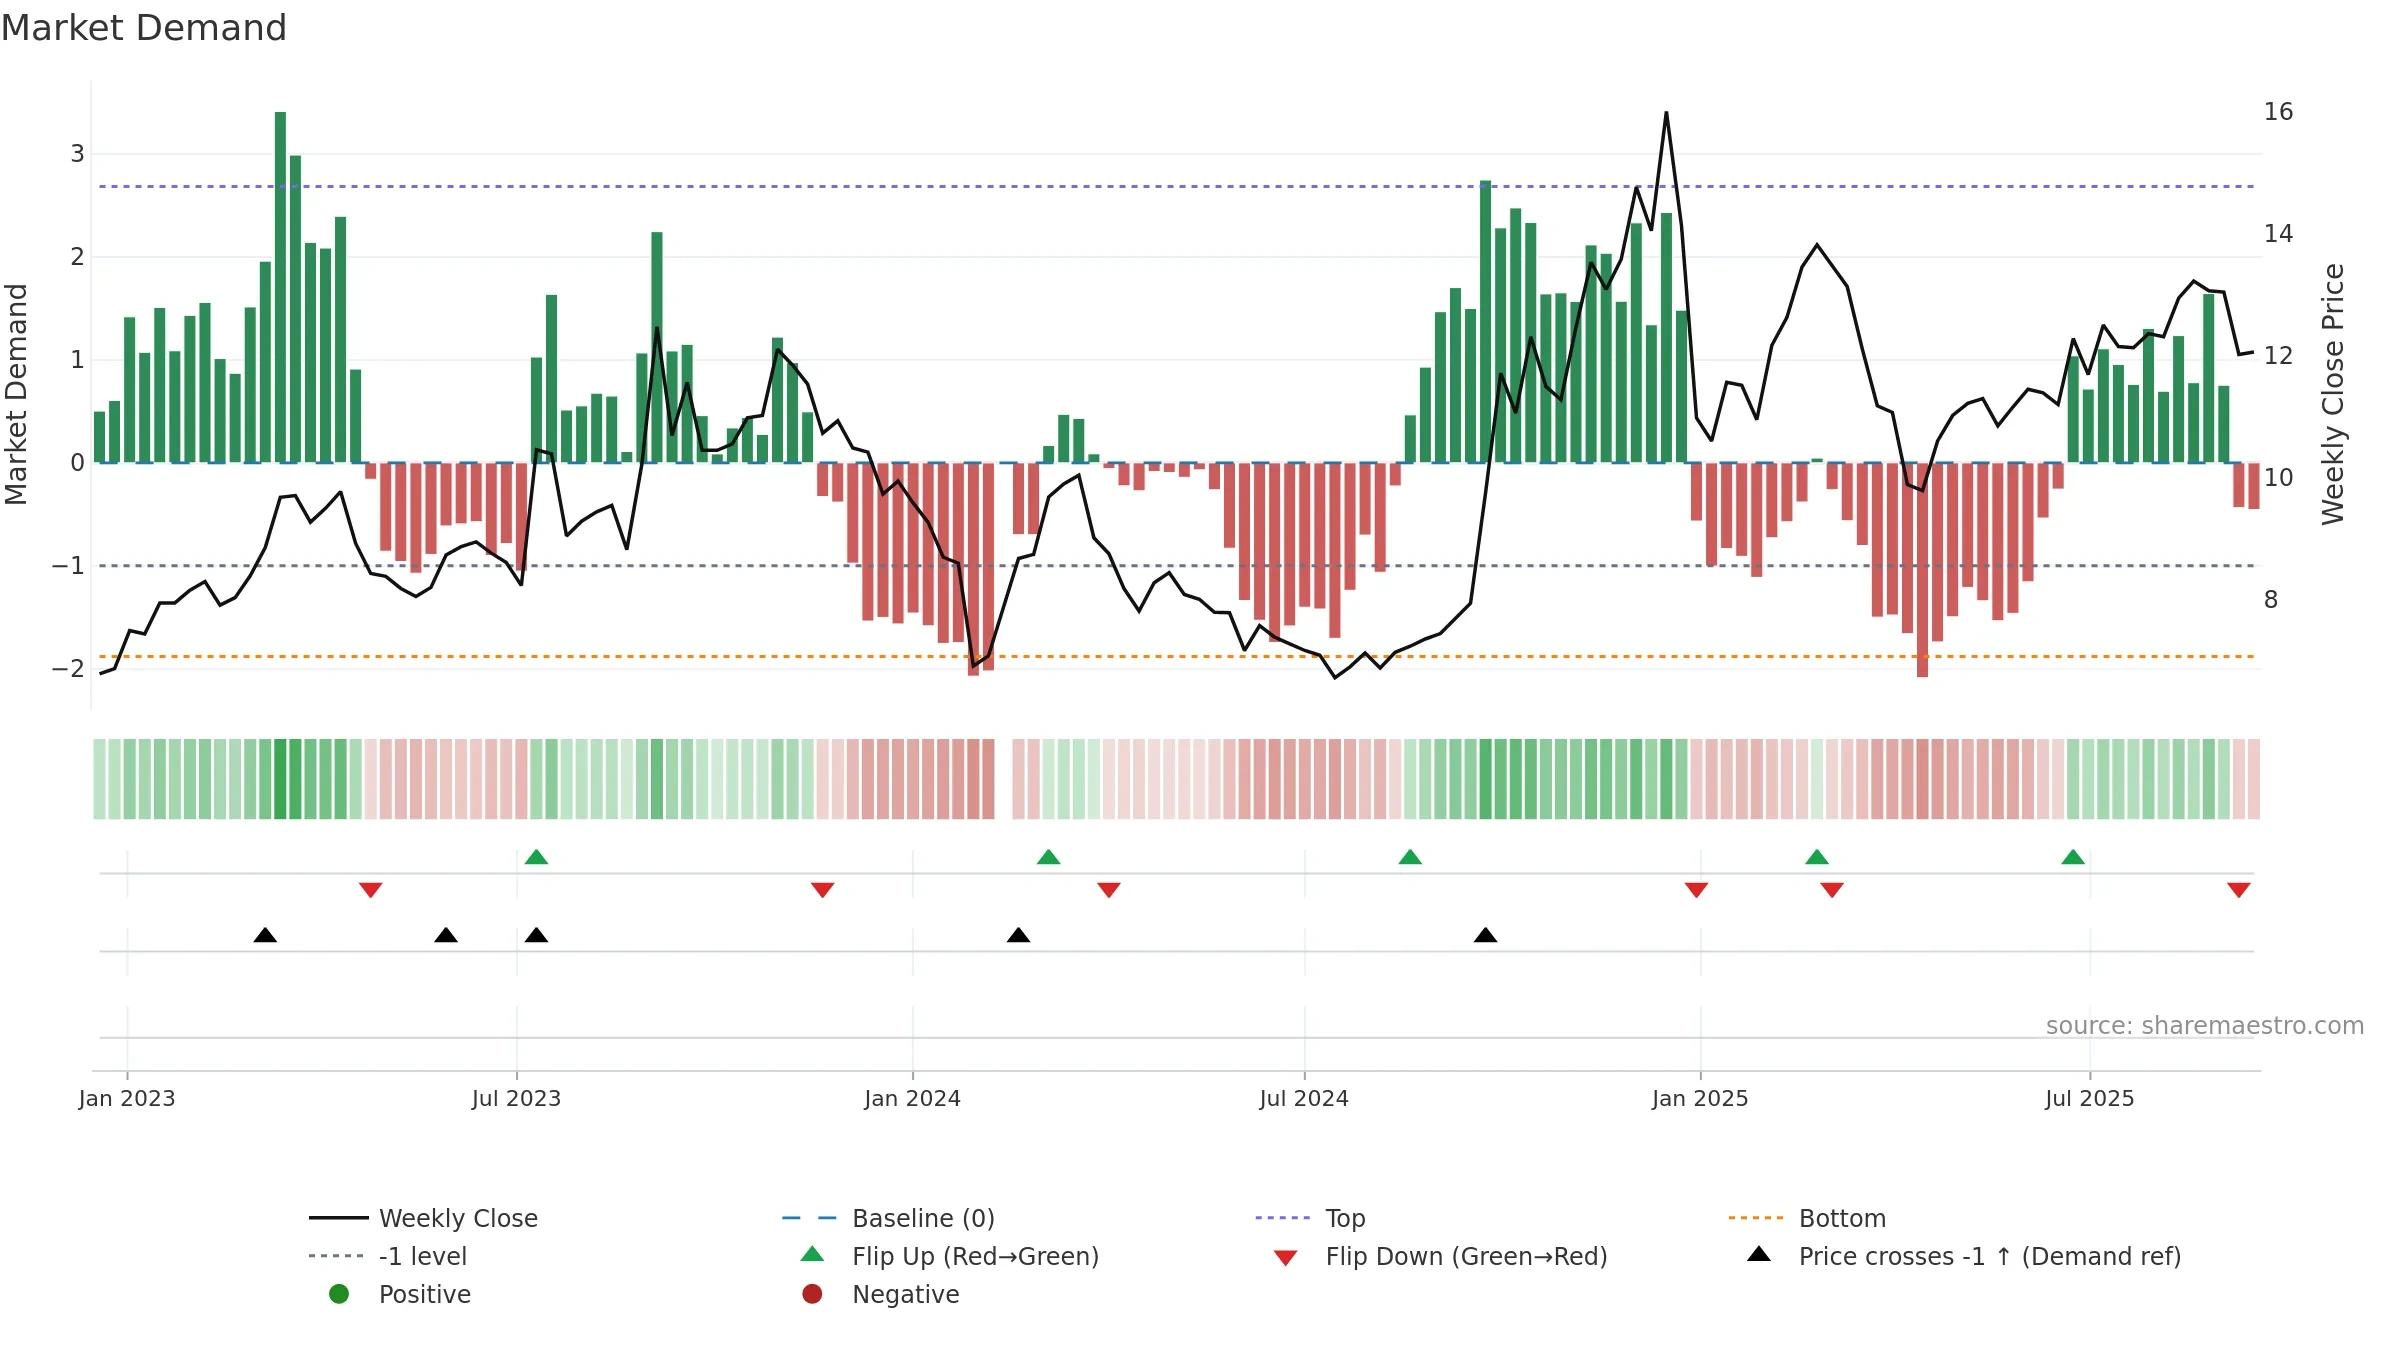
Price is below fair value; potential upside if momentum constructive.
Conclusion
Positive setup. ★★★★☆ confidence. Price window: -2. Trend: Range / Neutral; gauge 68. In combination, liquidity confirms the move.
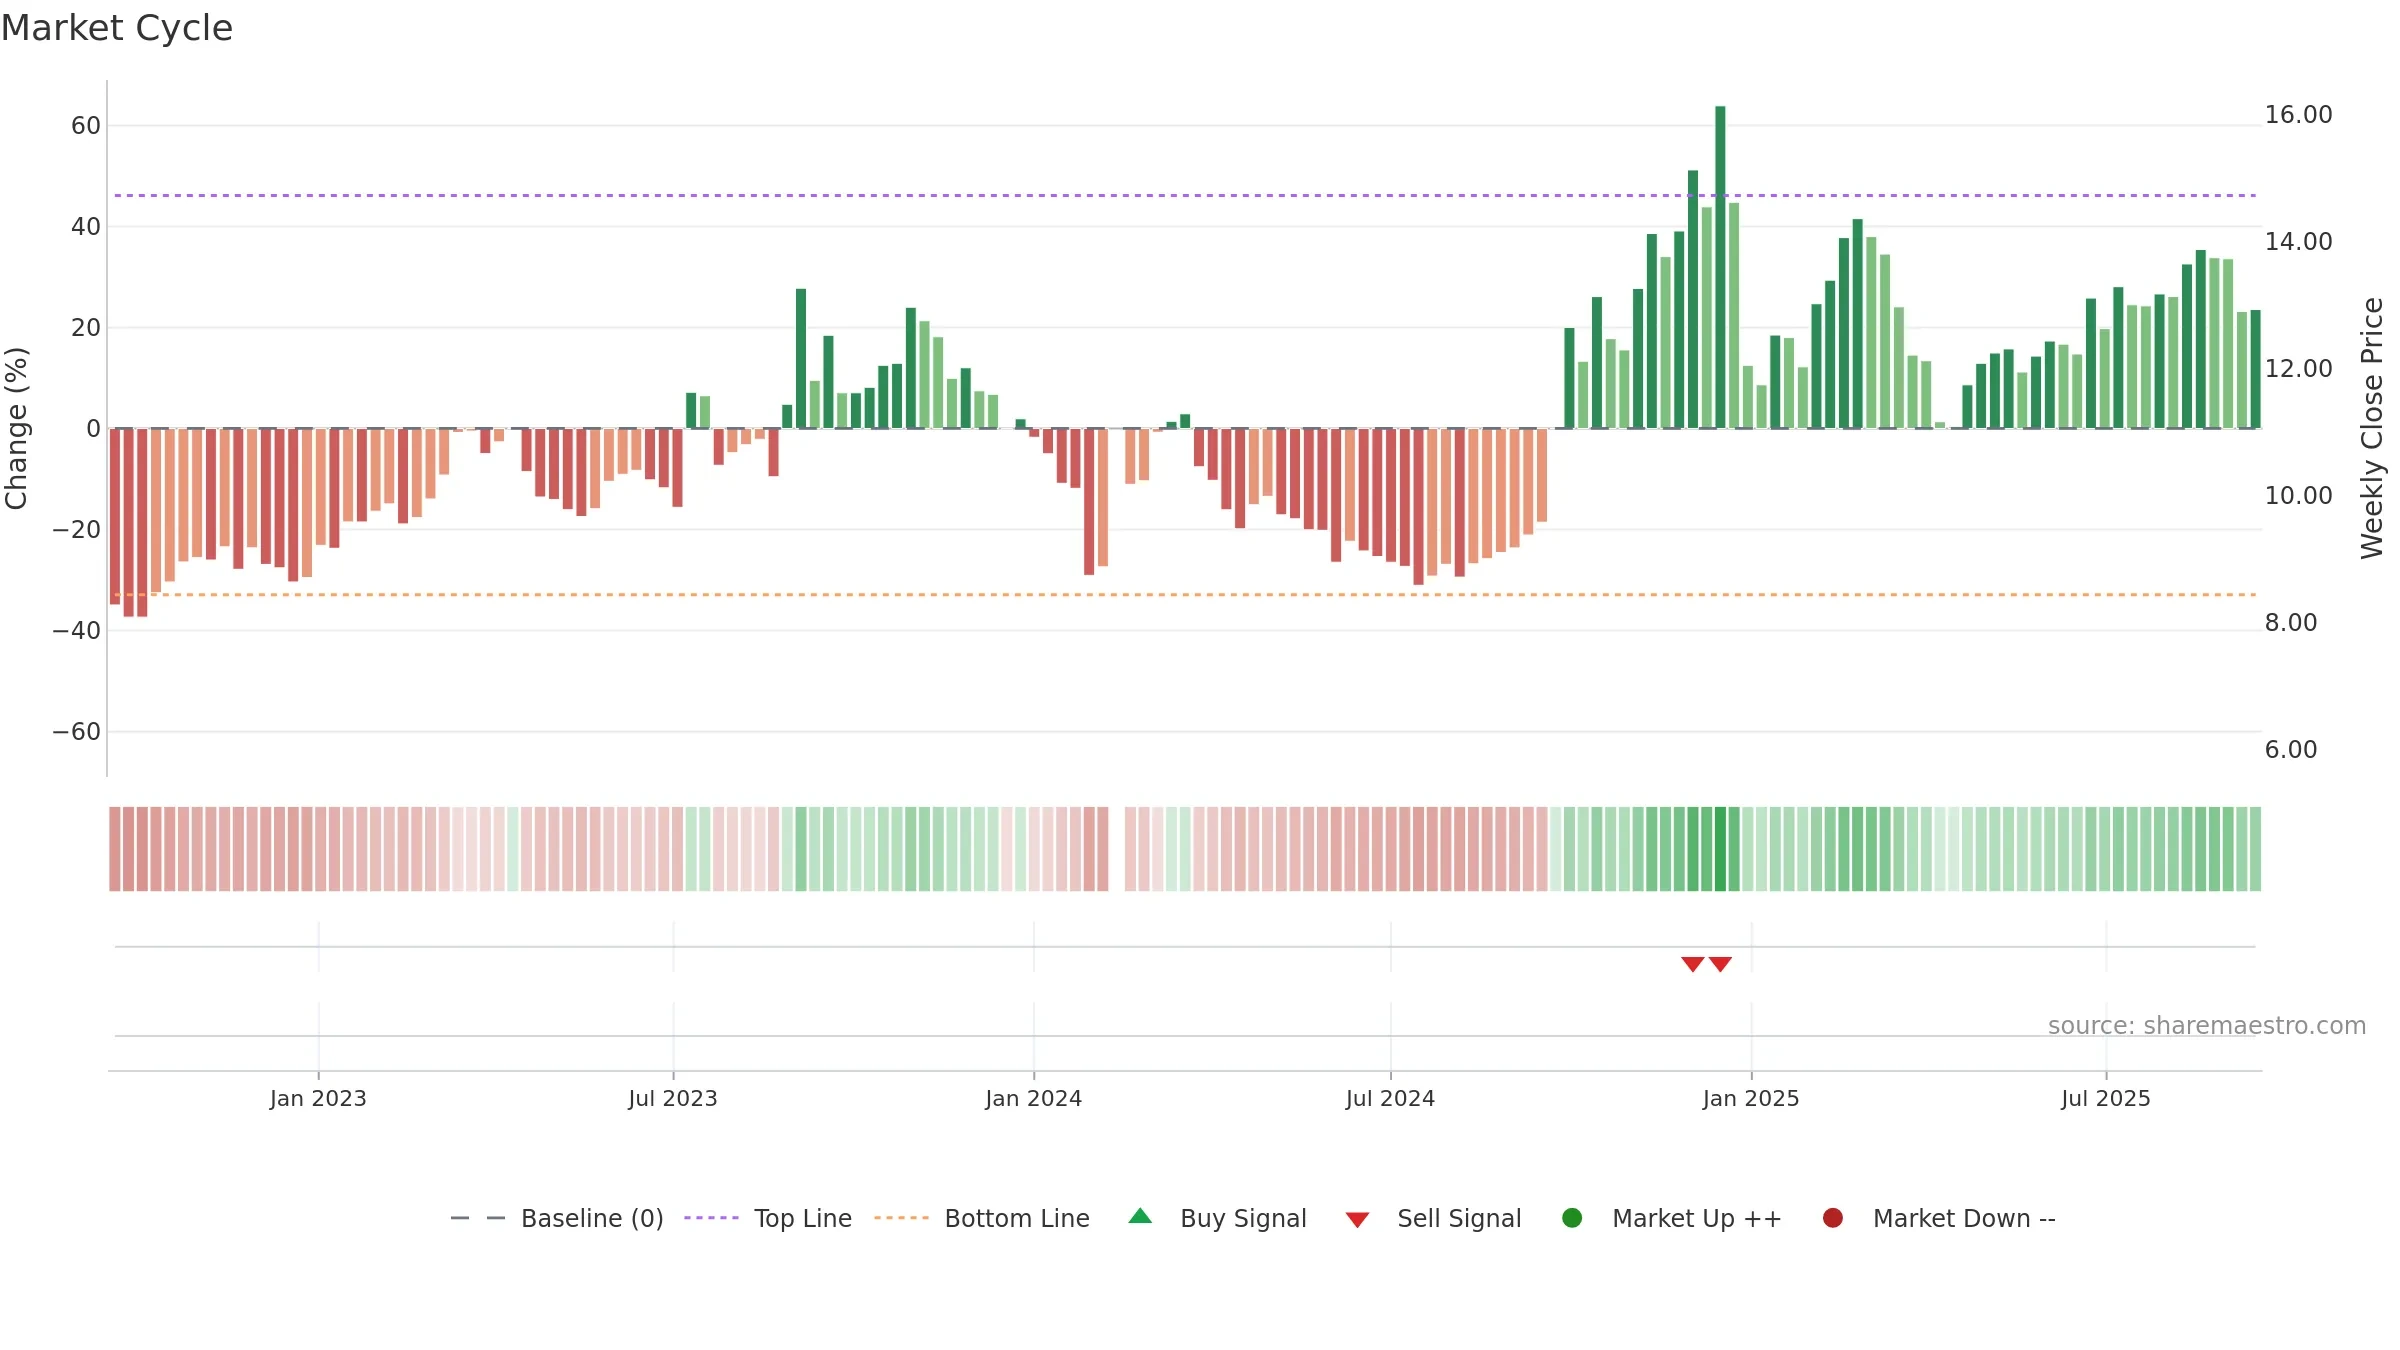
- Momentum is bullish and rising
- Liquidity confirms the price trend
- Low return volatility supports durability
- Price is not above key averages
- Negative multi-week performance
Why: Price window -2.43% over 8w. Close is -8.77% below the prior-window high. Return volatility 1.95%. Volume trend falling. Liquidity convergence with price. Trend state range / neutral. 4–8w crossover bearish. Momentum bullish and rising. Valuation supportive skew.
Tip: Most metrics include a hover tooltip where they appear in the report.