CHOSUN WELDING POHANG Co., Ltd
120030 KRX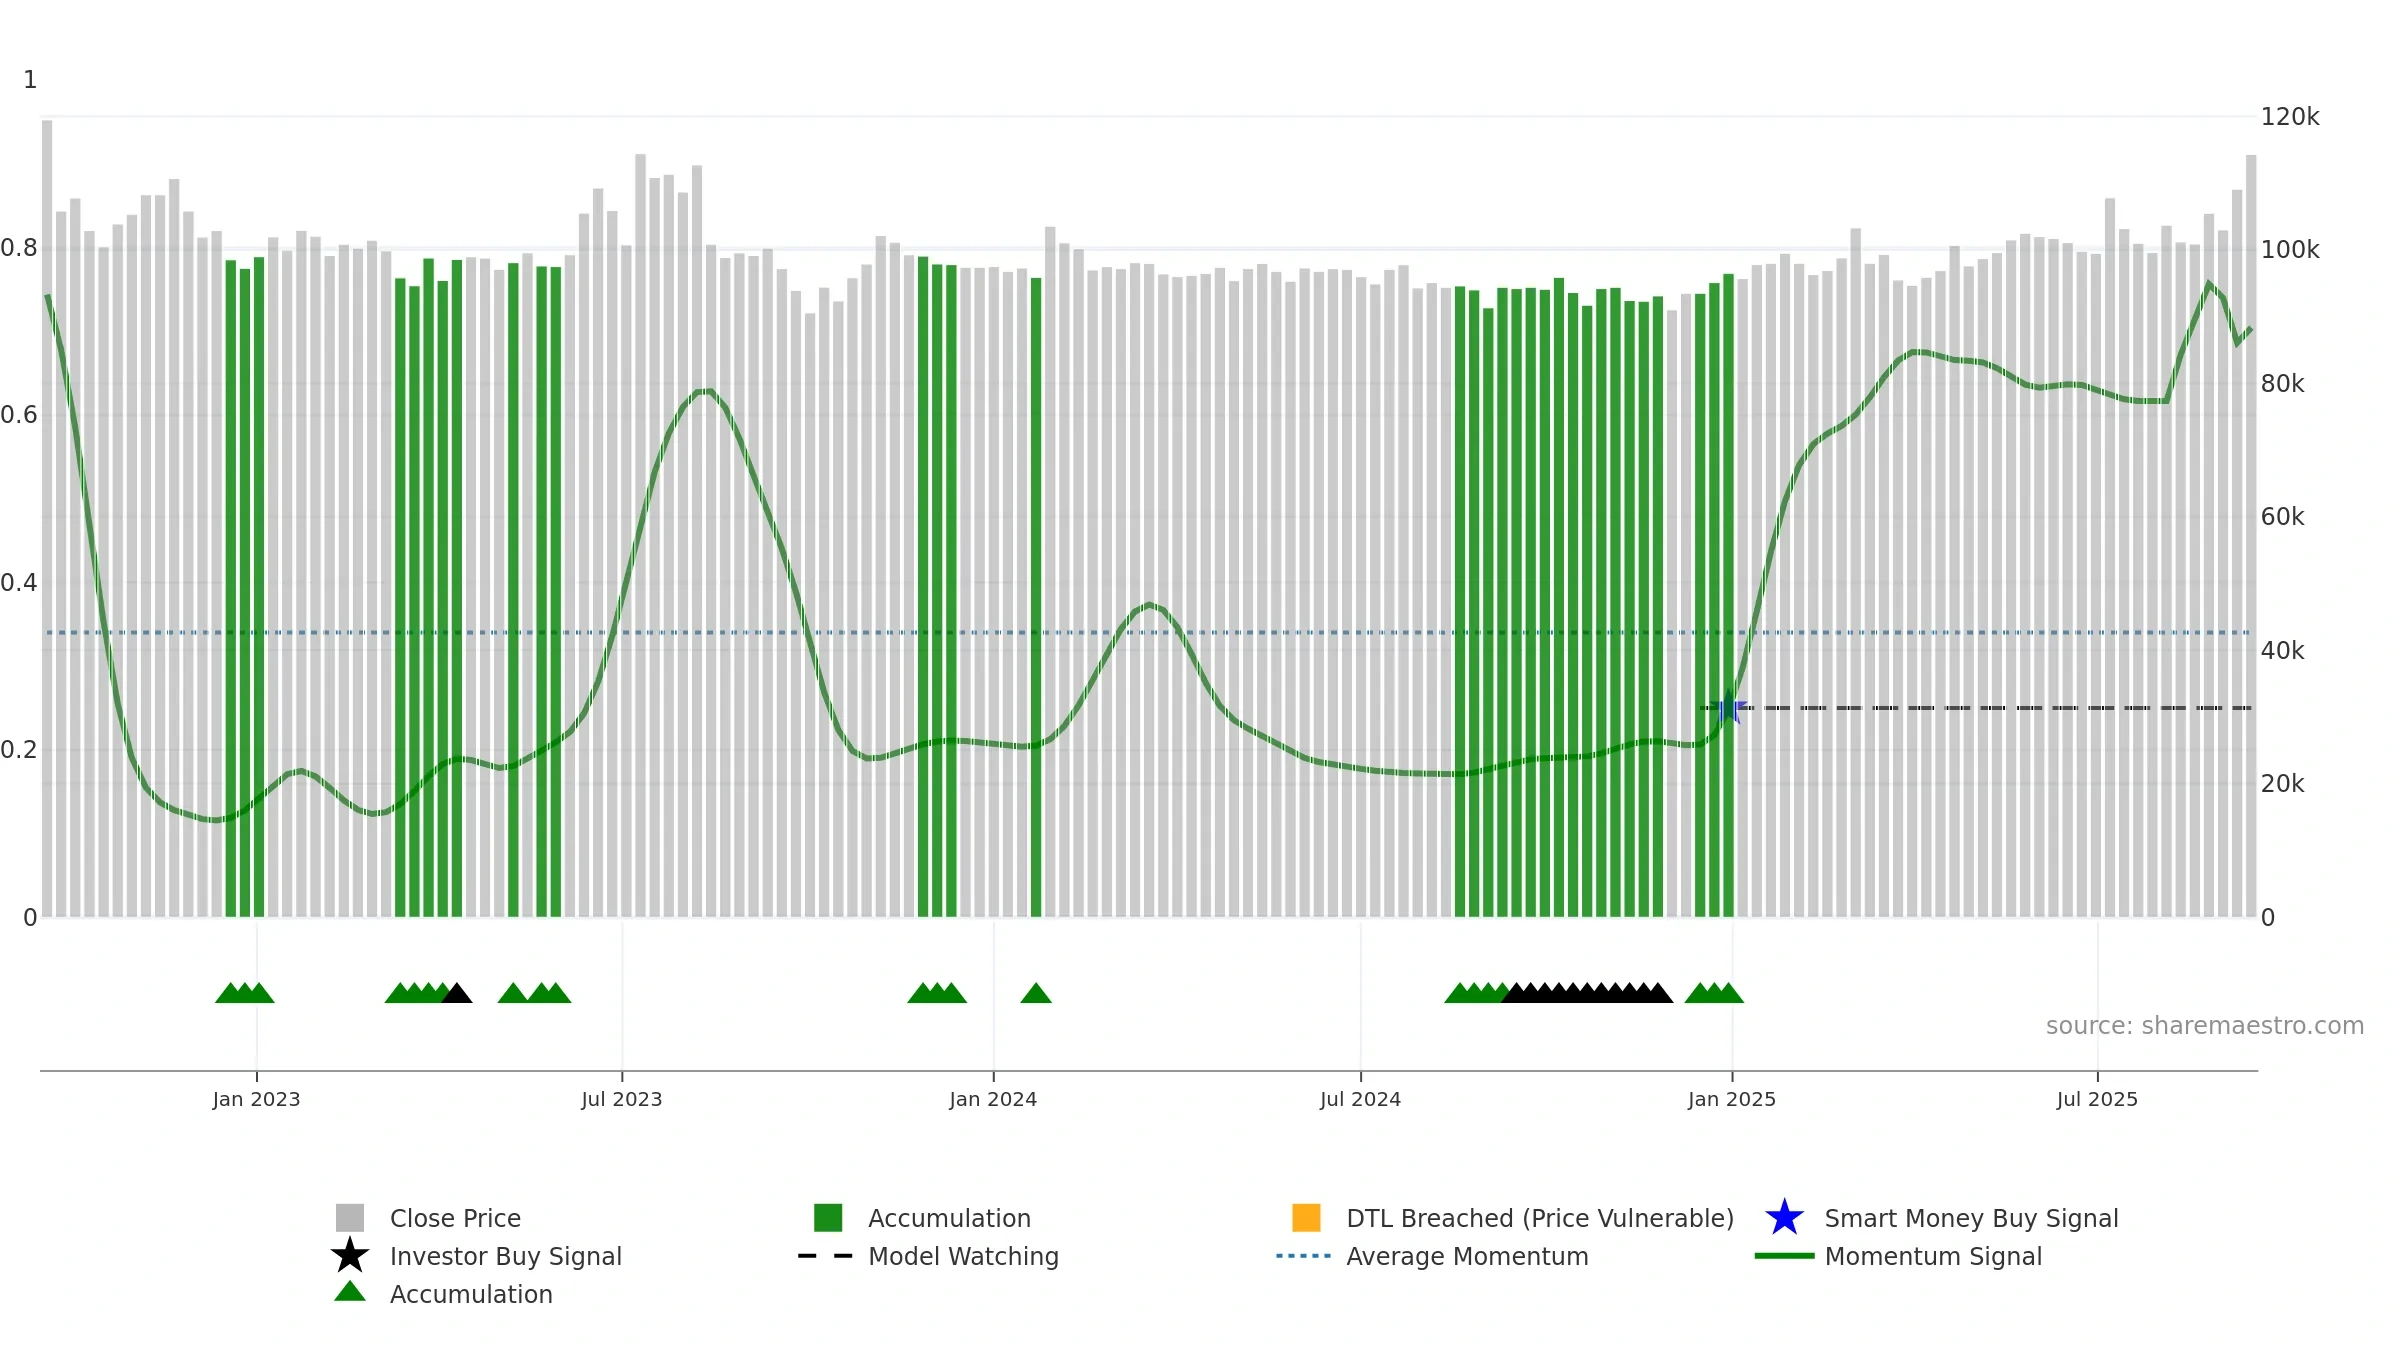
Weekly Report
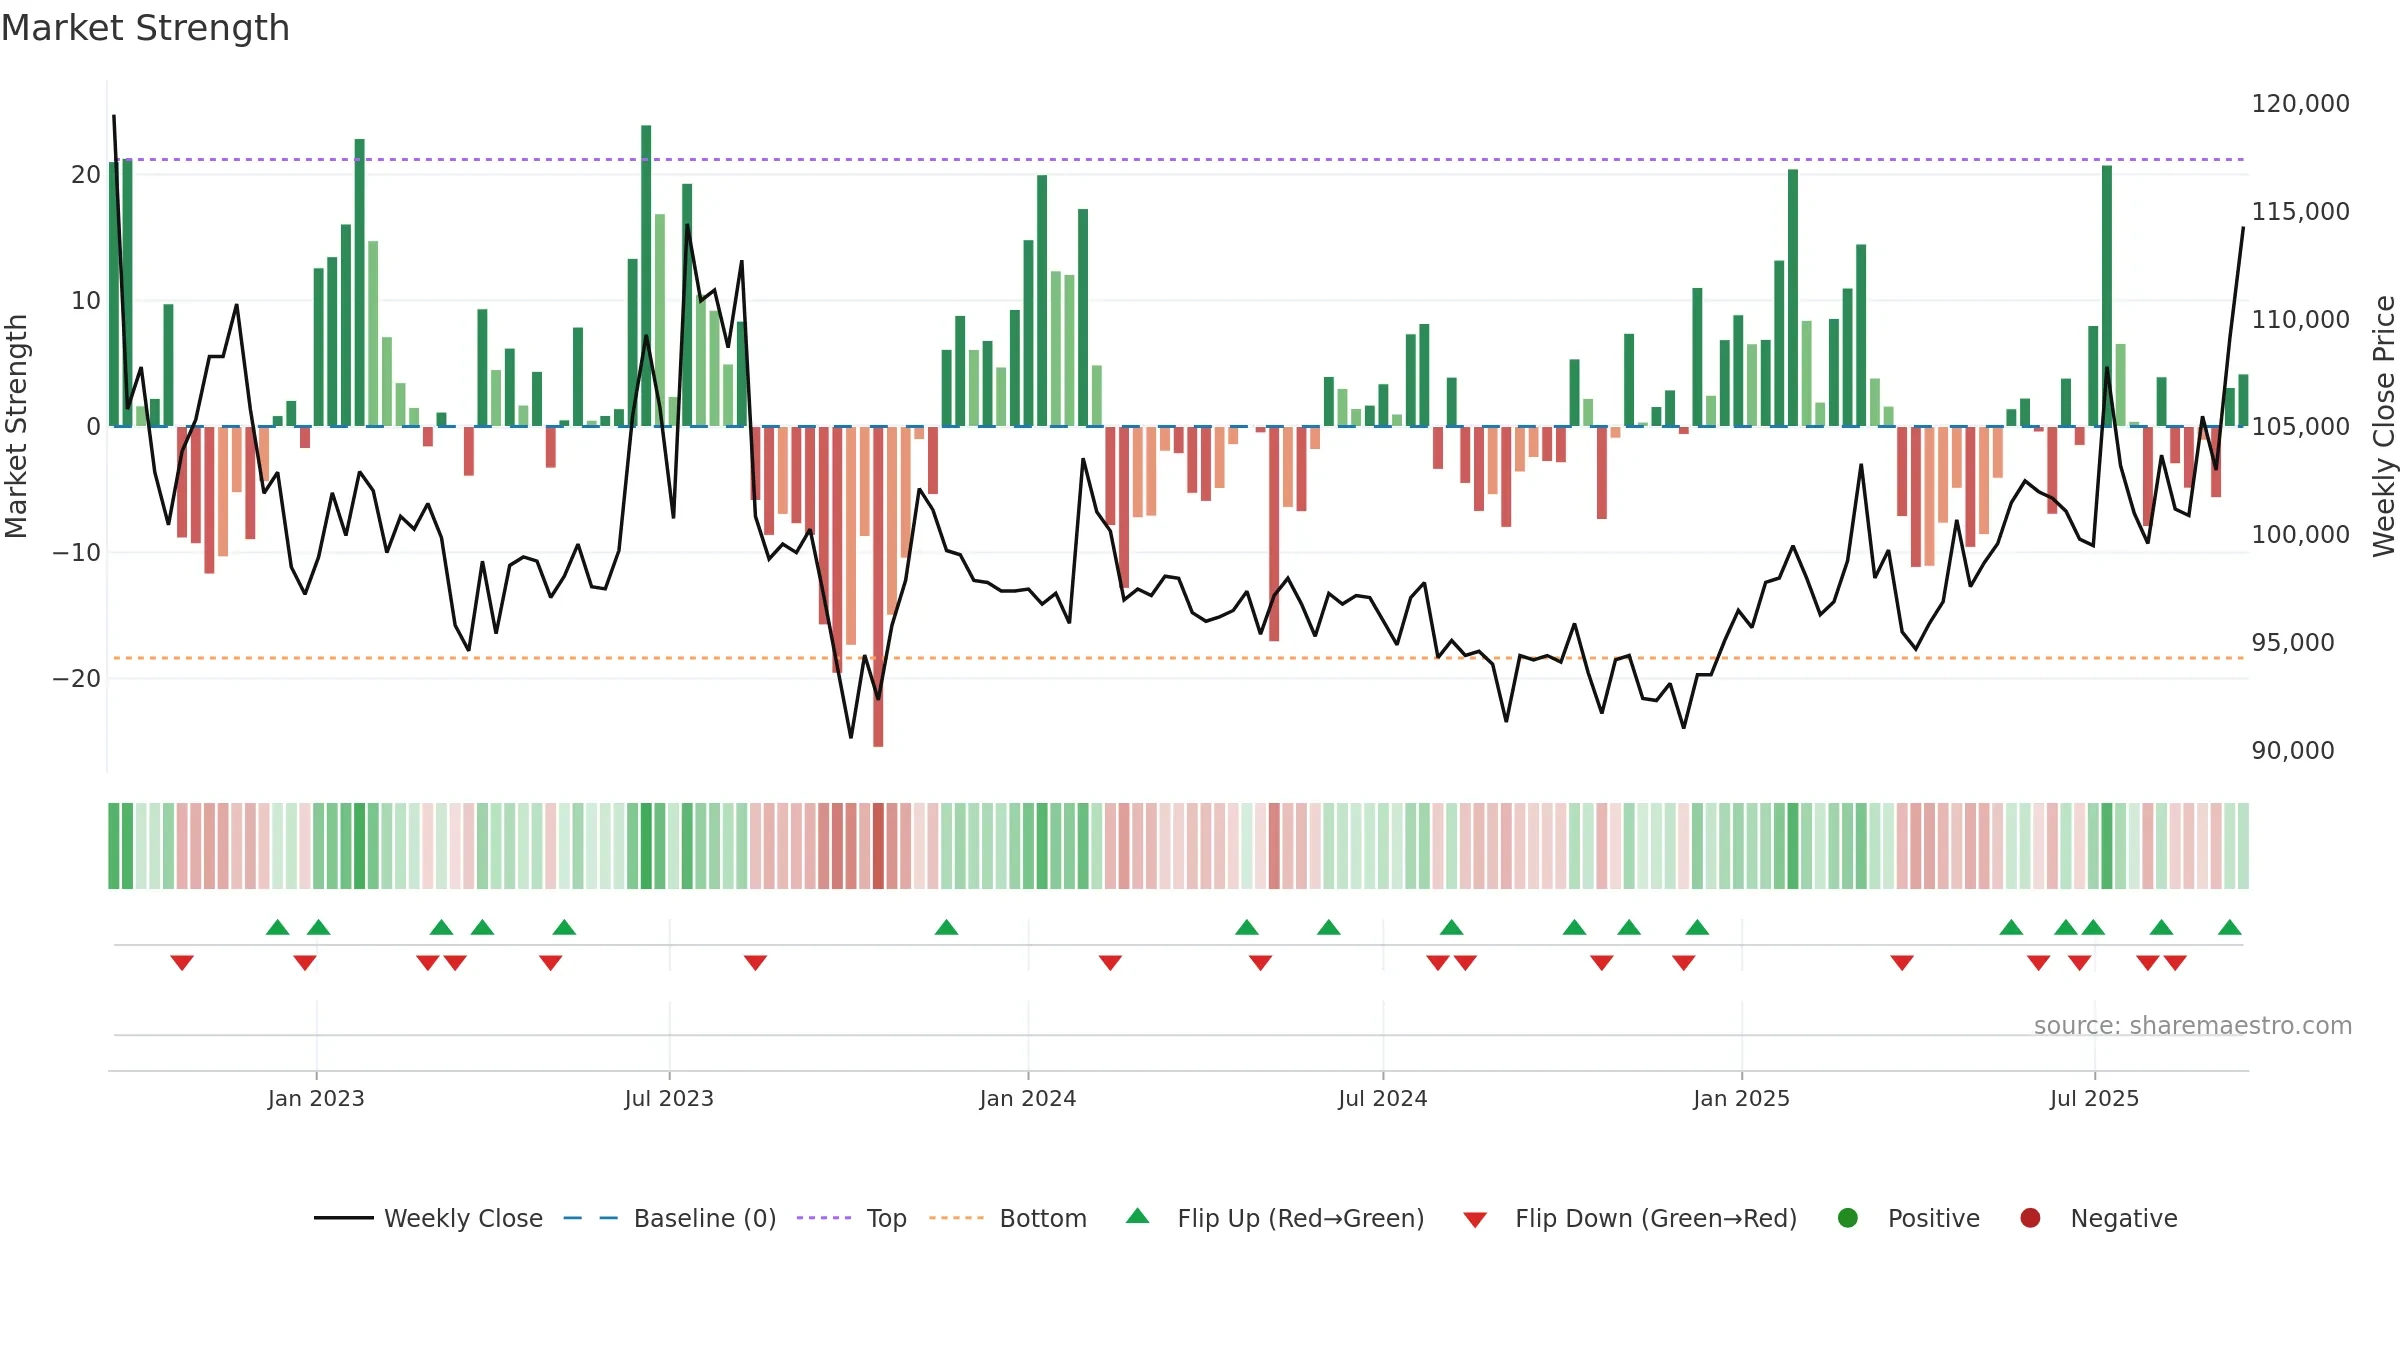
CHOSUN WELDING POHANG Co., Ltd closed at 114300.0000 (-4.11% WoW) . Data window ends Mon, 15 Sep 2025.
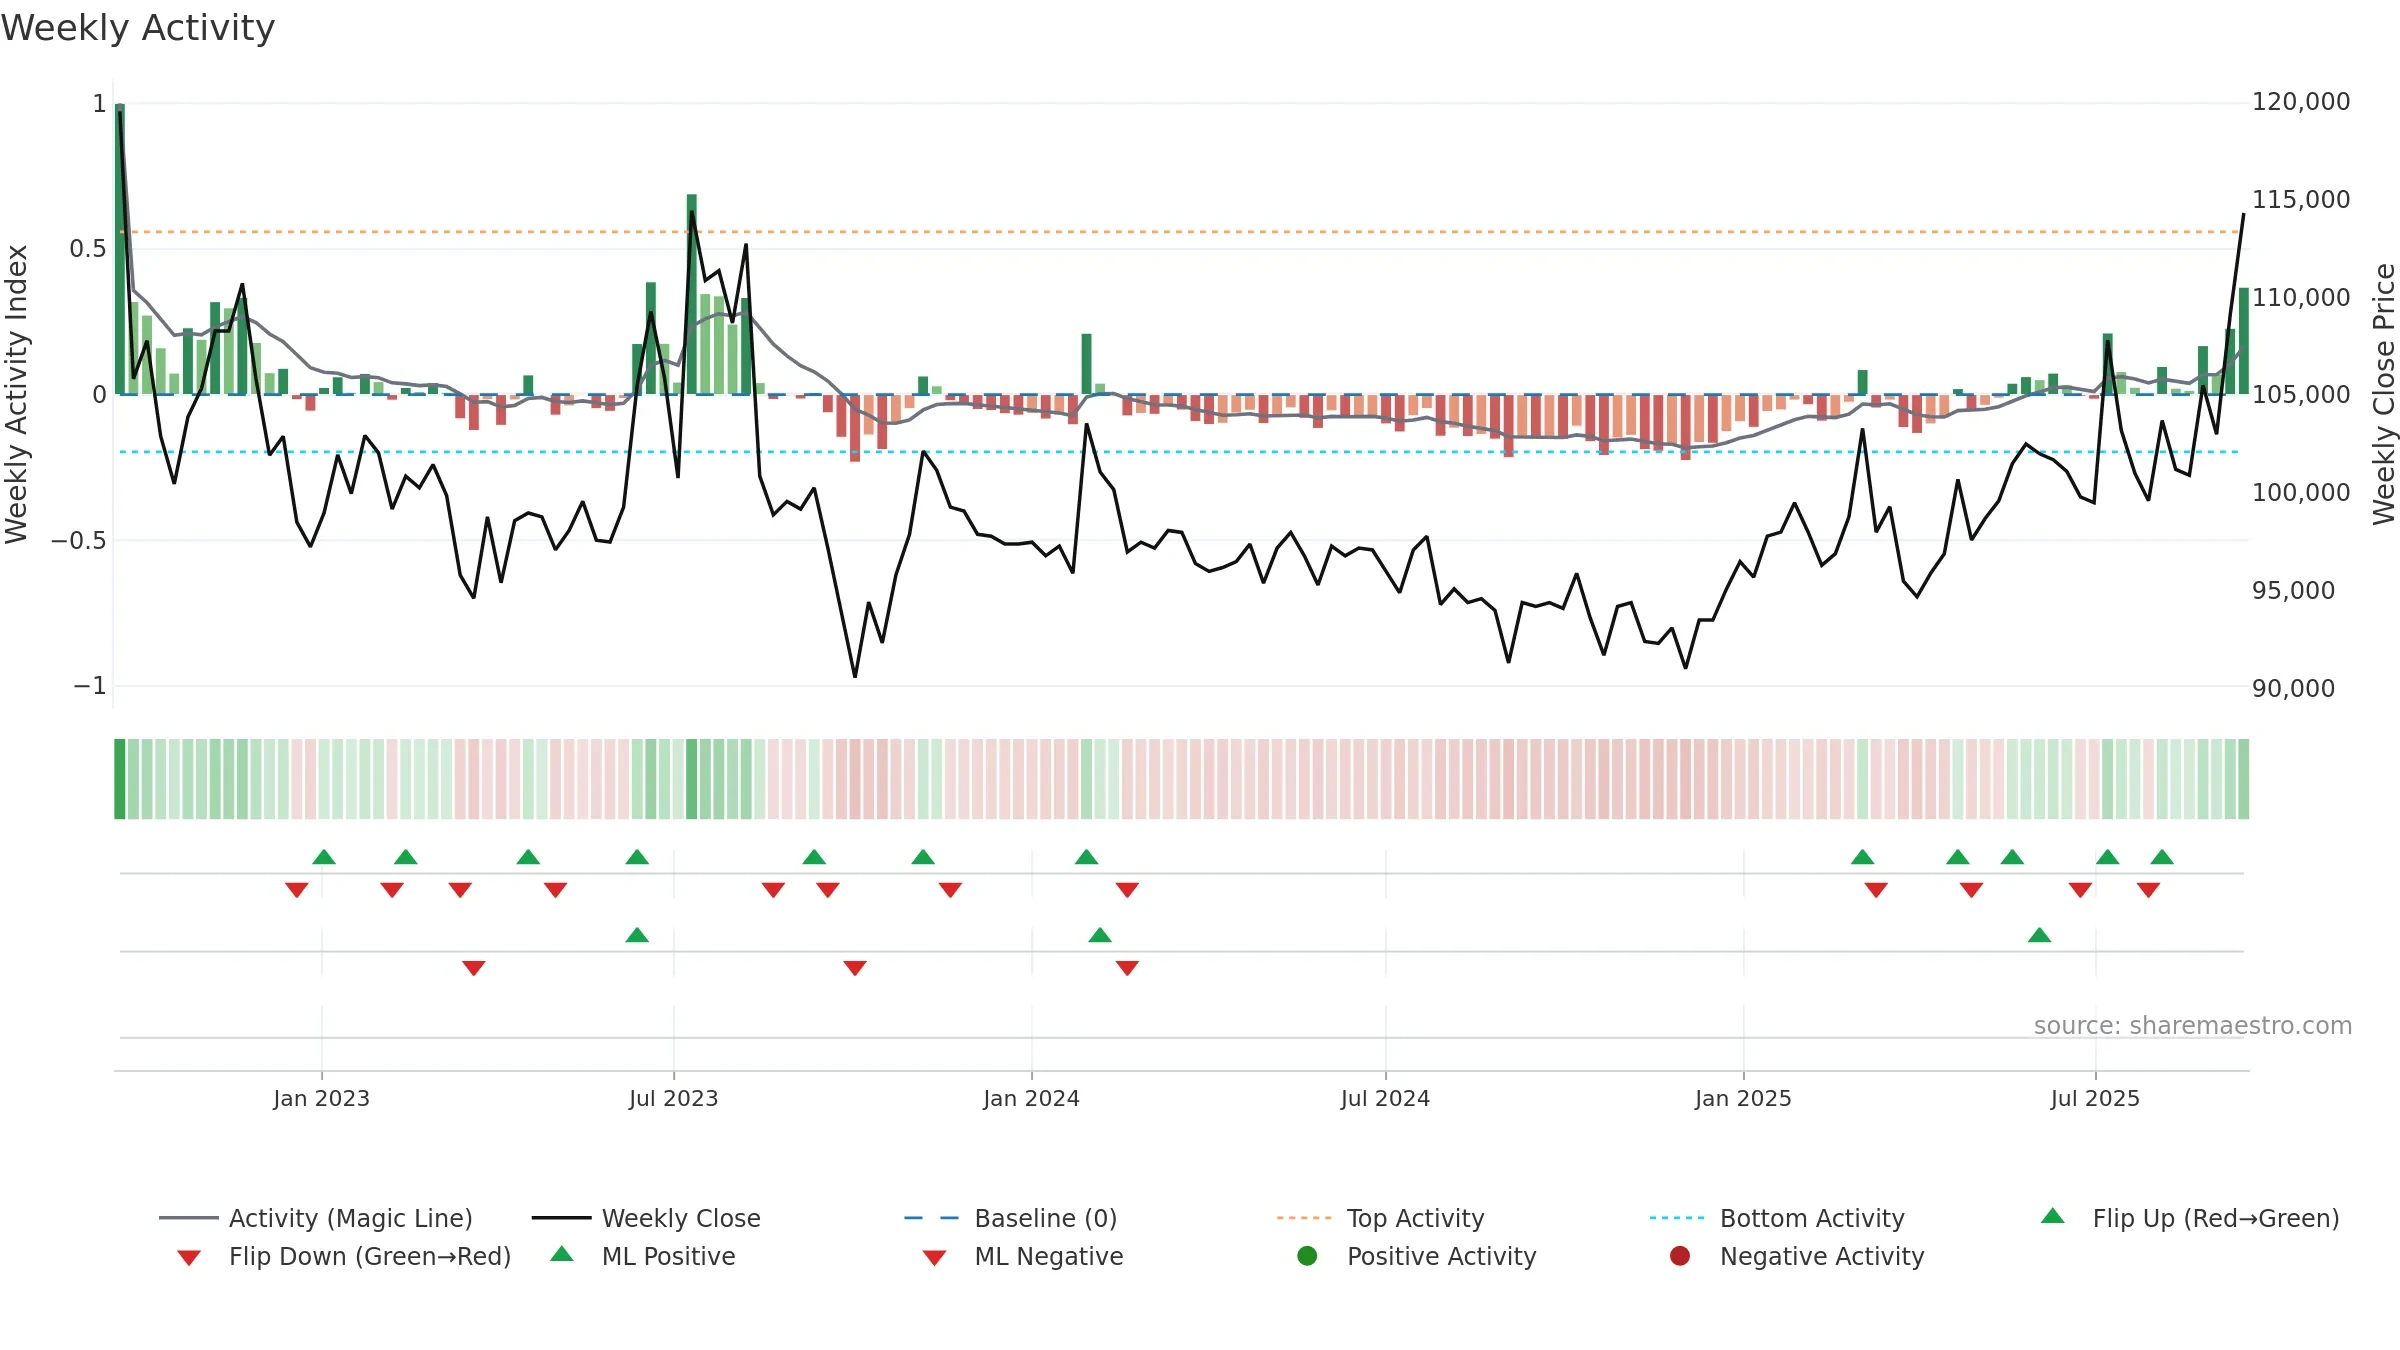
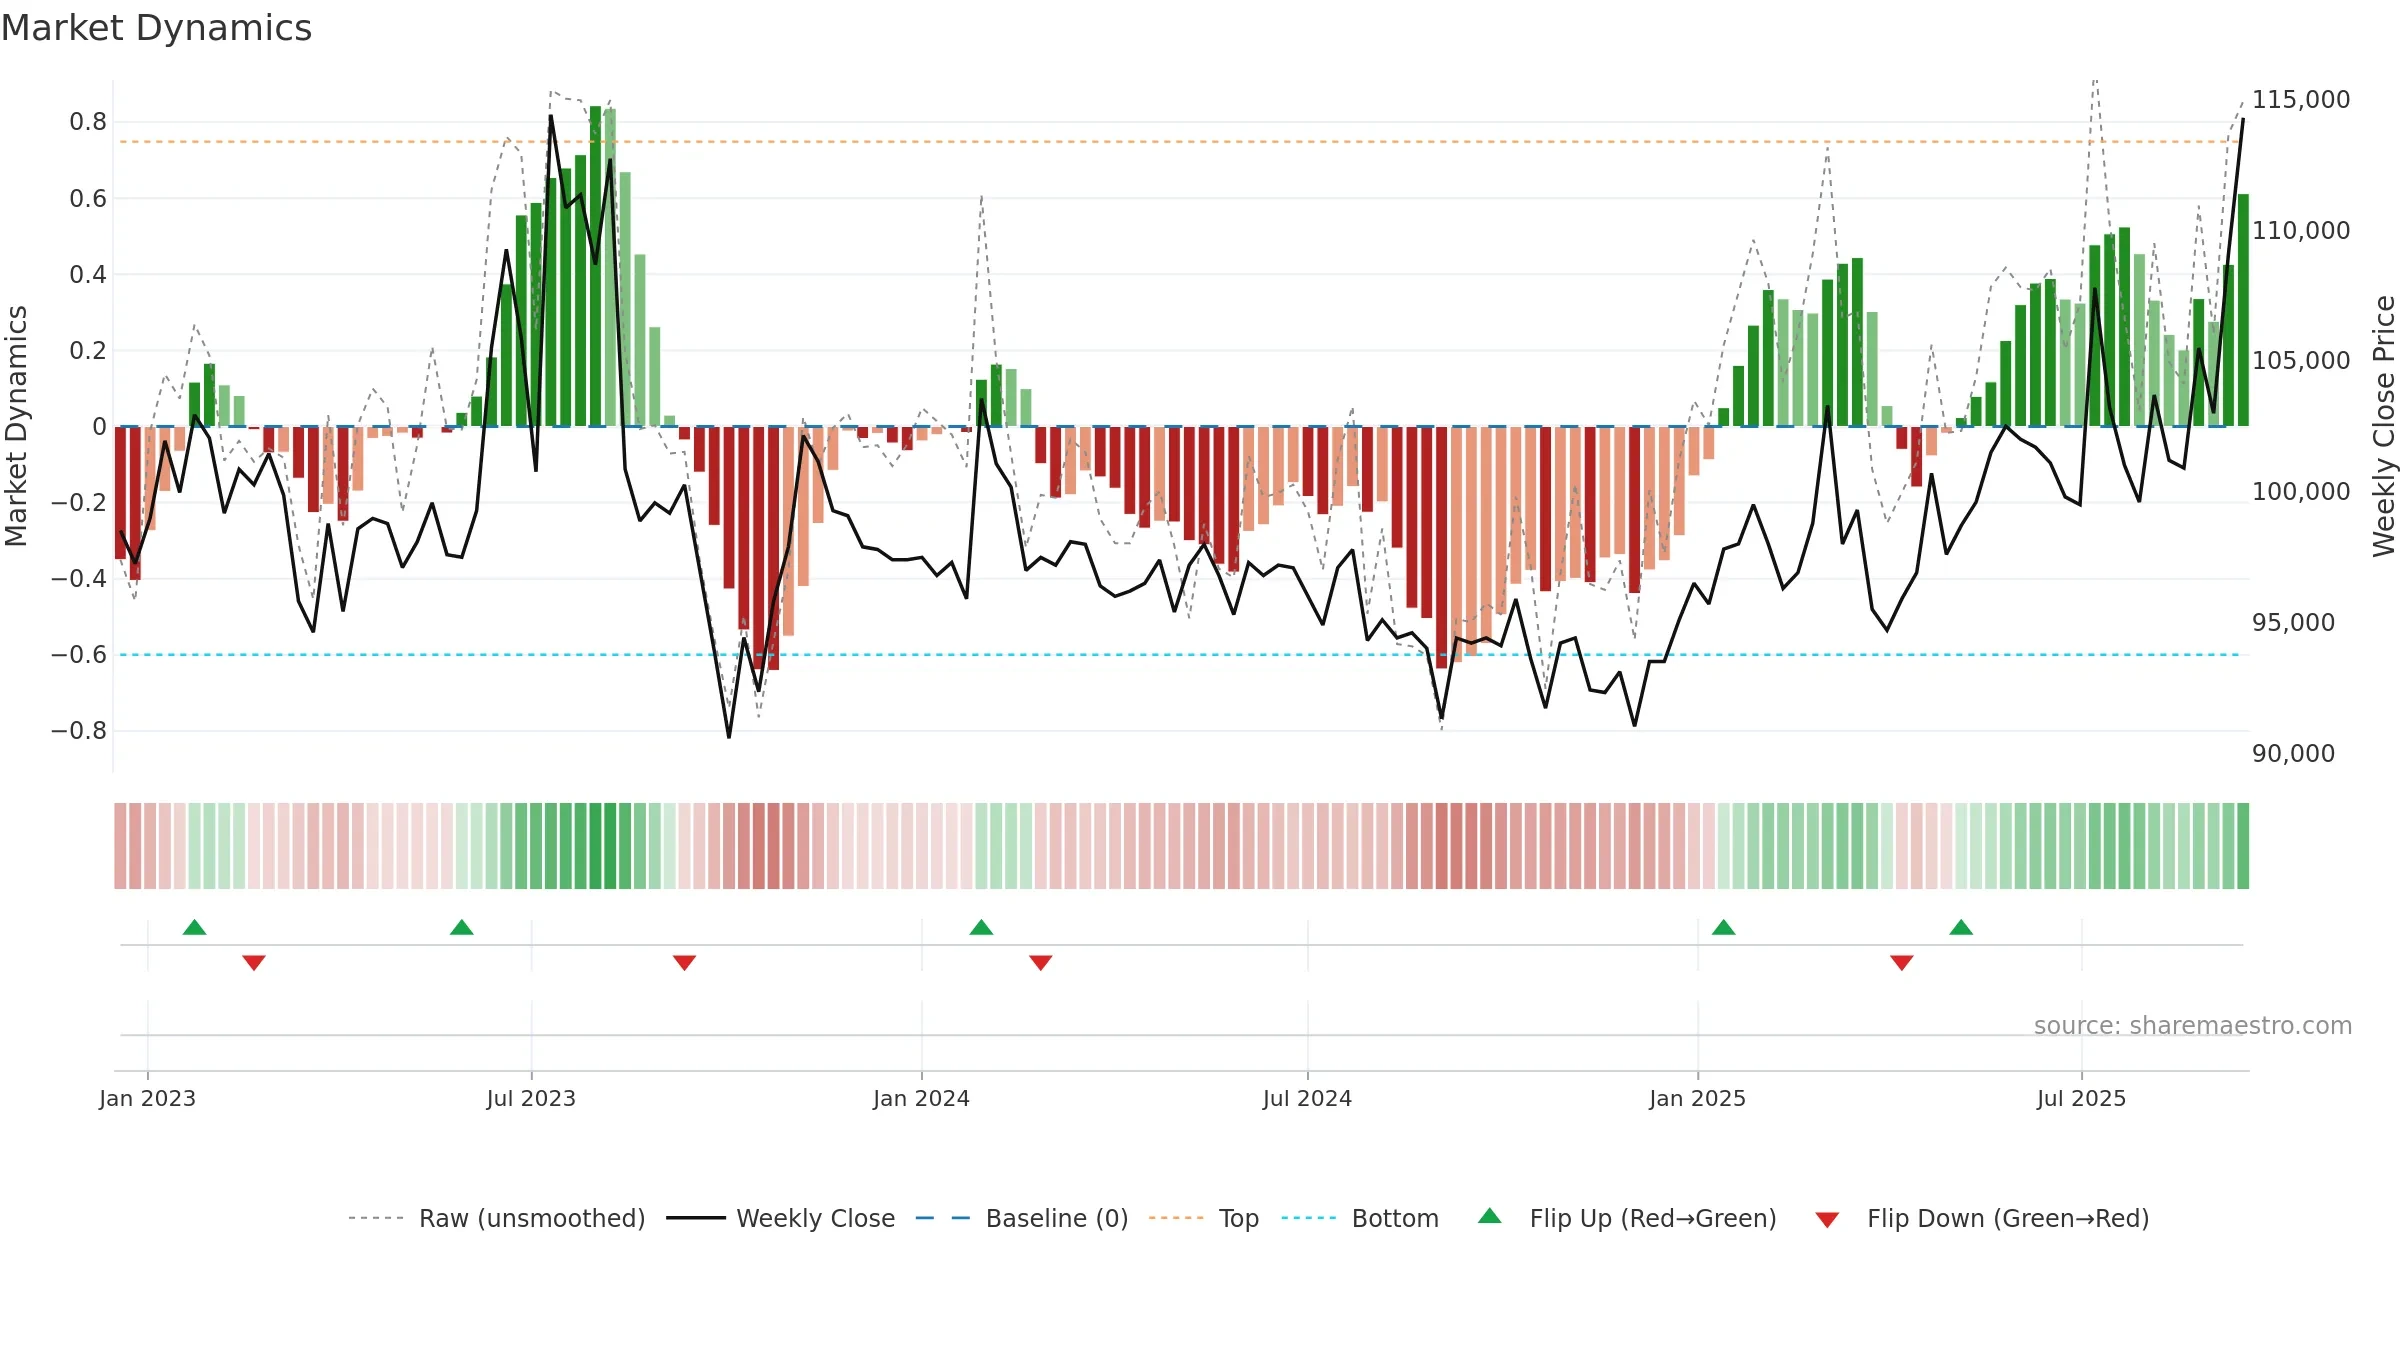
How to read this — Price slope is upward, indicating persistent buying over the window. Volume and price are moving in the same direction — a constructive confirmation. Returns are positively correlated with volume — strength tends to arrive on higher activity. Price is stretched above its baseline; consolidation risk rises if activity fades. Constructive MA stack supports the up-drift; pullbacks may find support at the 8–13 week region. Price holds above key averages, indicating constructive participation.
Up-slope supports buying interest; pullbacks may be contained if activity stays firm.
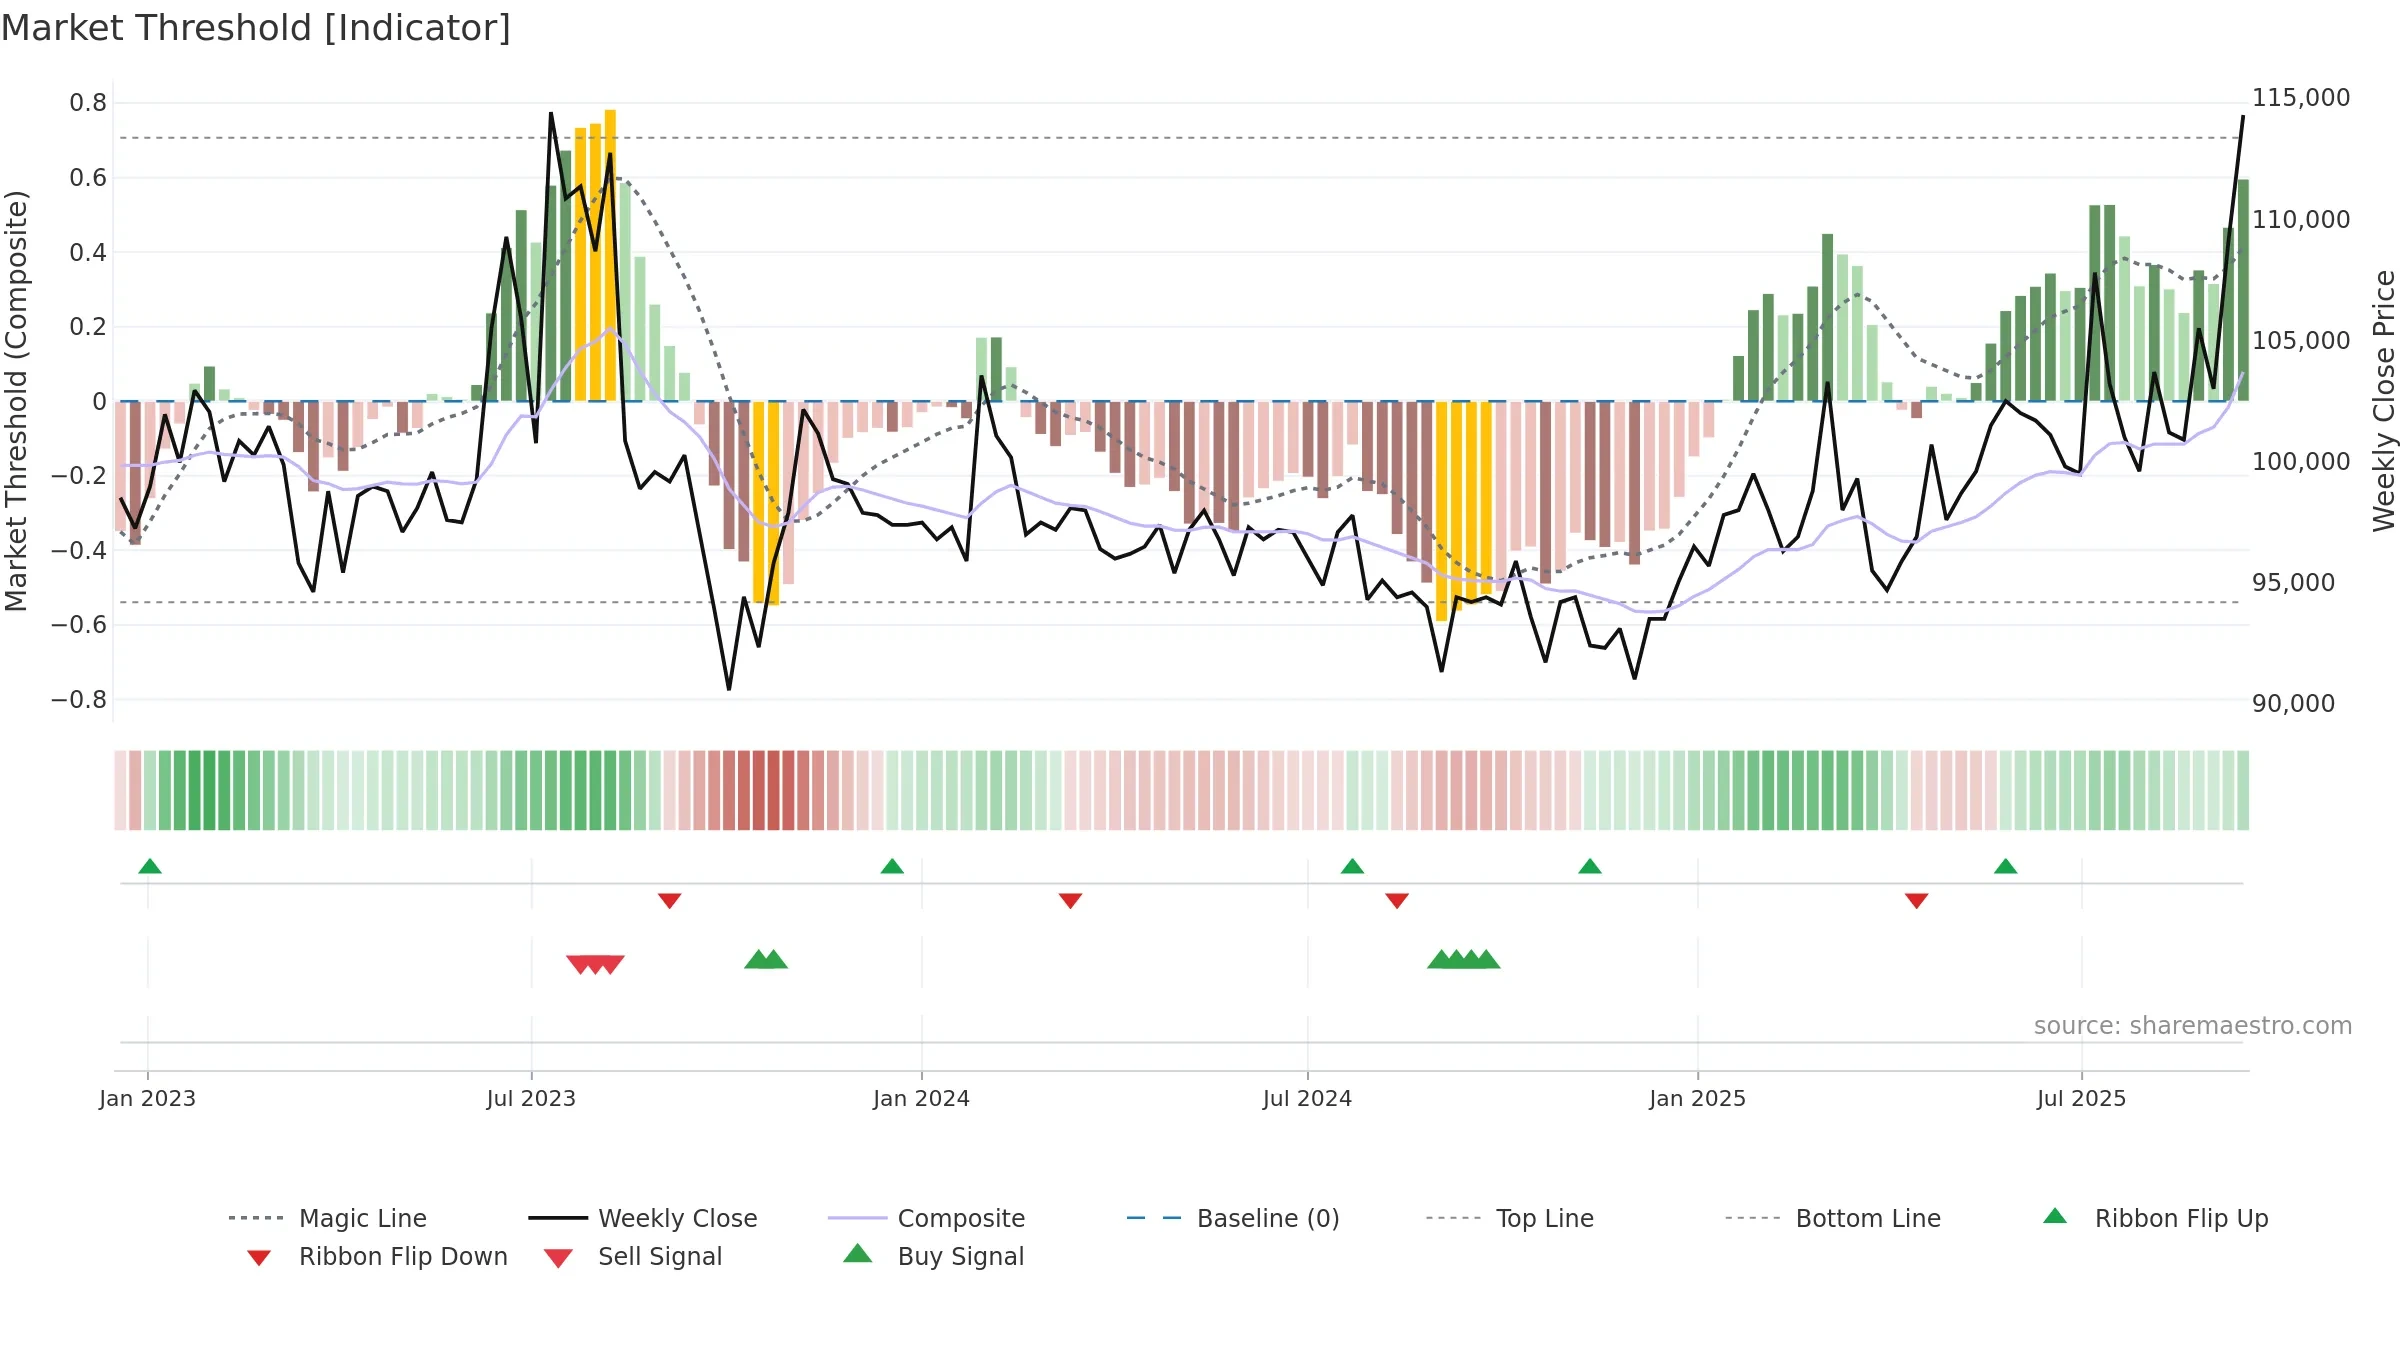
Gauge maps the trend signal to a 0–100 scale.
How to read this — Gauge is elevated but momentum is rolling over; topping risk is rising.
Stay alert: protect gains or seek confirmation before adding risk.
Conclusion
Positive setup. ★★★★☆ confidence. Price window: 14. Trend: Uptrend at Risk; gauge 70. In combination, liquidity confirms the move.
- Momentum is bullish and rising
- Price holds above 8w & 26w averages
- Constructive moving-average stack
- Liquidity confirms the price trend
- High-level but rolling over (topping risk)
Why: Price window 14.76% over 8w. Close is 4.77% above the prior-window high. Volume trend rising. Liquidity convergence with price. Trend state uptrend at risk. MA stack constructive. Momentum bullish and rising.
Tip: Most metrics include a hover tooltip where they appear in the report.