Alphaville S.A.
AVLL3 BVMF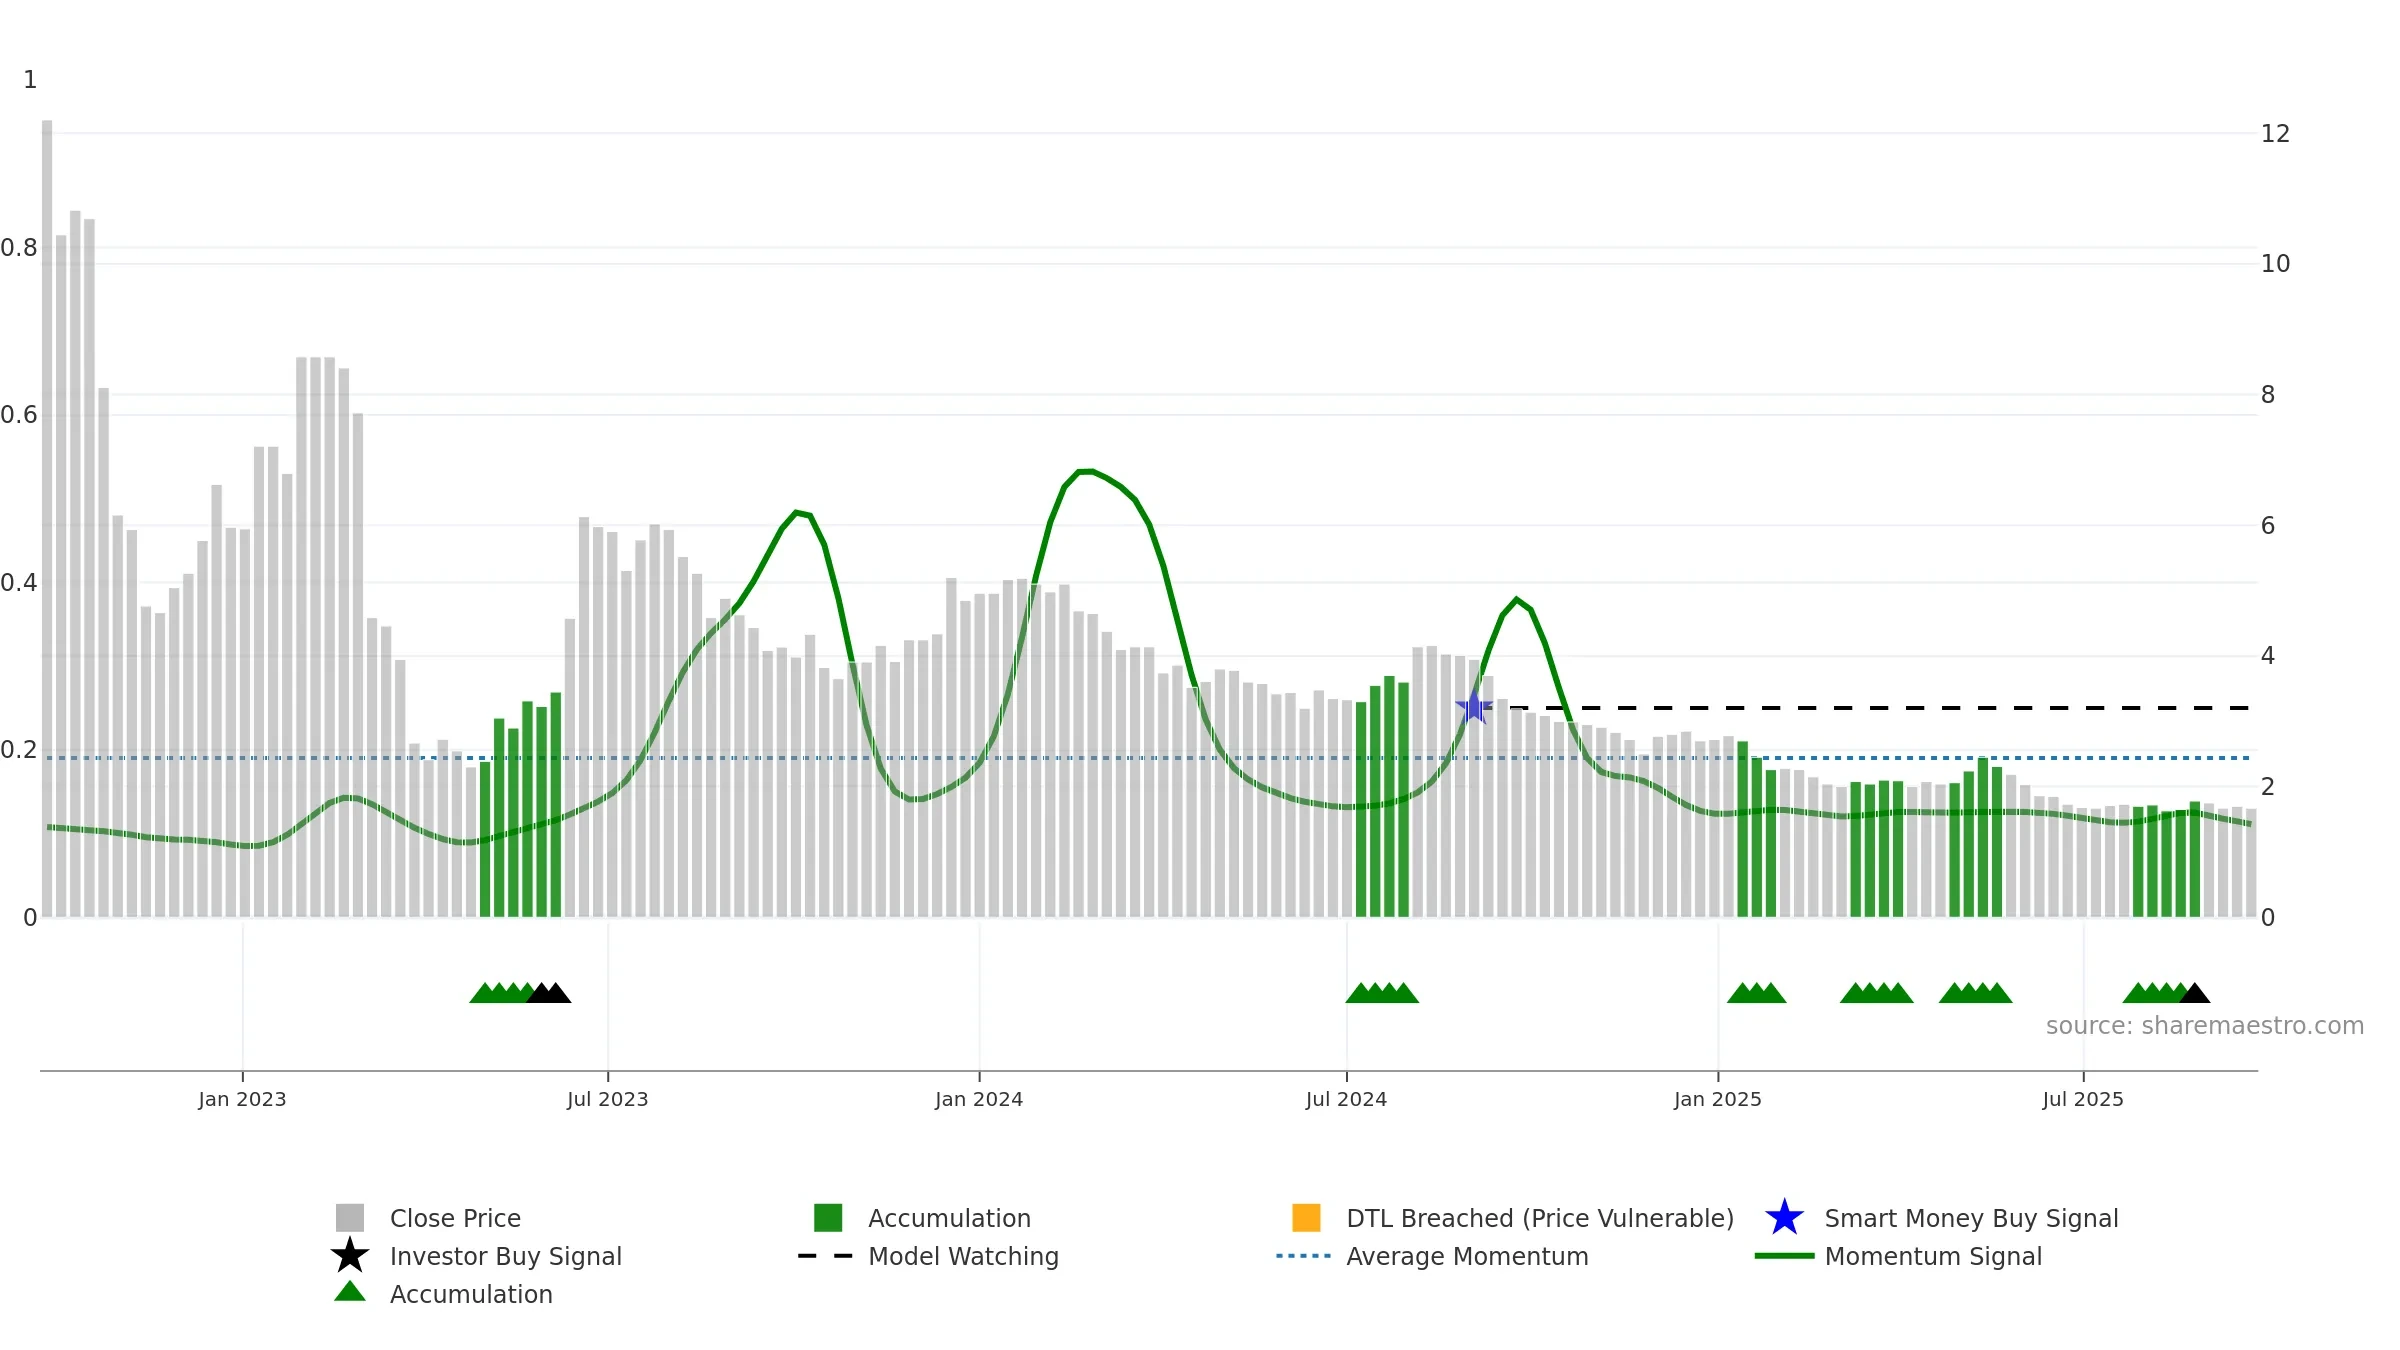
Weekly Summary
Alphaville S.A. closed at 1.6700 (-1.76% WoW) . Data window ends Mon, 22 Sep 2025.
How to read this — Price slope is upward, indicating persistent buying over the window. Elevated weekly volatility increases whipsaw risk. Volume and price are moving in the same direction — a constructive confirmation. Returns are positively correlated with volume — strength tends to arrive on higher activity. Price sits below key averages, keeping pressure on the tape.
Up-slope supports buying interest; pullbacks may be contained if activity stays firm.
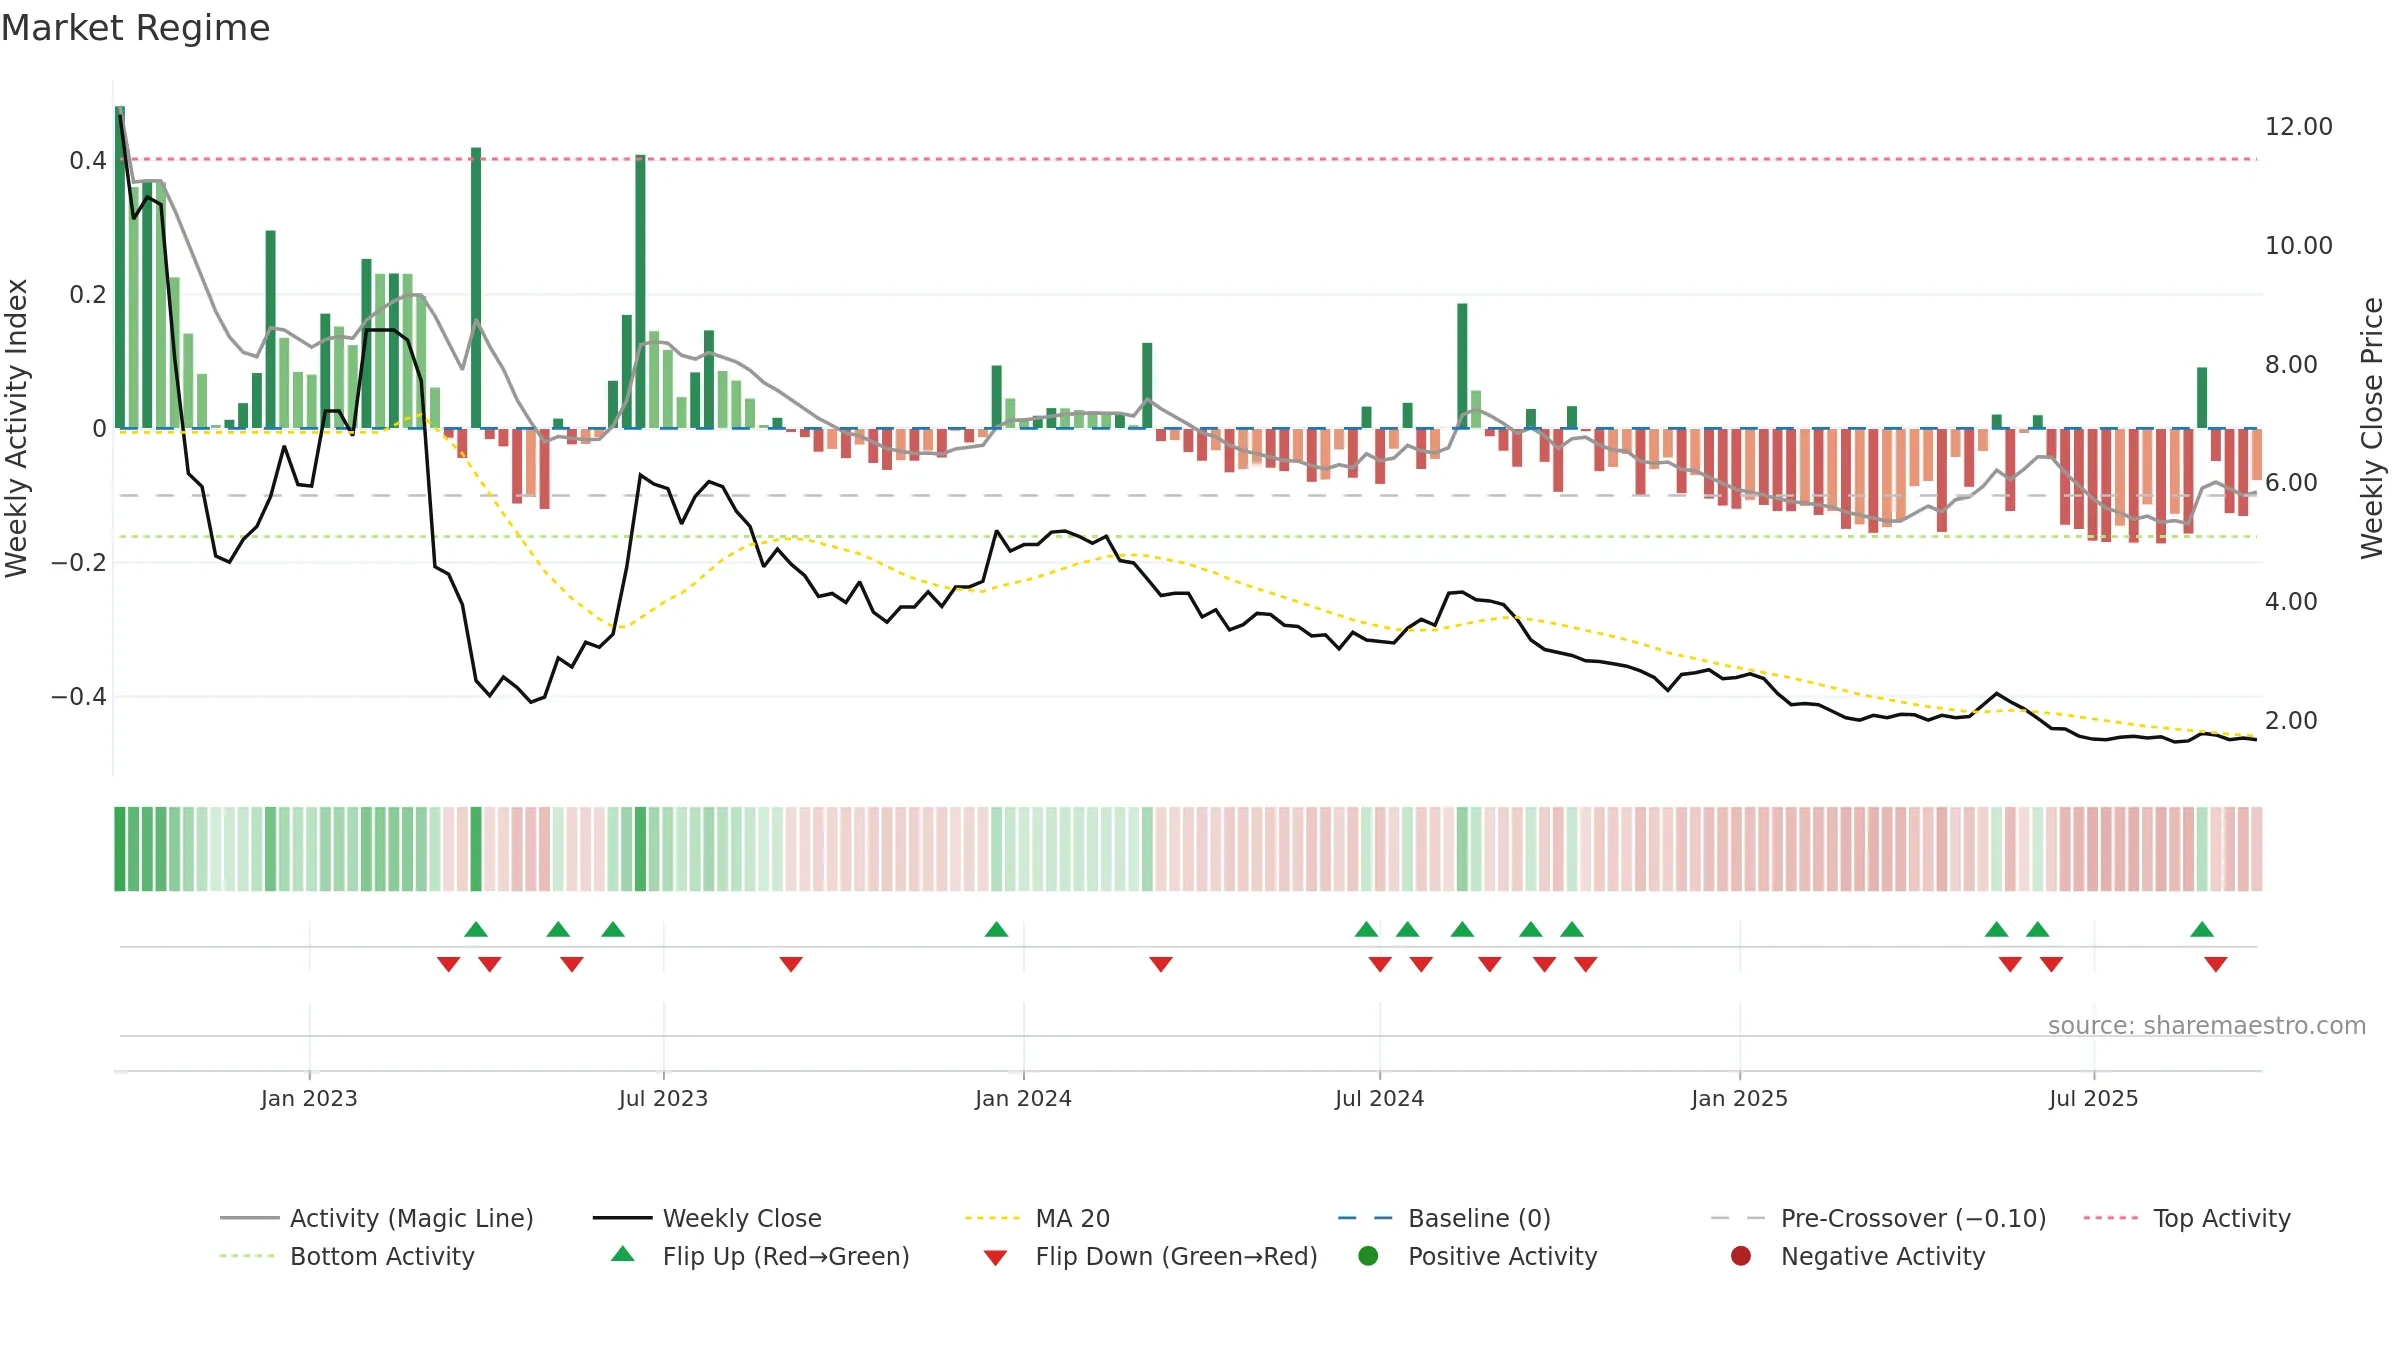
Gauge maps the trend signal to a 0–100 scale.
How to read this — Range-bound conditions; conviction is limited until a break or acceleration emerges.
Wait for a directional break or improving acceleration.

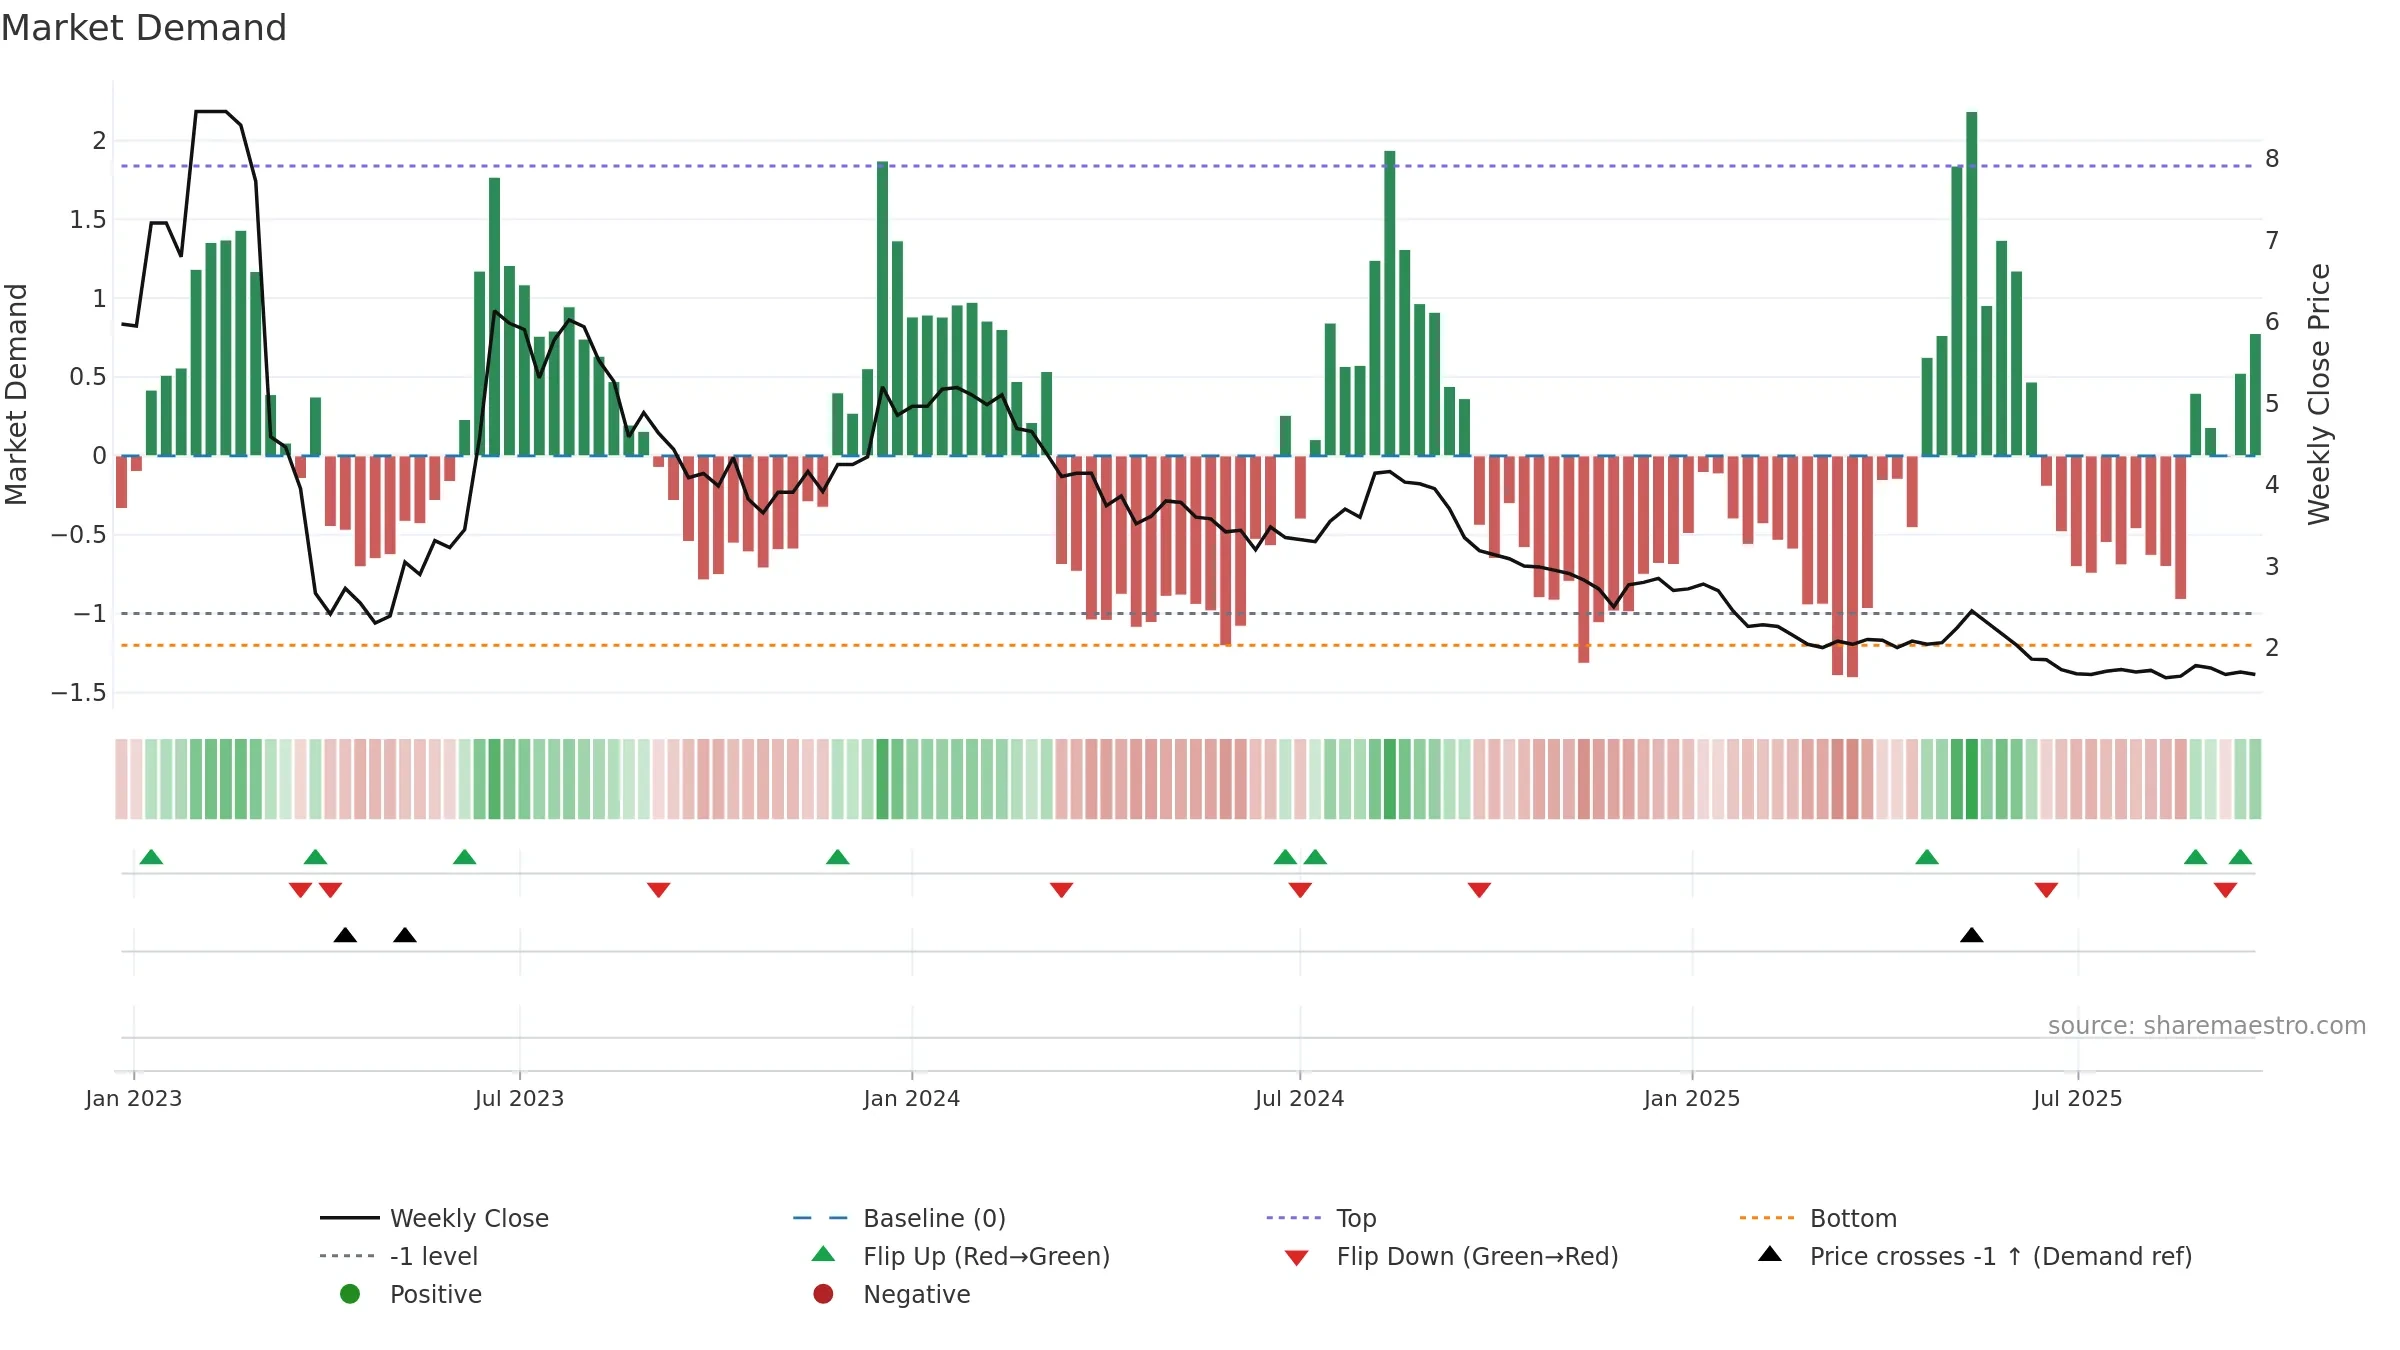
Relative strength is Negative
(< 0%, underperforming).
Latest MRS: -22.94% (week ending Fri, 19 Sep 2025).
Slope: Rising over 8w.
Notes:
- Below zero line indicates relative weakness vs benchmark.
- MRS slope rising over ~8 weeks.
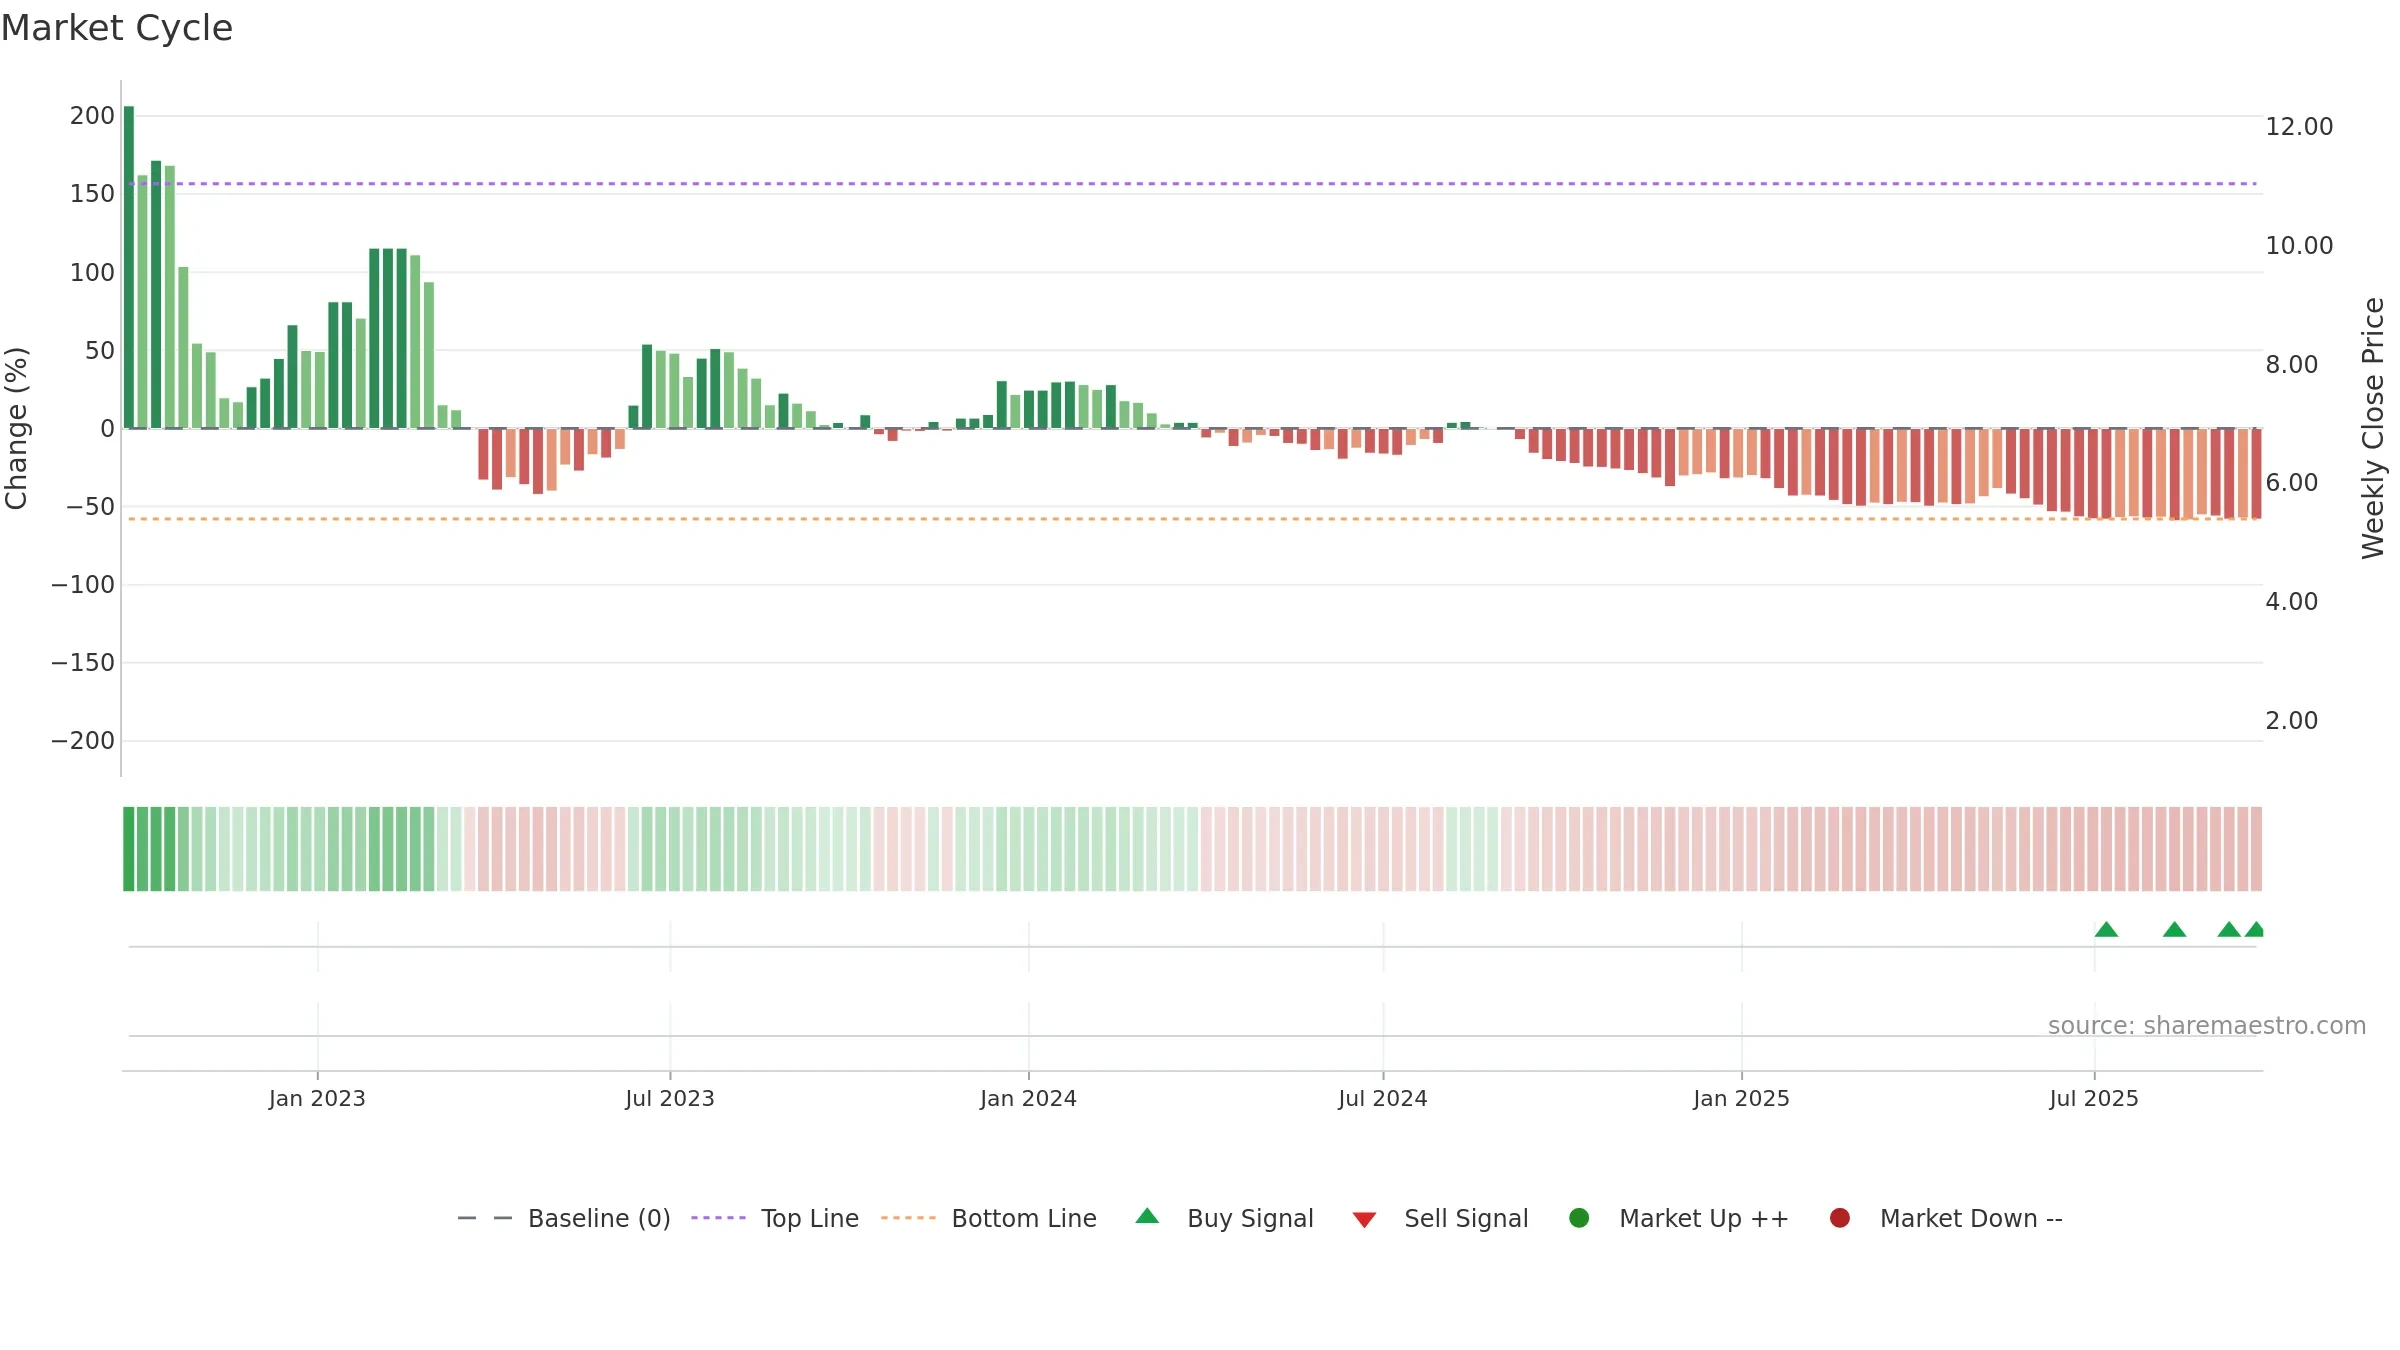
Conclusion
Negative setup. ★★☆☆☆ confidence. Trend: Range / Neutral · -2.91% over window · vol 4.46% · liquidity convergence · posture below
- Liquidity confirms the price trend
- Momentum is weak/falling
- Price is not above key averages
- High return volatility raises whipsaw risk
- Negative multi-week performance
Why: Price window -2.91% over w. Close is -6.18% below the prior-window high. Return volatility 4.46%. Volume trend rising. Liquidity convergence with price. Trend state range / neutral. Momentum bearish and falling.
Tip: Most metrics include a hover tooltip where they appear in the report.