Blaize Holdings, Inc.
BZAI NASDAQ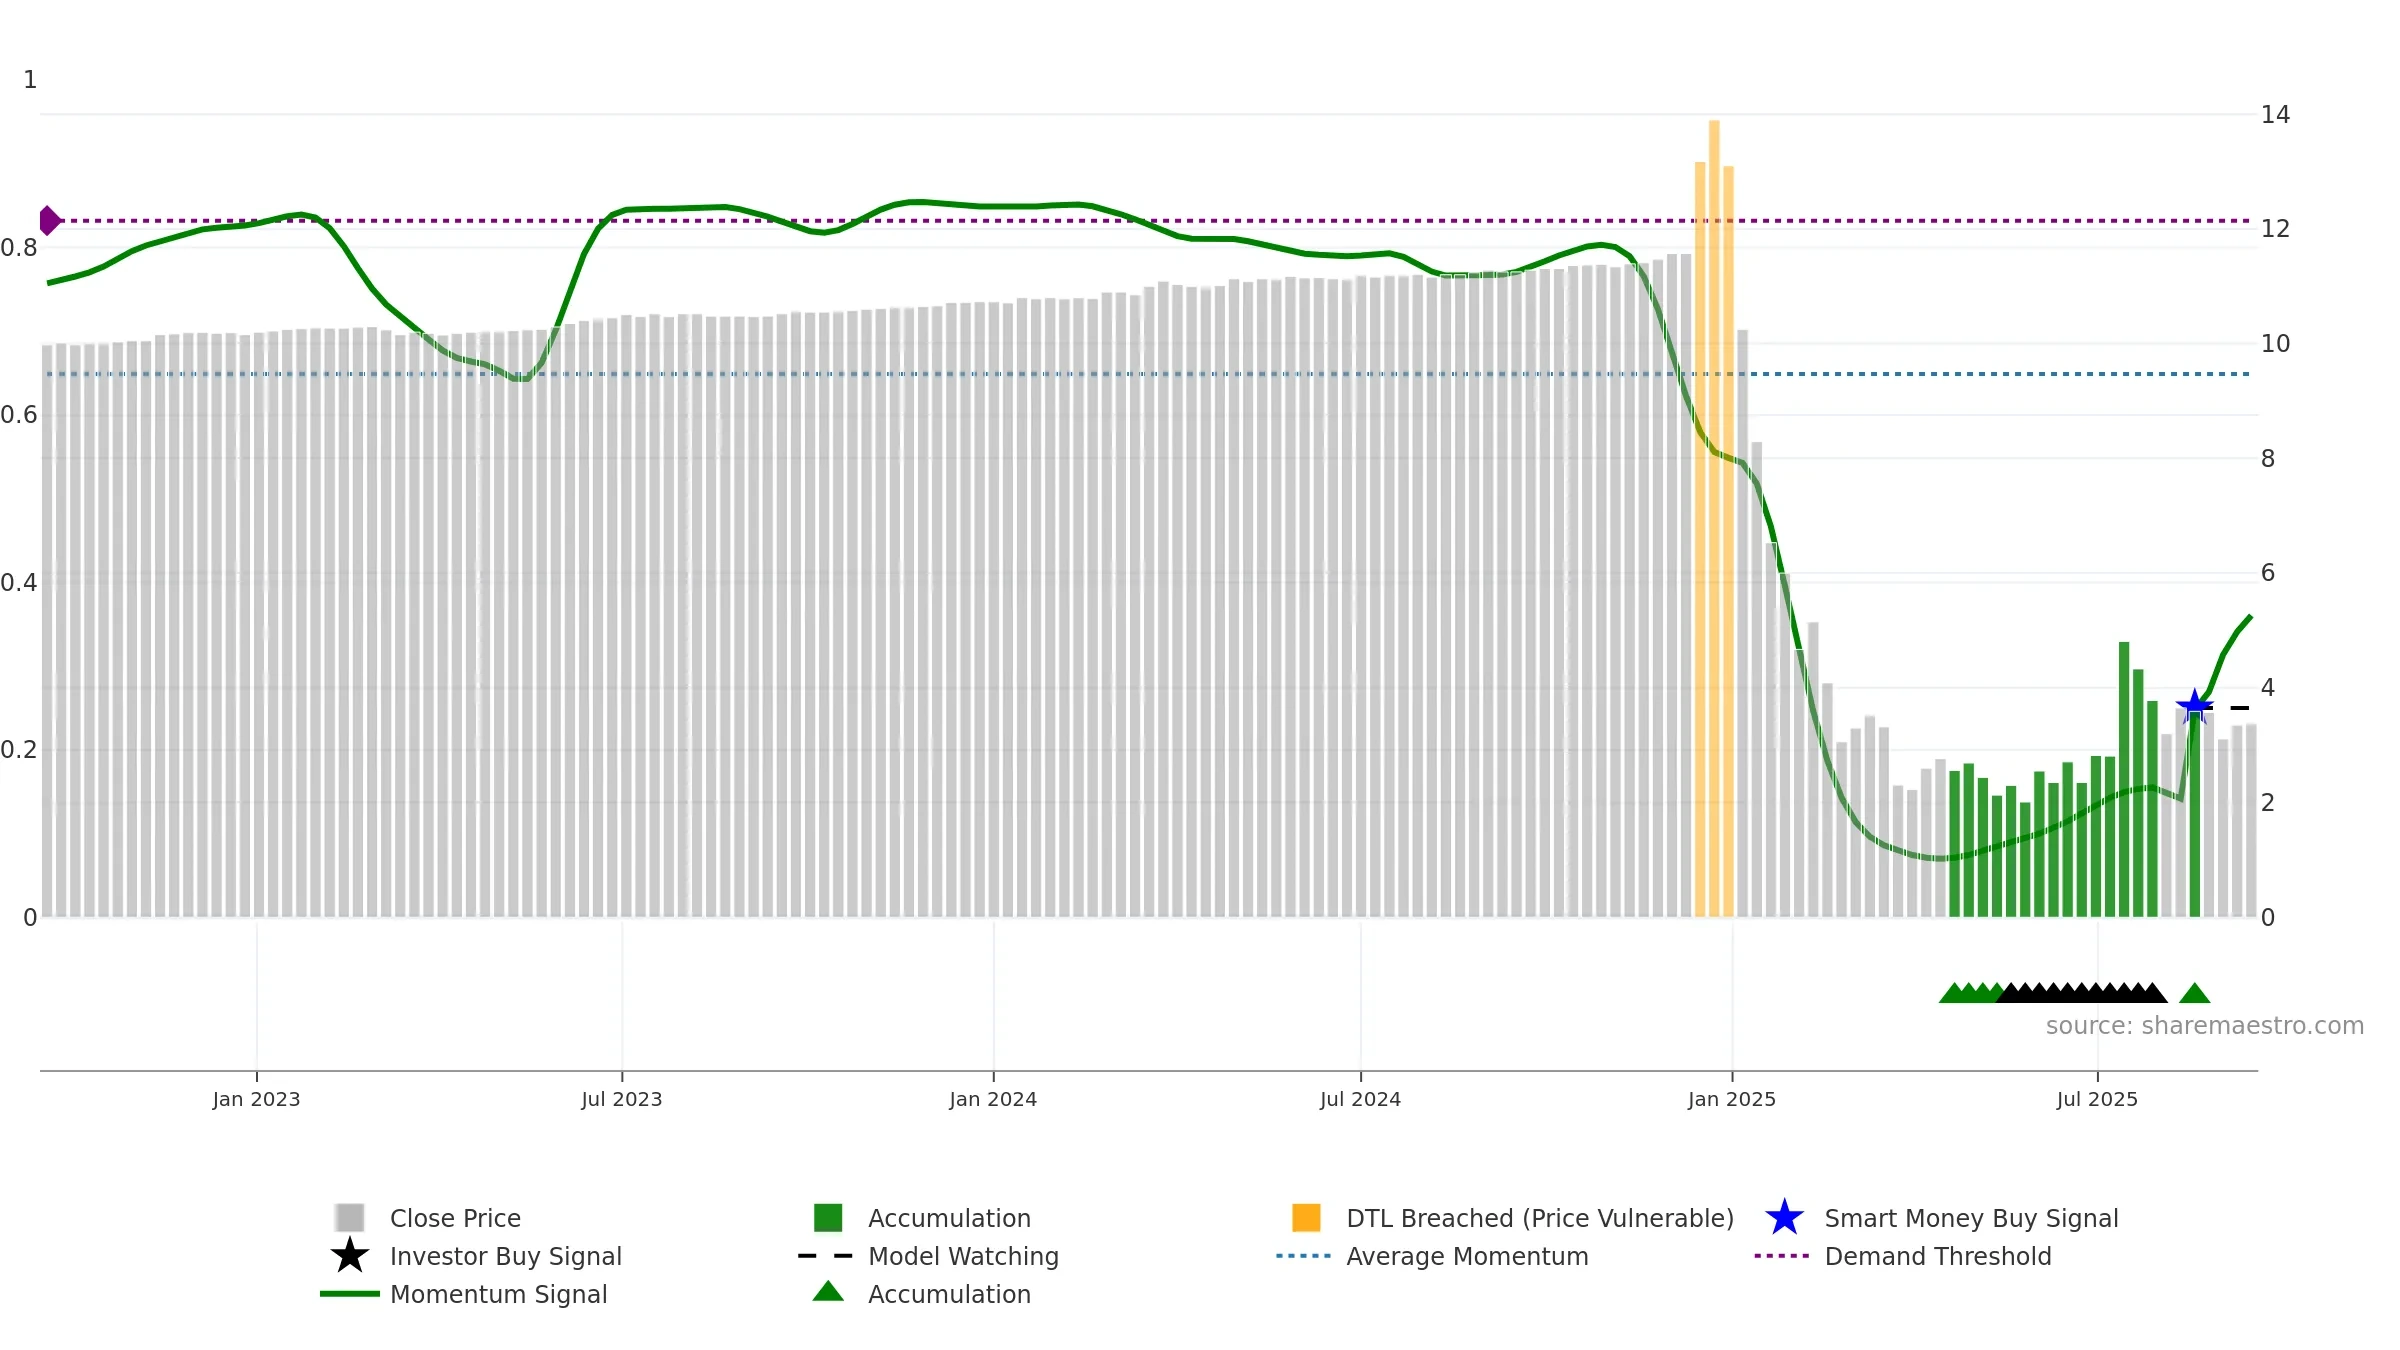
Weekly Report
Blaize Holdings, Inc. closed at 3.3800 (0.00% WoW) . Data window ends Mon, 15 Sep 2025.
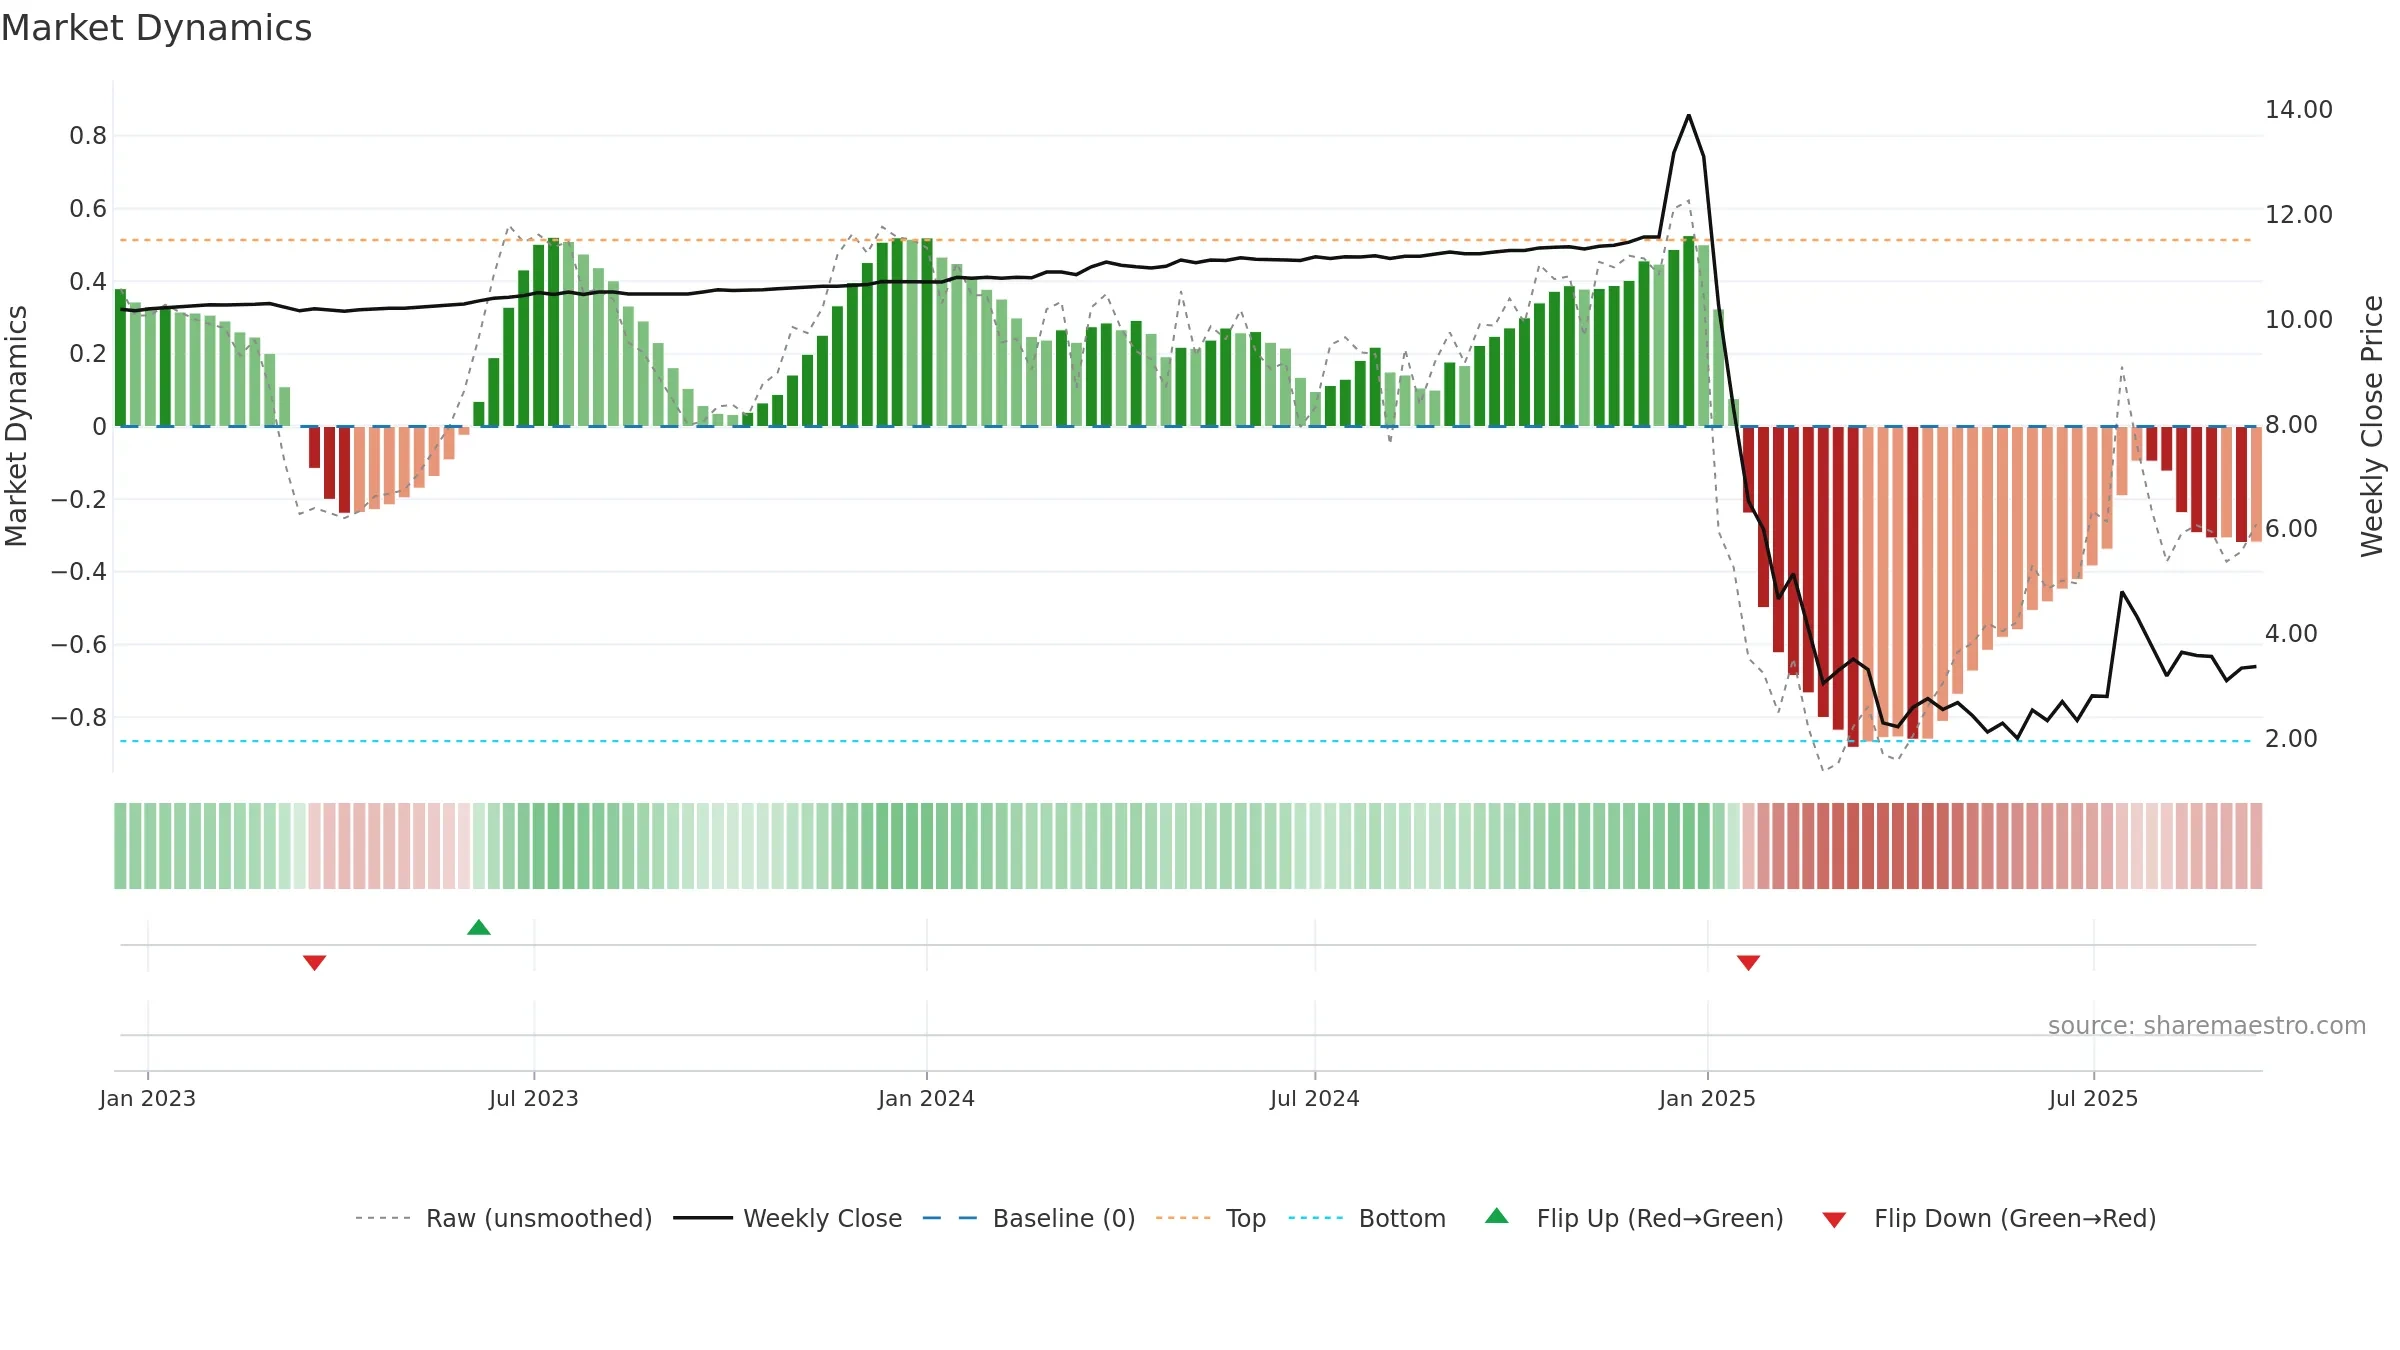
How to read this — Price slope is downward, indicating persistent supply pressure. Elevated weekly volatility increases whipsaw risk. Volume trend diverges from price — watch for fatigue or rotation. Distance to baseline is narrowing — reverting closer to its fair-value track.
Down-slope argues for patience; rallies can fade sooner unless participation improves. Because liquidity isn’t confirming, prefer evidence of fresh demand before chasing moves.
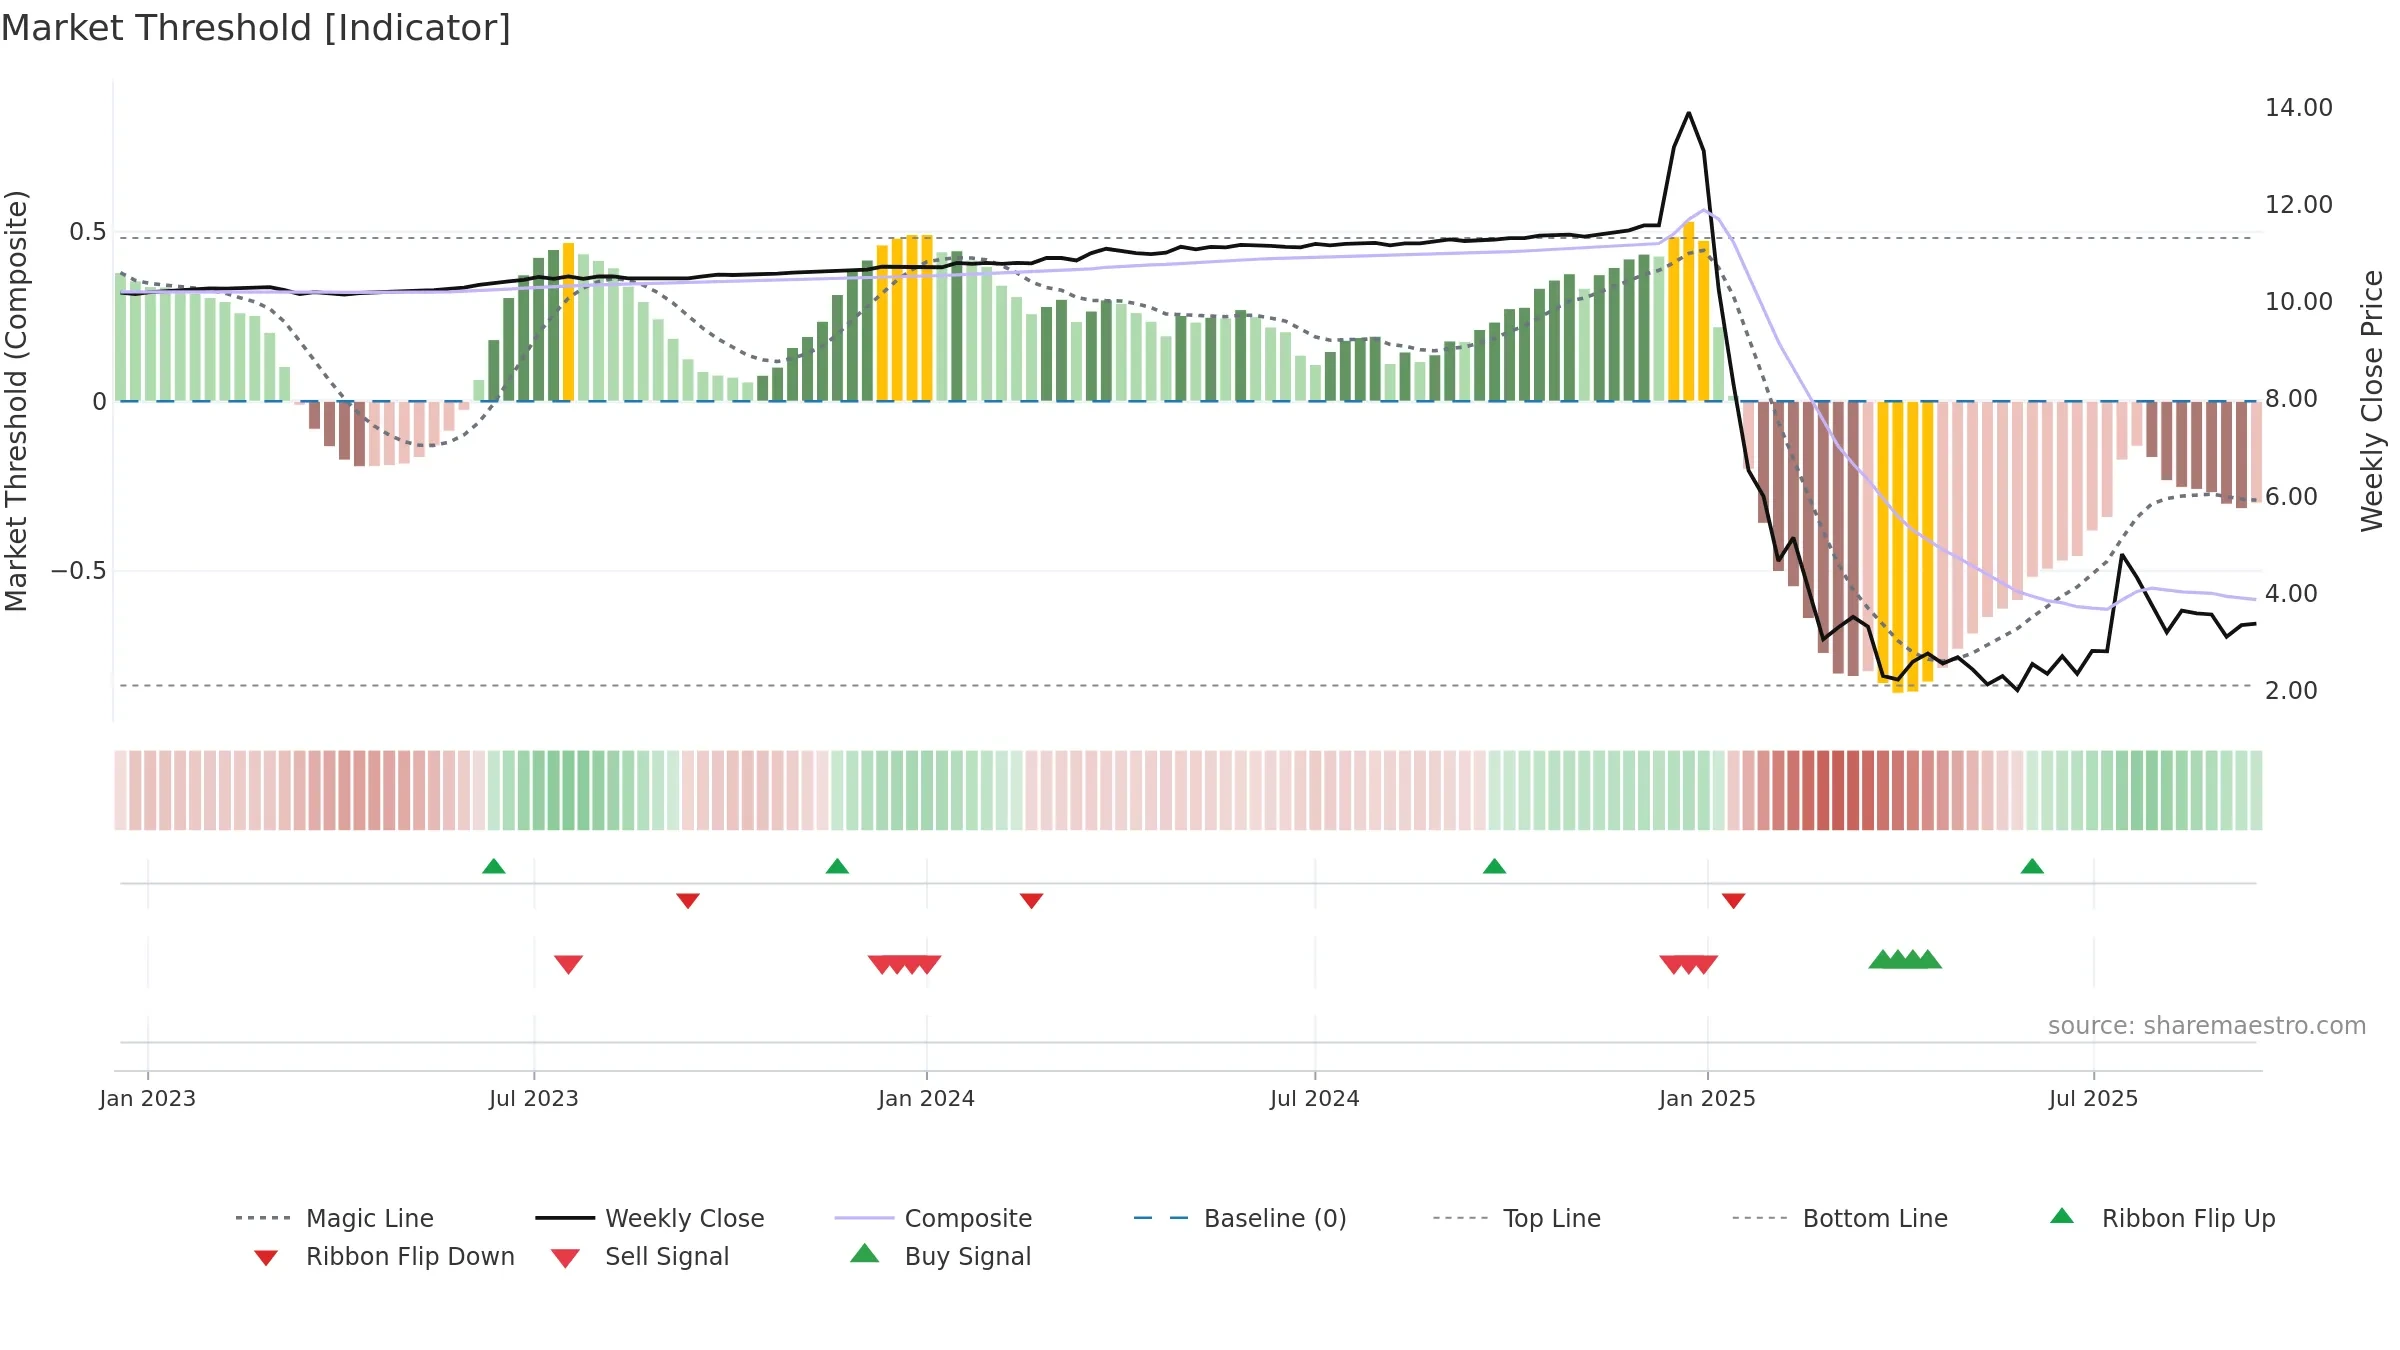
Gauge maps the trend signal to a 0–100 scale.
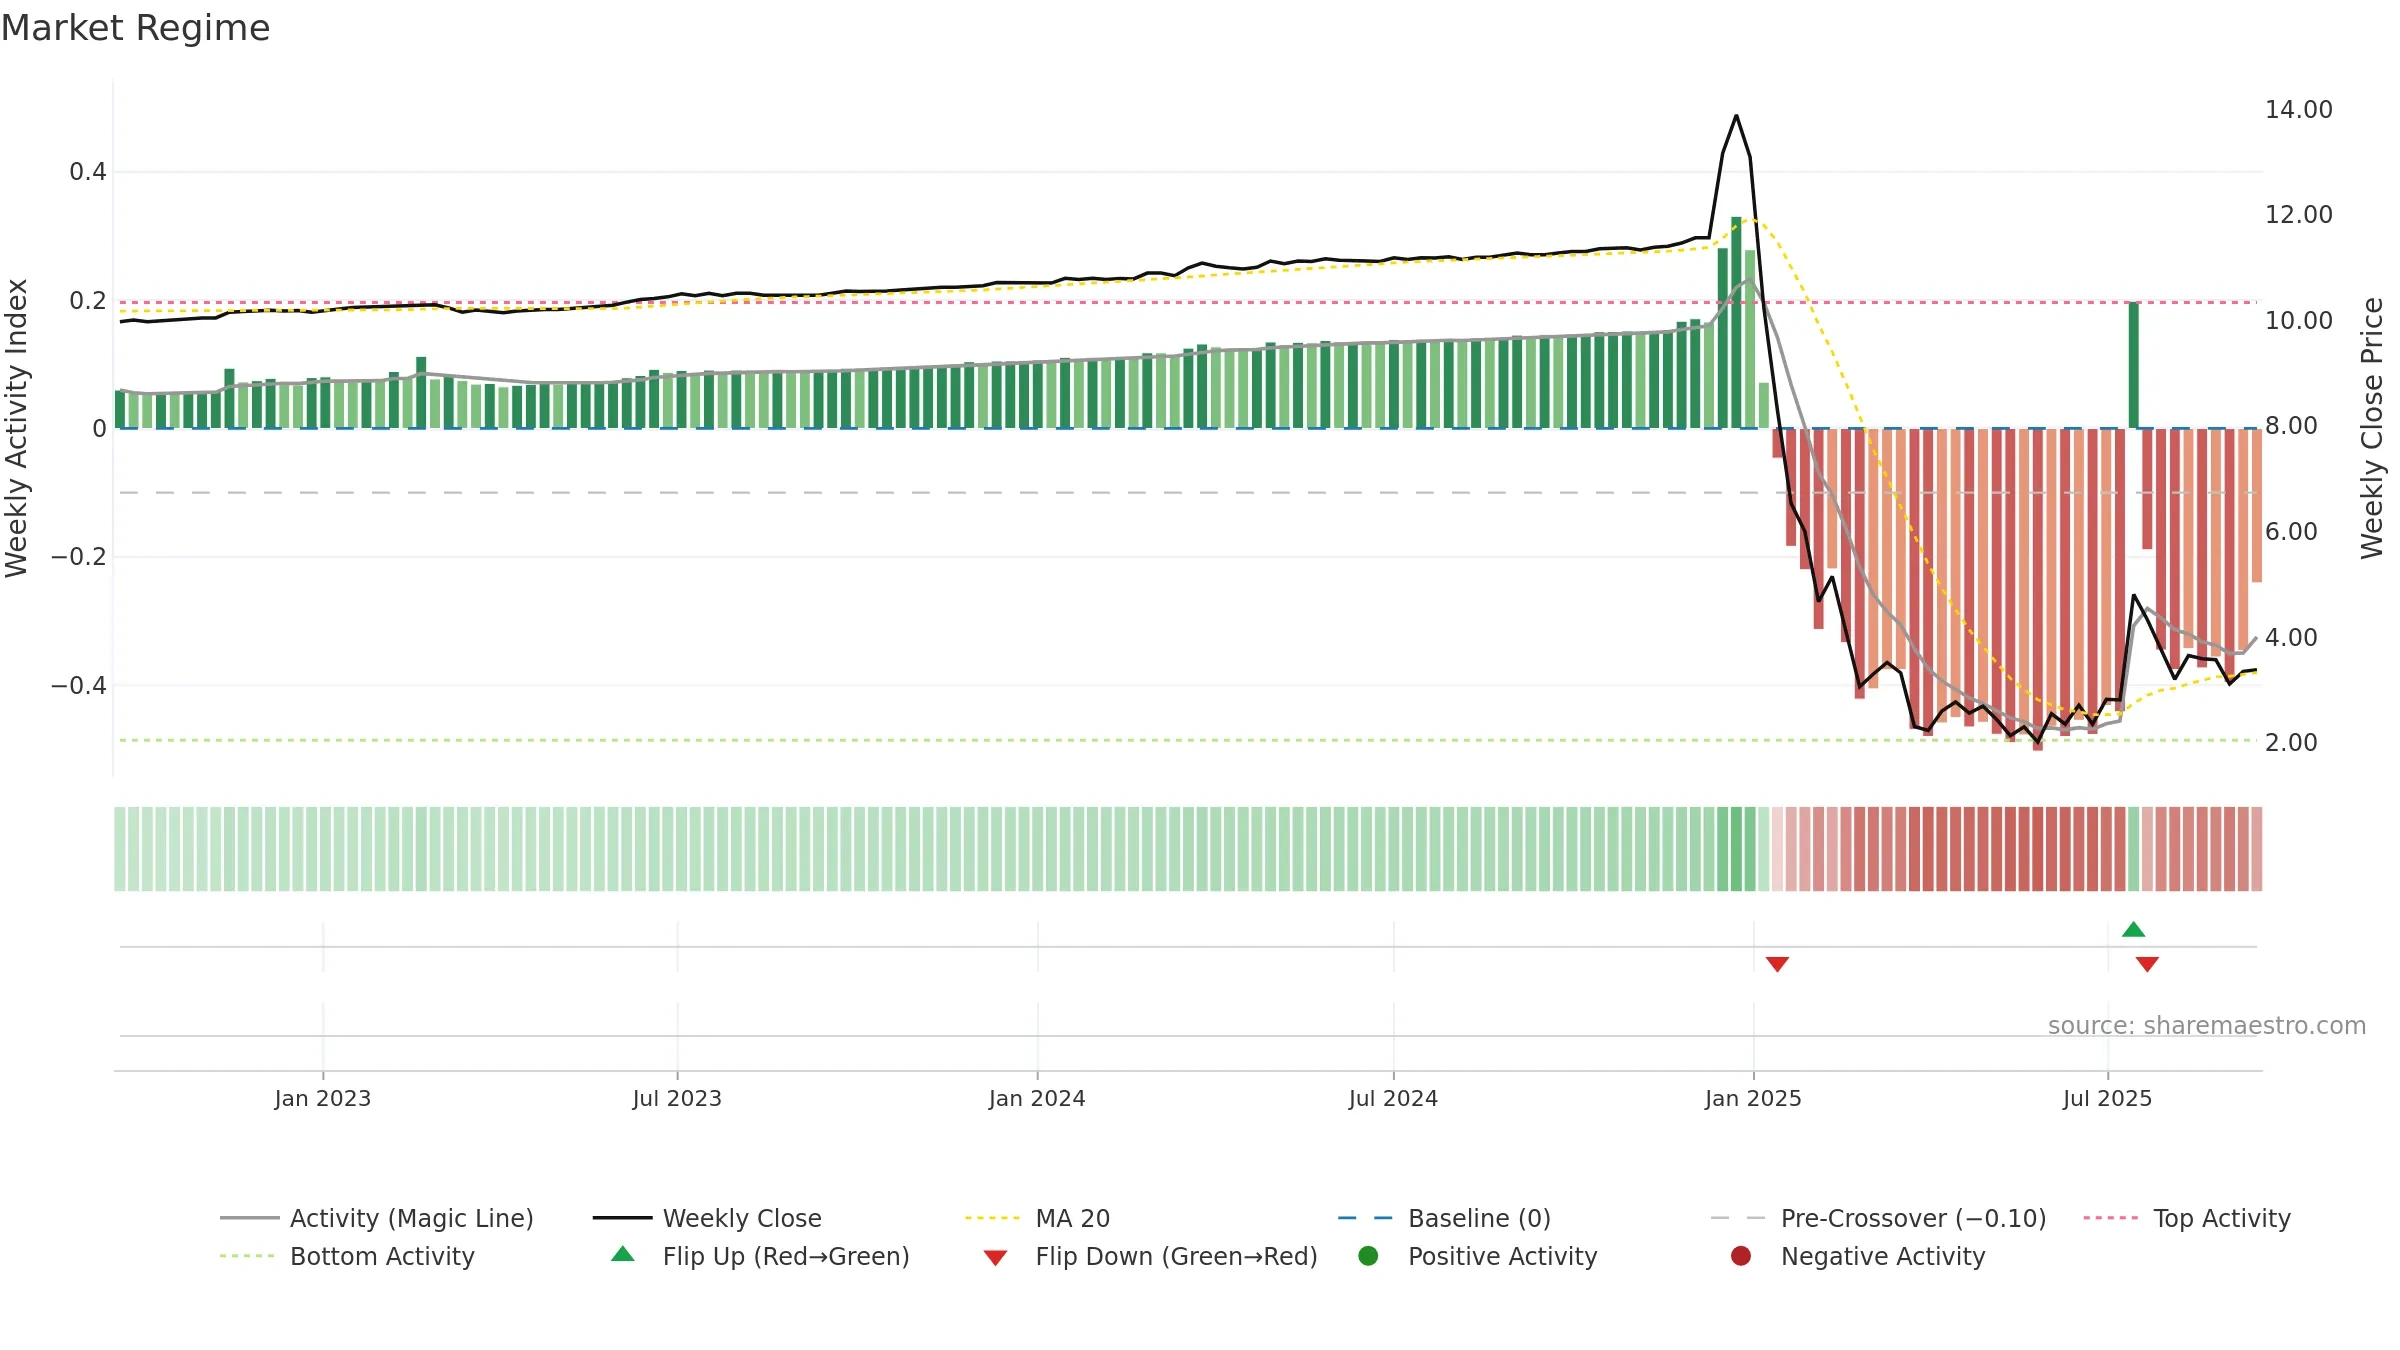
How to read this — Bearish backdrop but short-term momentum is improving; confirmation still needed.
Early improvement — look for a reclaim of 0.50→0.60 to validate.
Conclusion
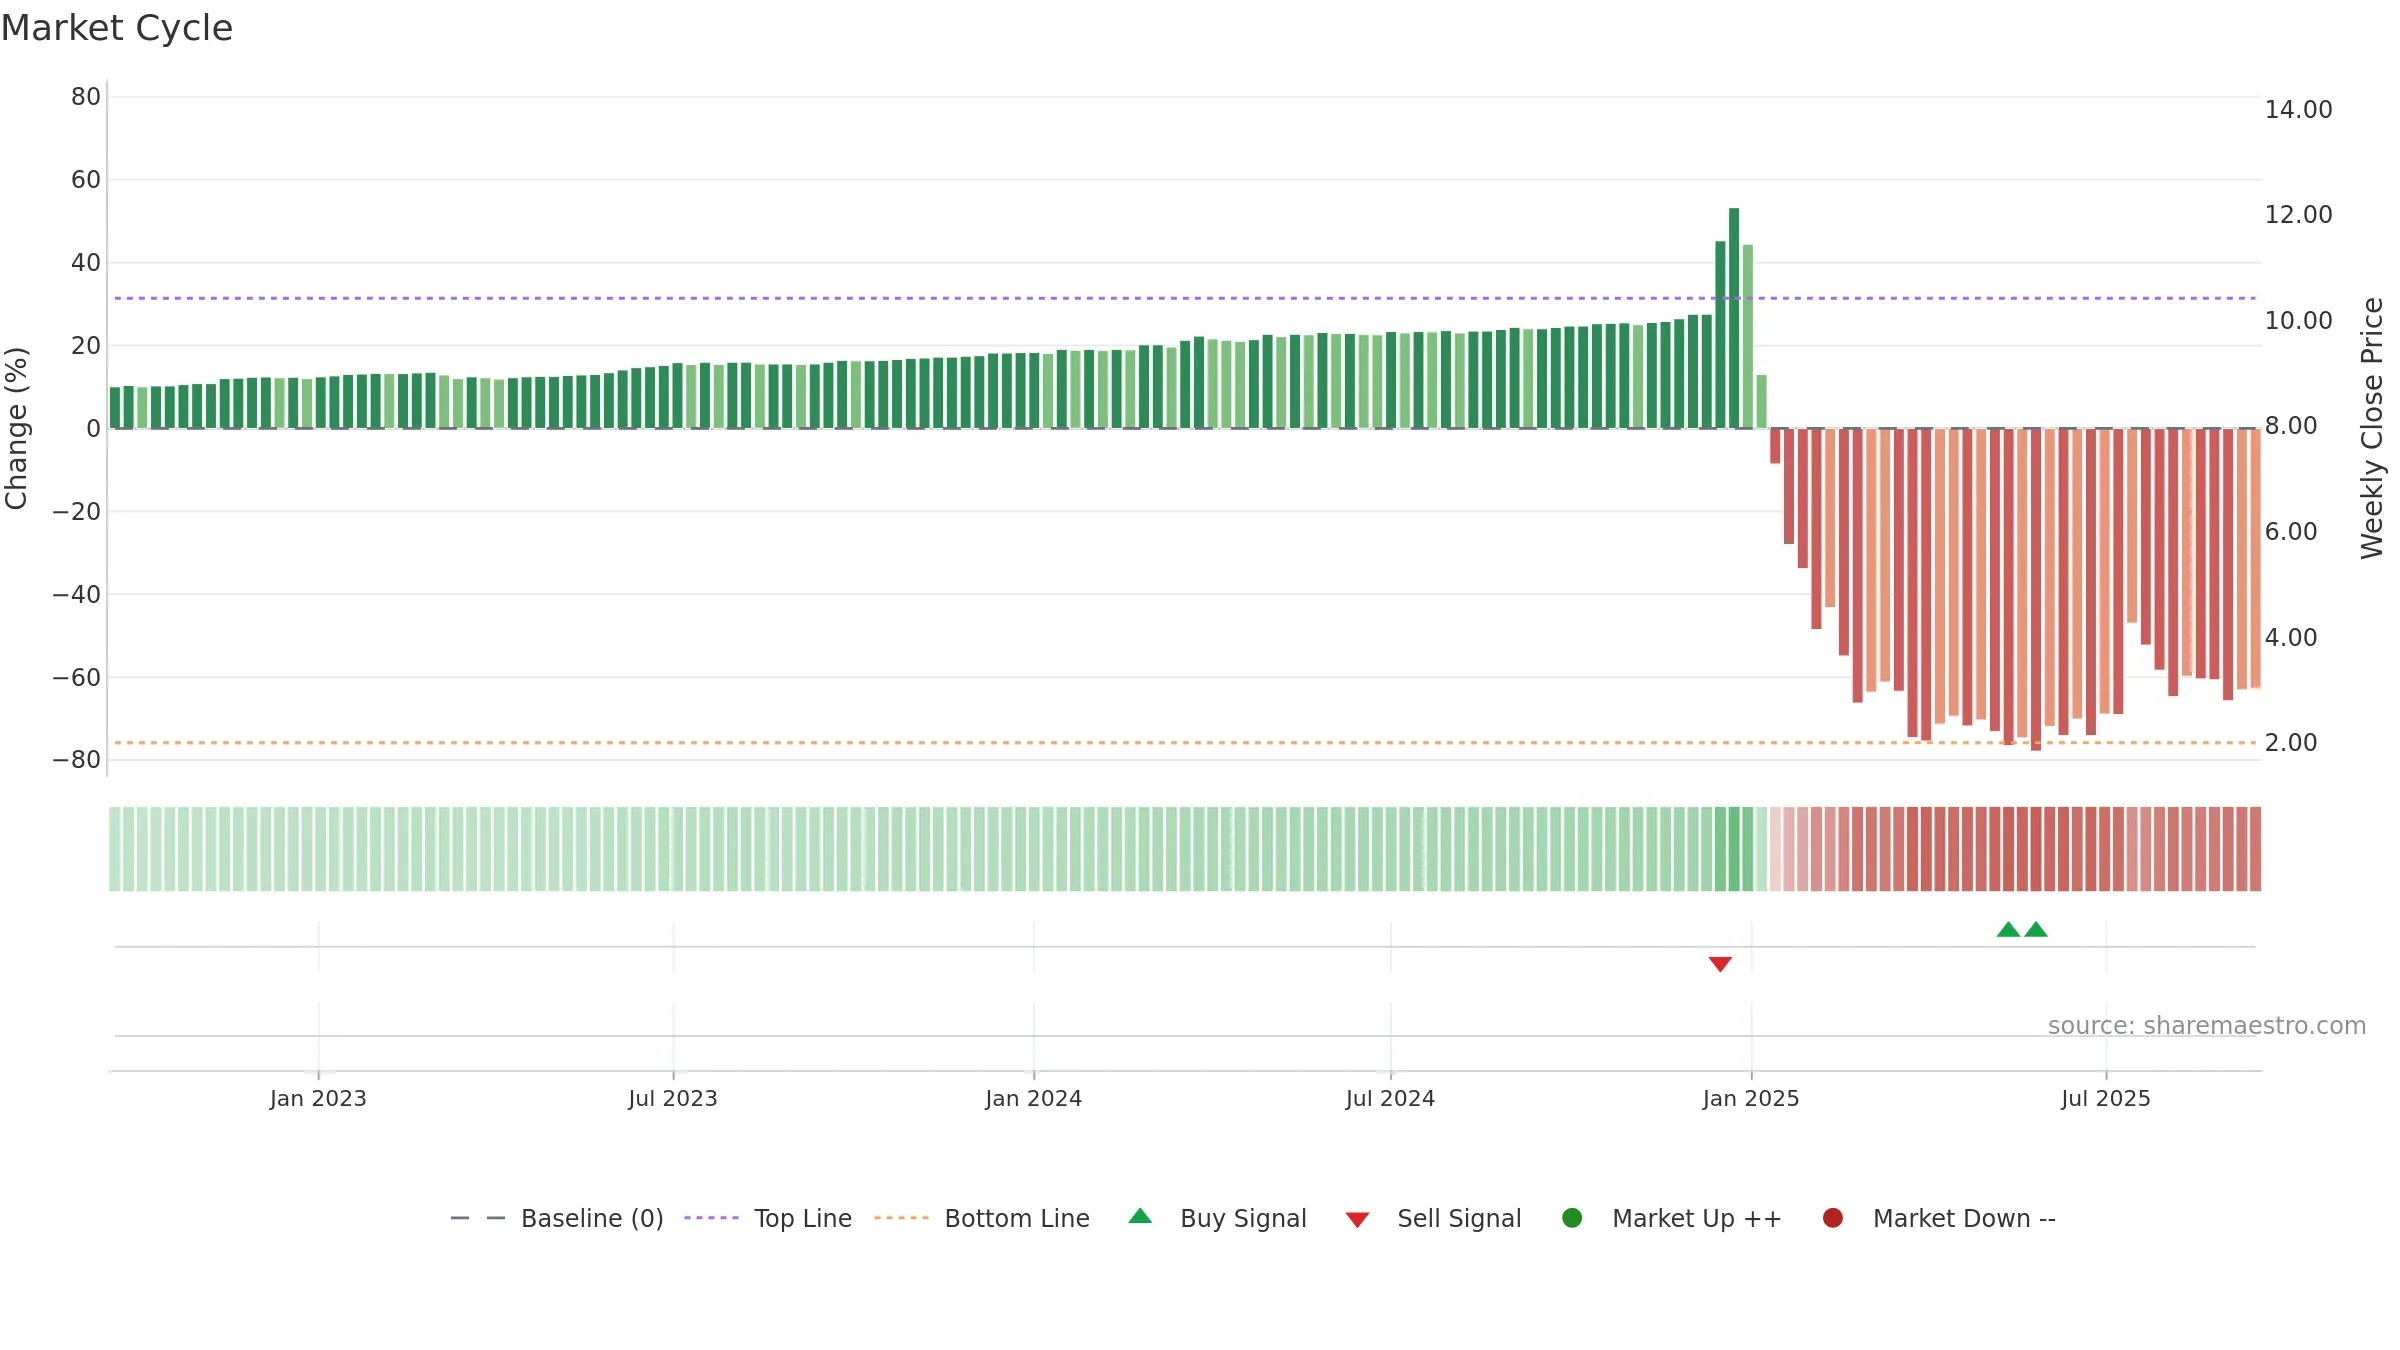
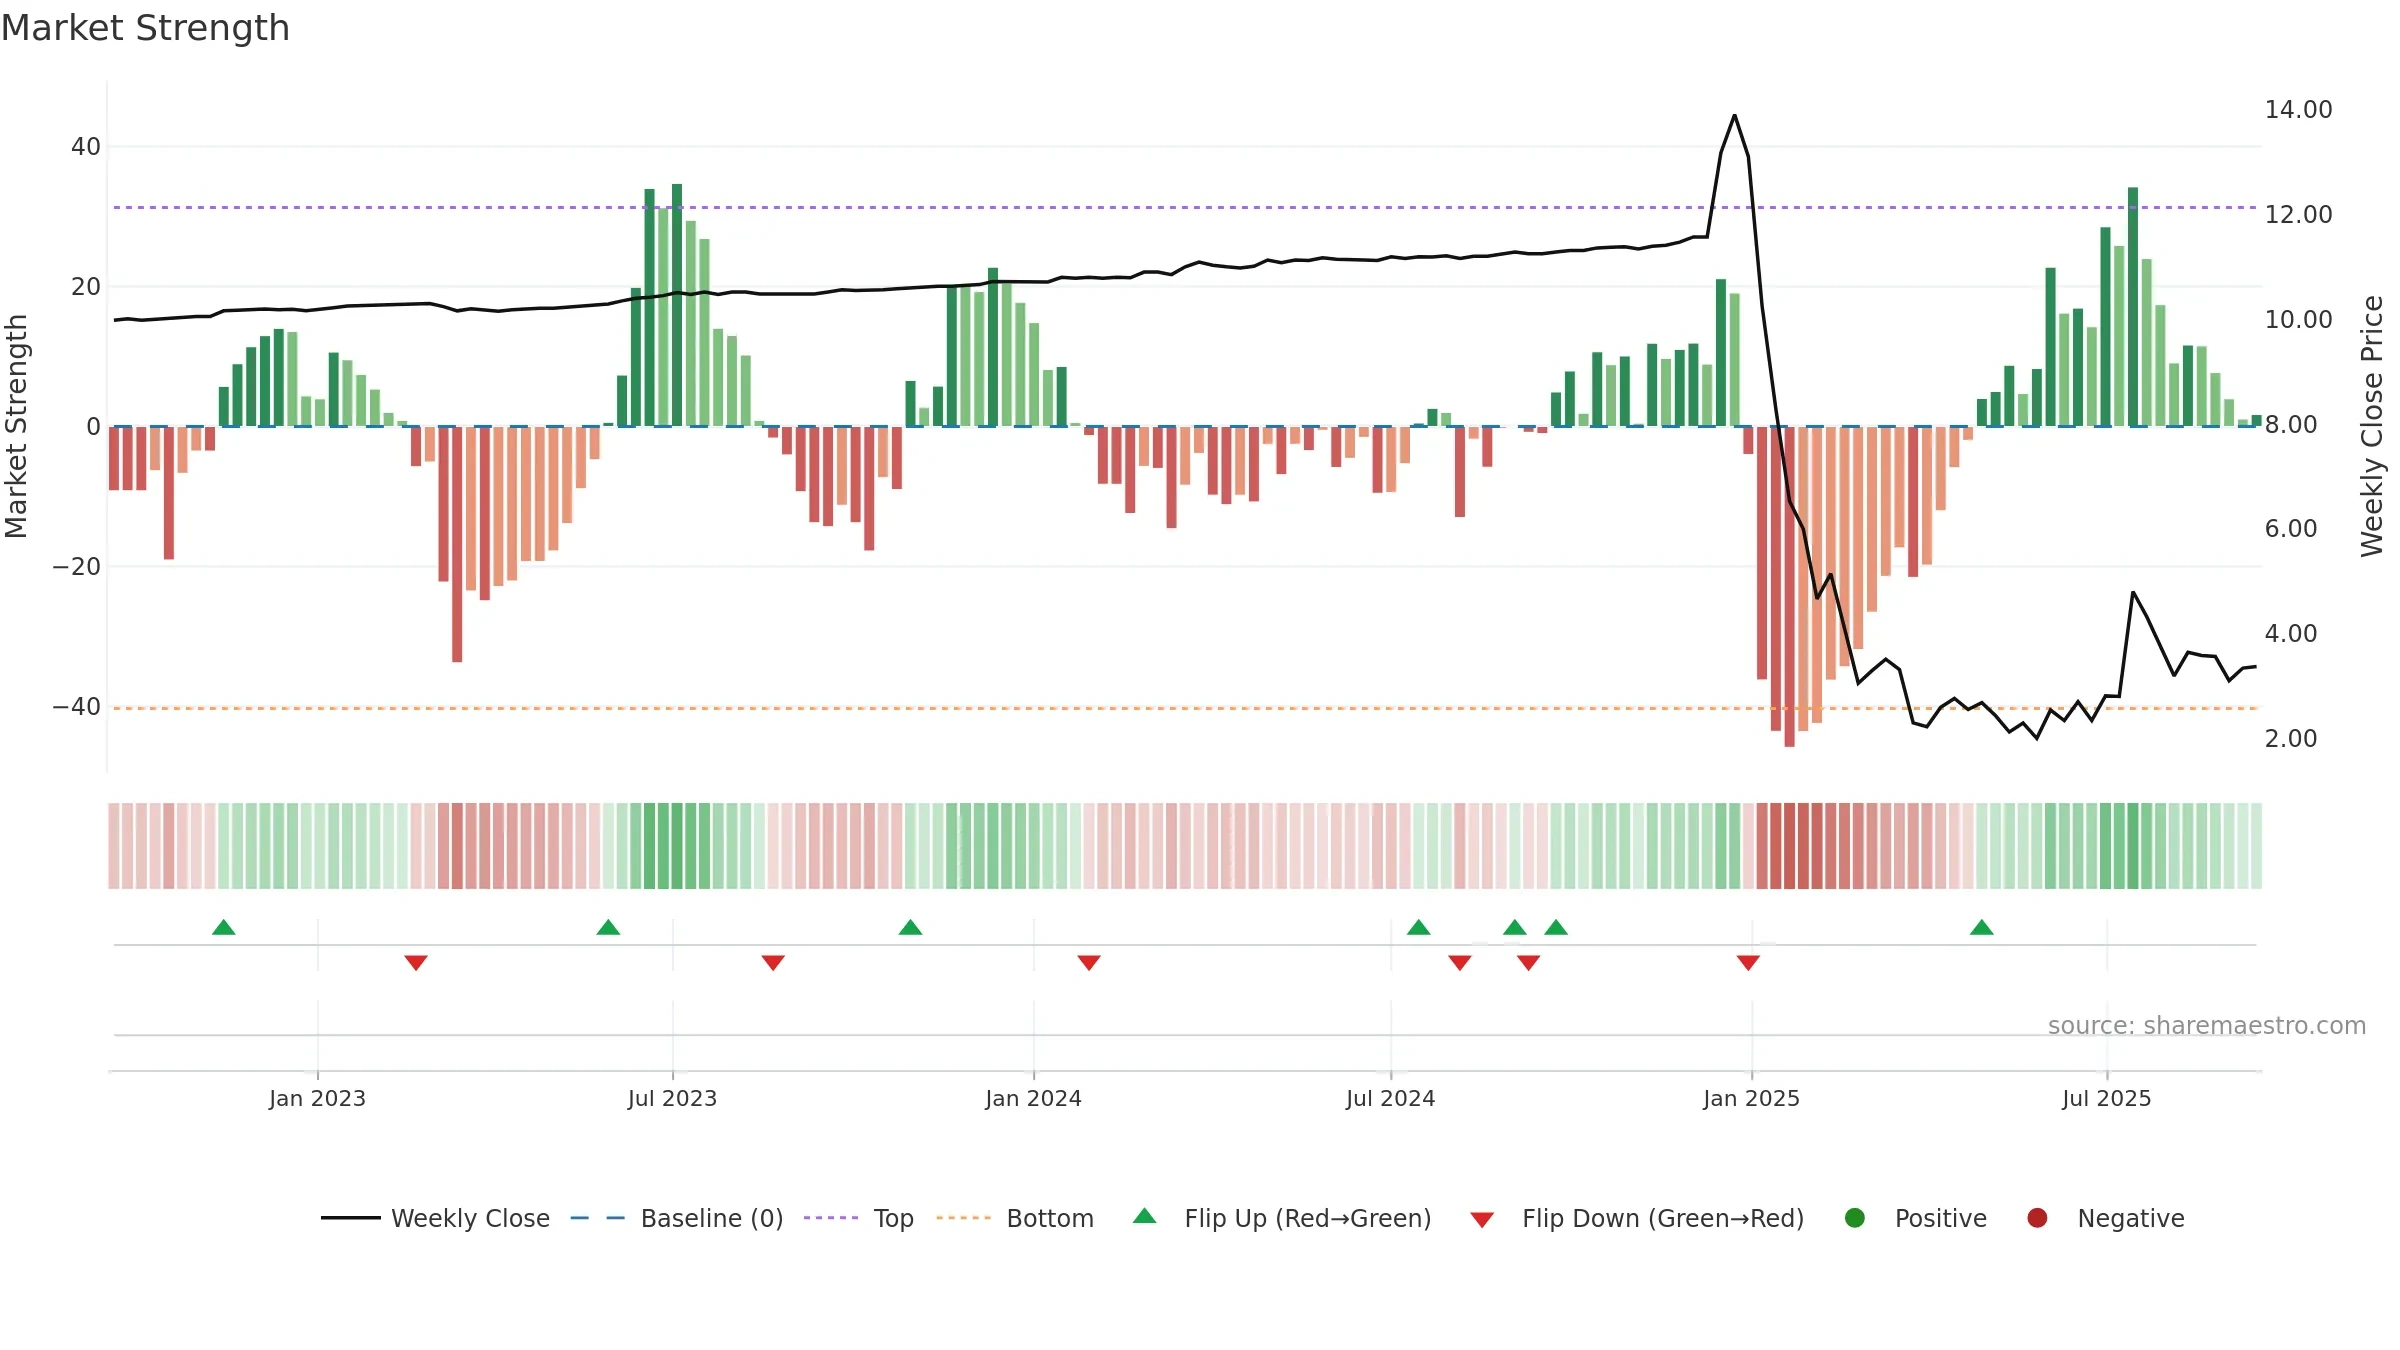
Negative setup. ★★☆☆☆ confidence. Price window: -10. Trend: Bottoming Attempt; gauge 36. In combination, liquidity diverges from price.
- Early improvement from bearish zone (bottoming attempt)
- Price is not above key averages
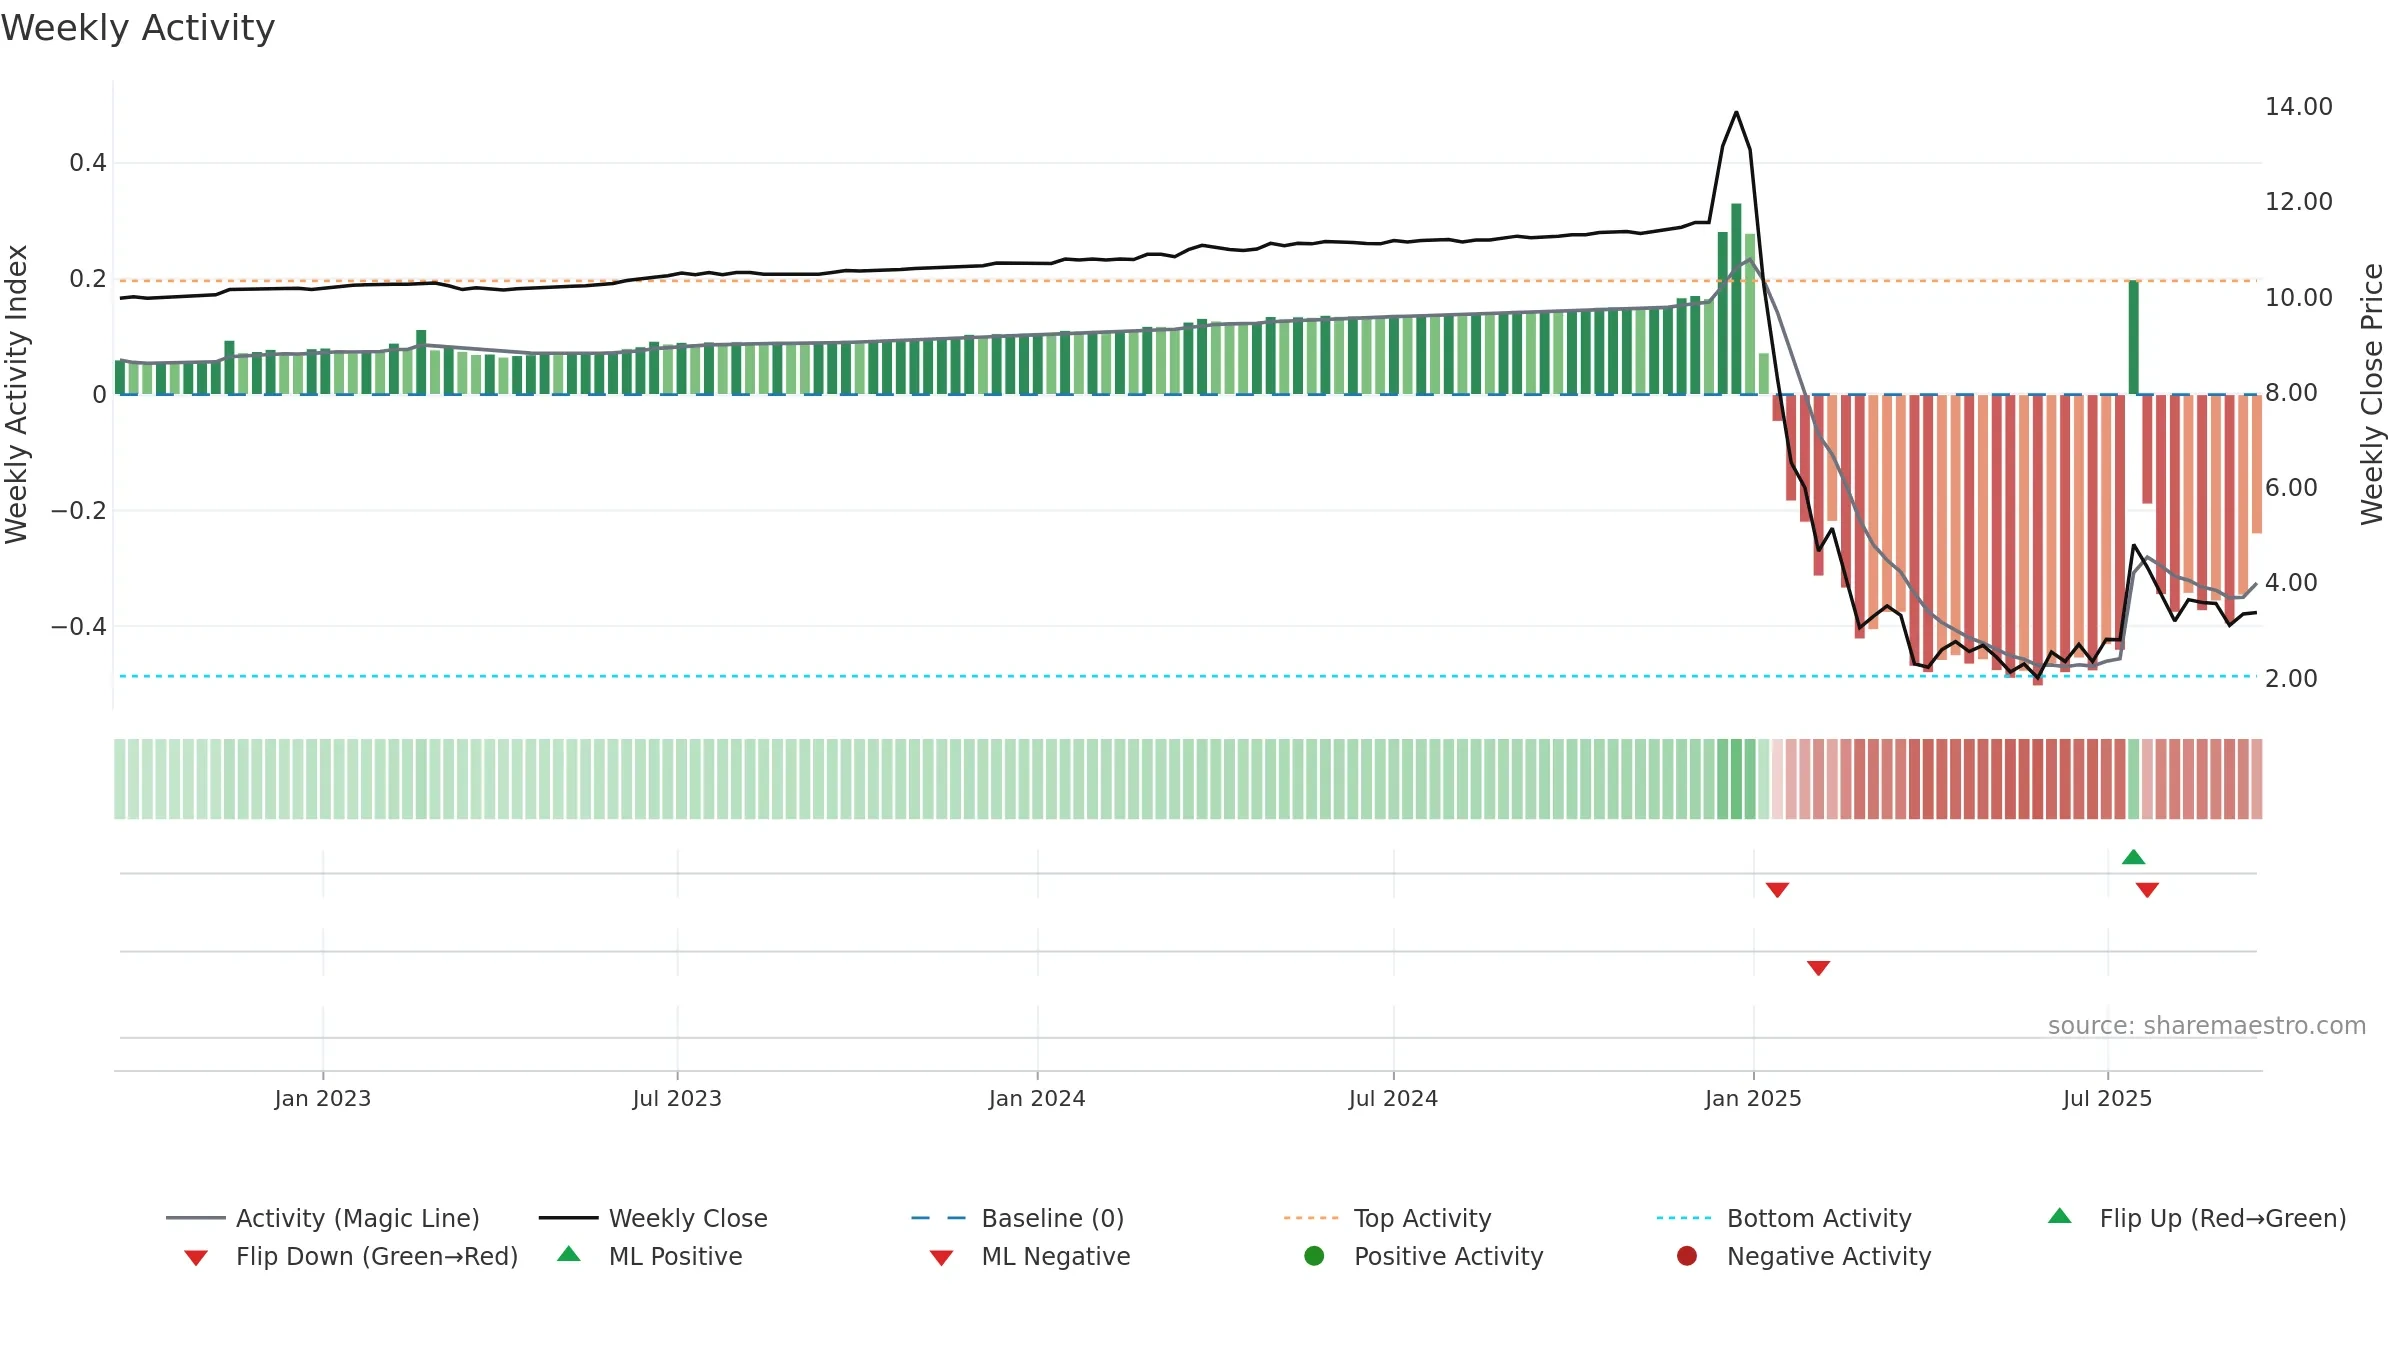
- Liquidity diverges from price
- High return volatility raises whipsaw risk
- Negative multi-week performance
Why: Price window -10.58% over 8w. Close is -10.58% below the prior-window high. Return volatility 9.96%. Volume trend rising. Liquidity divergence with price. Trend state bottoming attempt. Low-regime (≤0.25) upticks 2/4 (50.0%) • Distributing. Momentum neutral and rising.
Tip: Most metrics include a hover tooltip where they appear in the report.