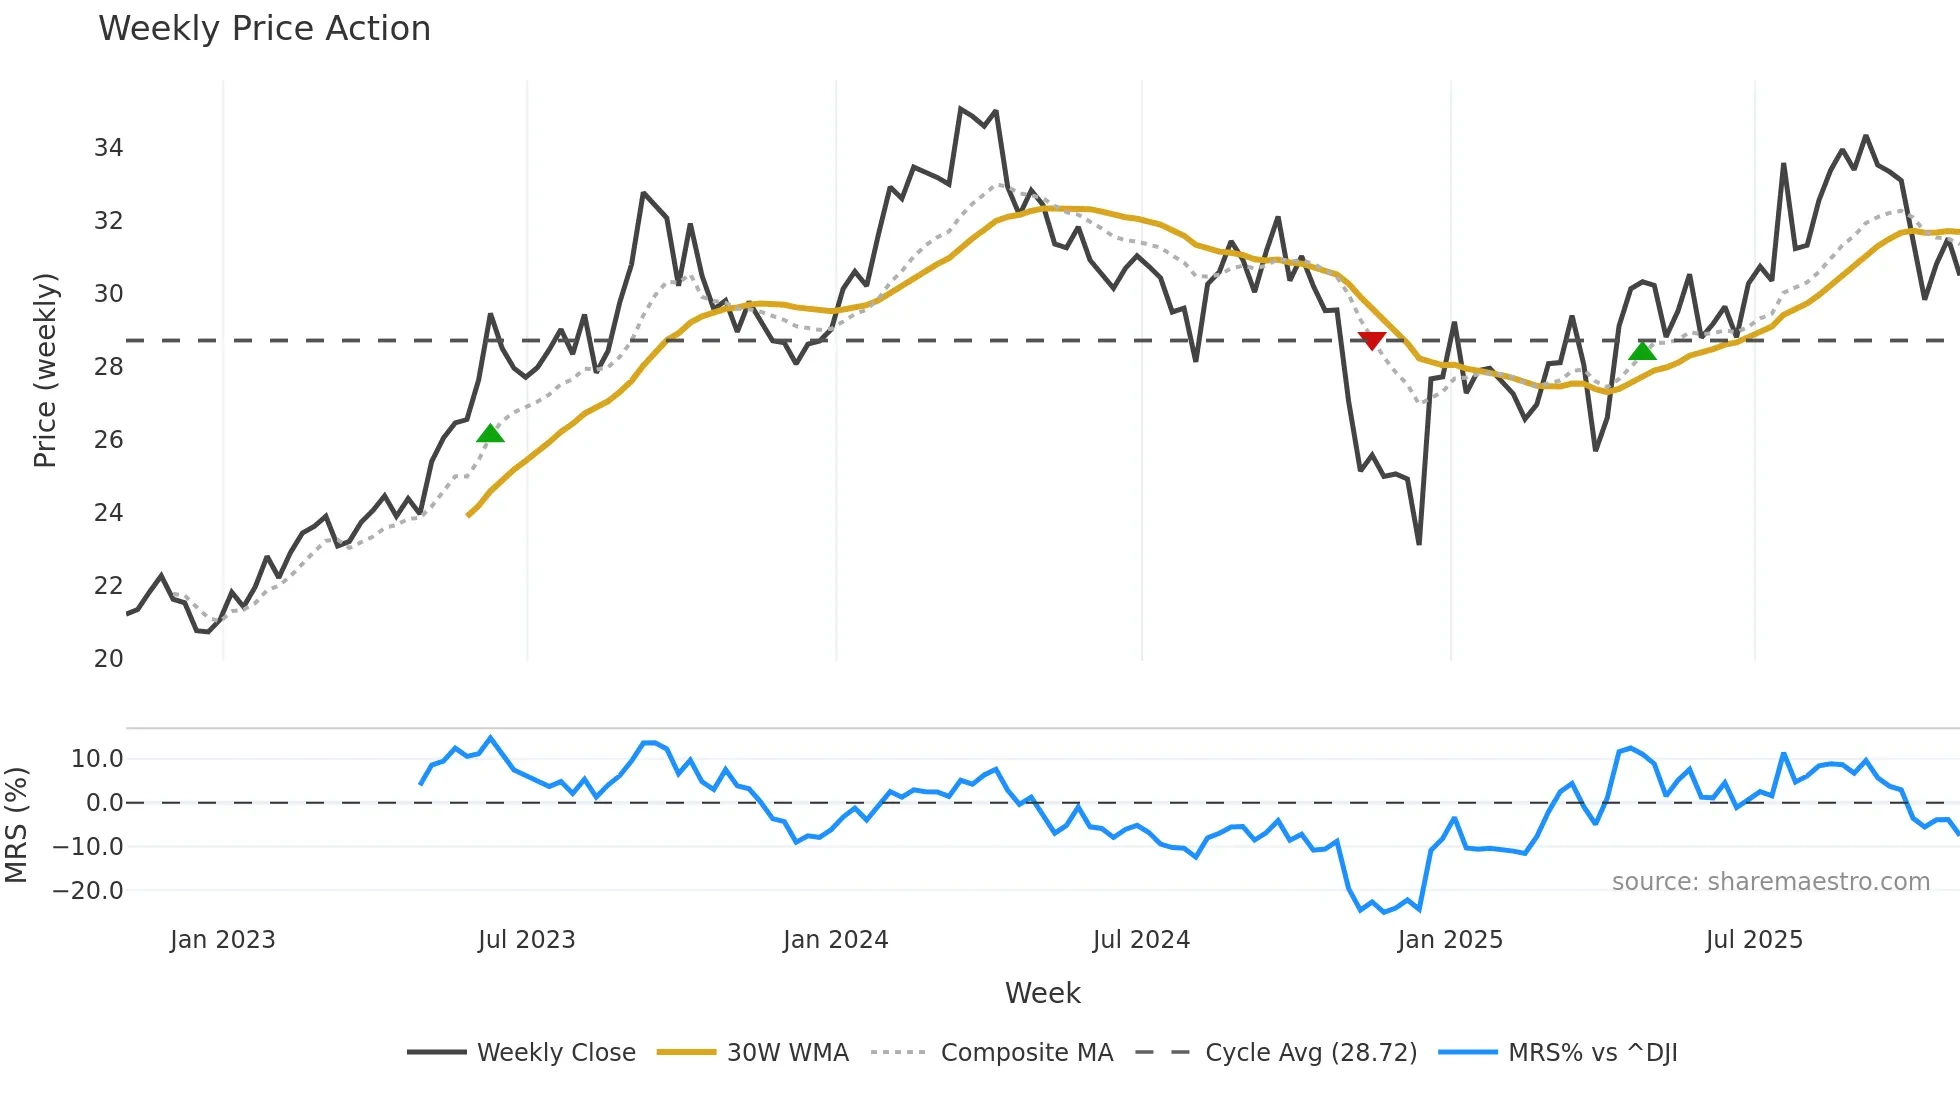
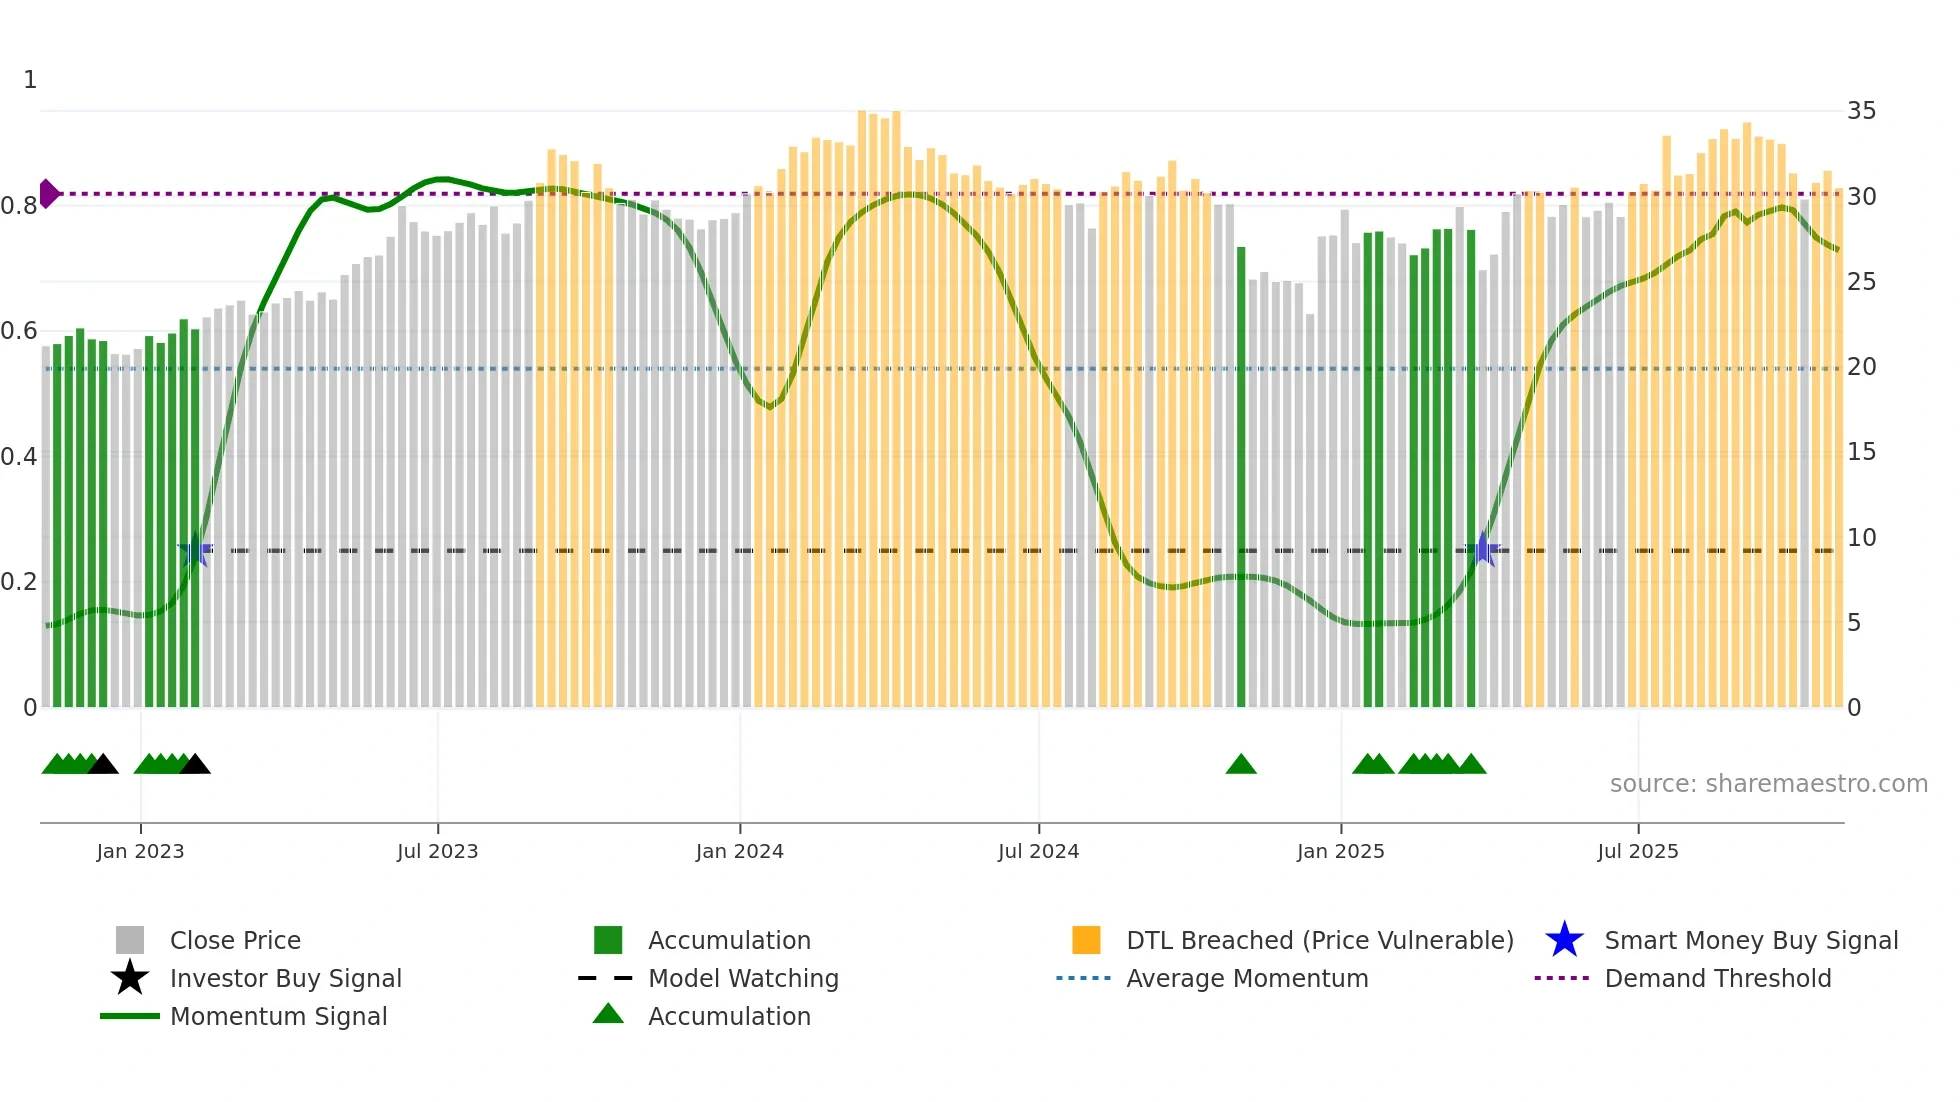
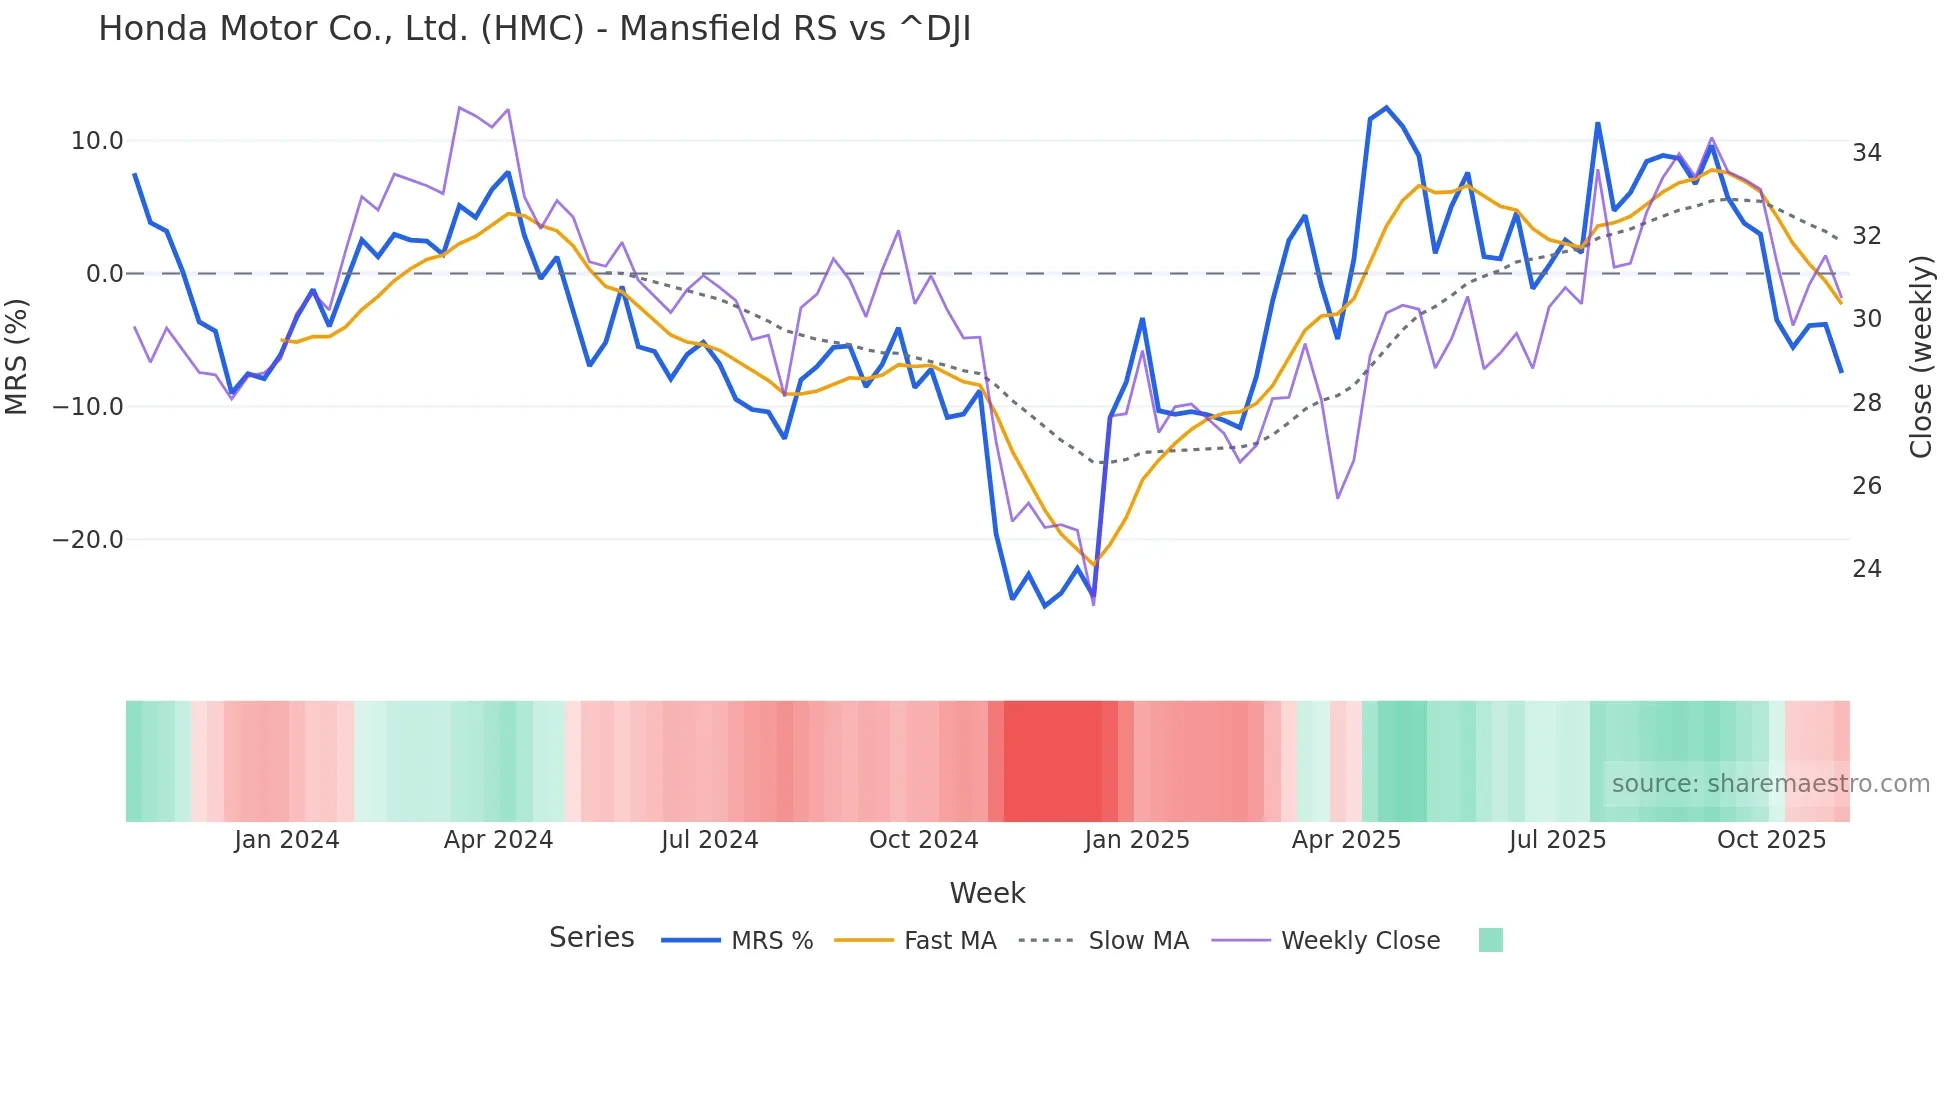
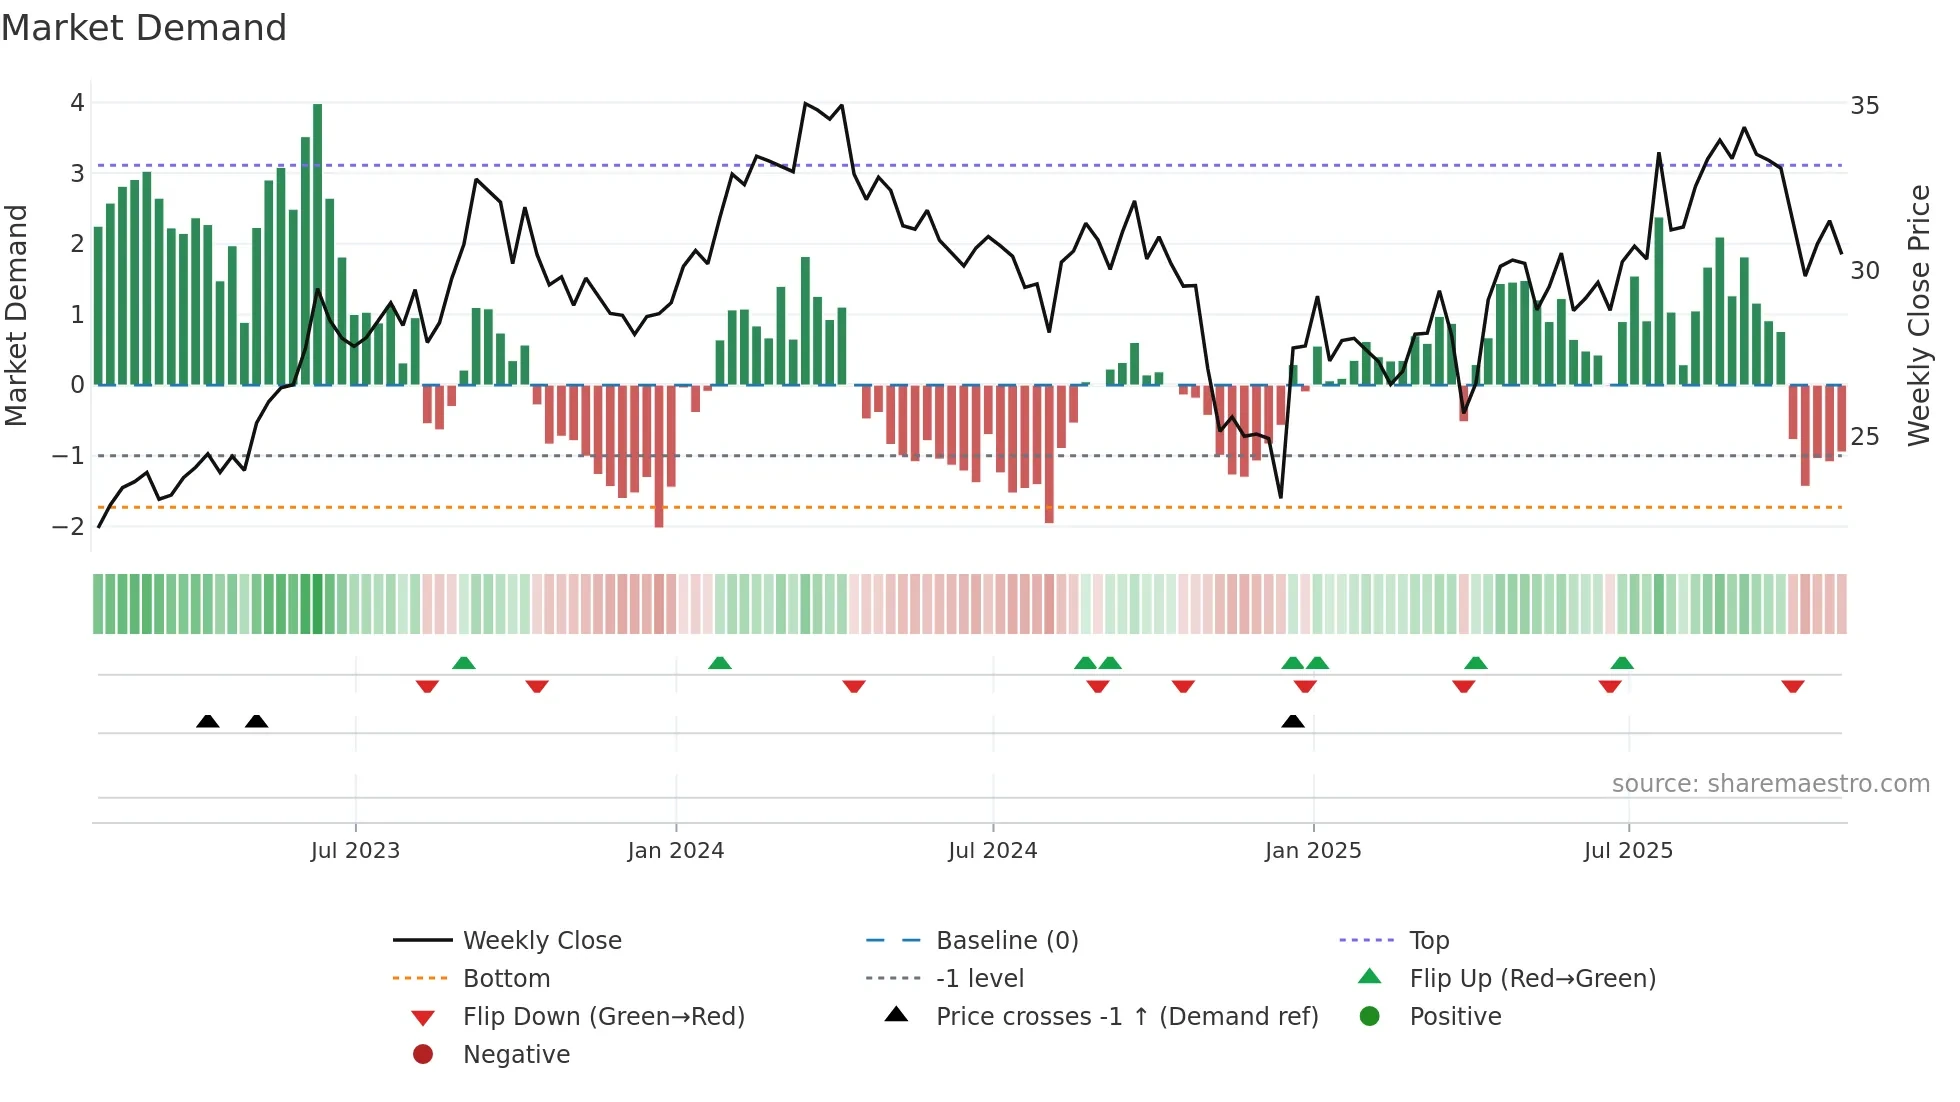
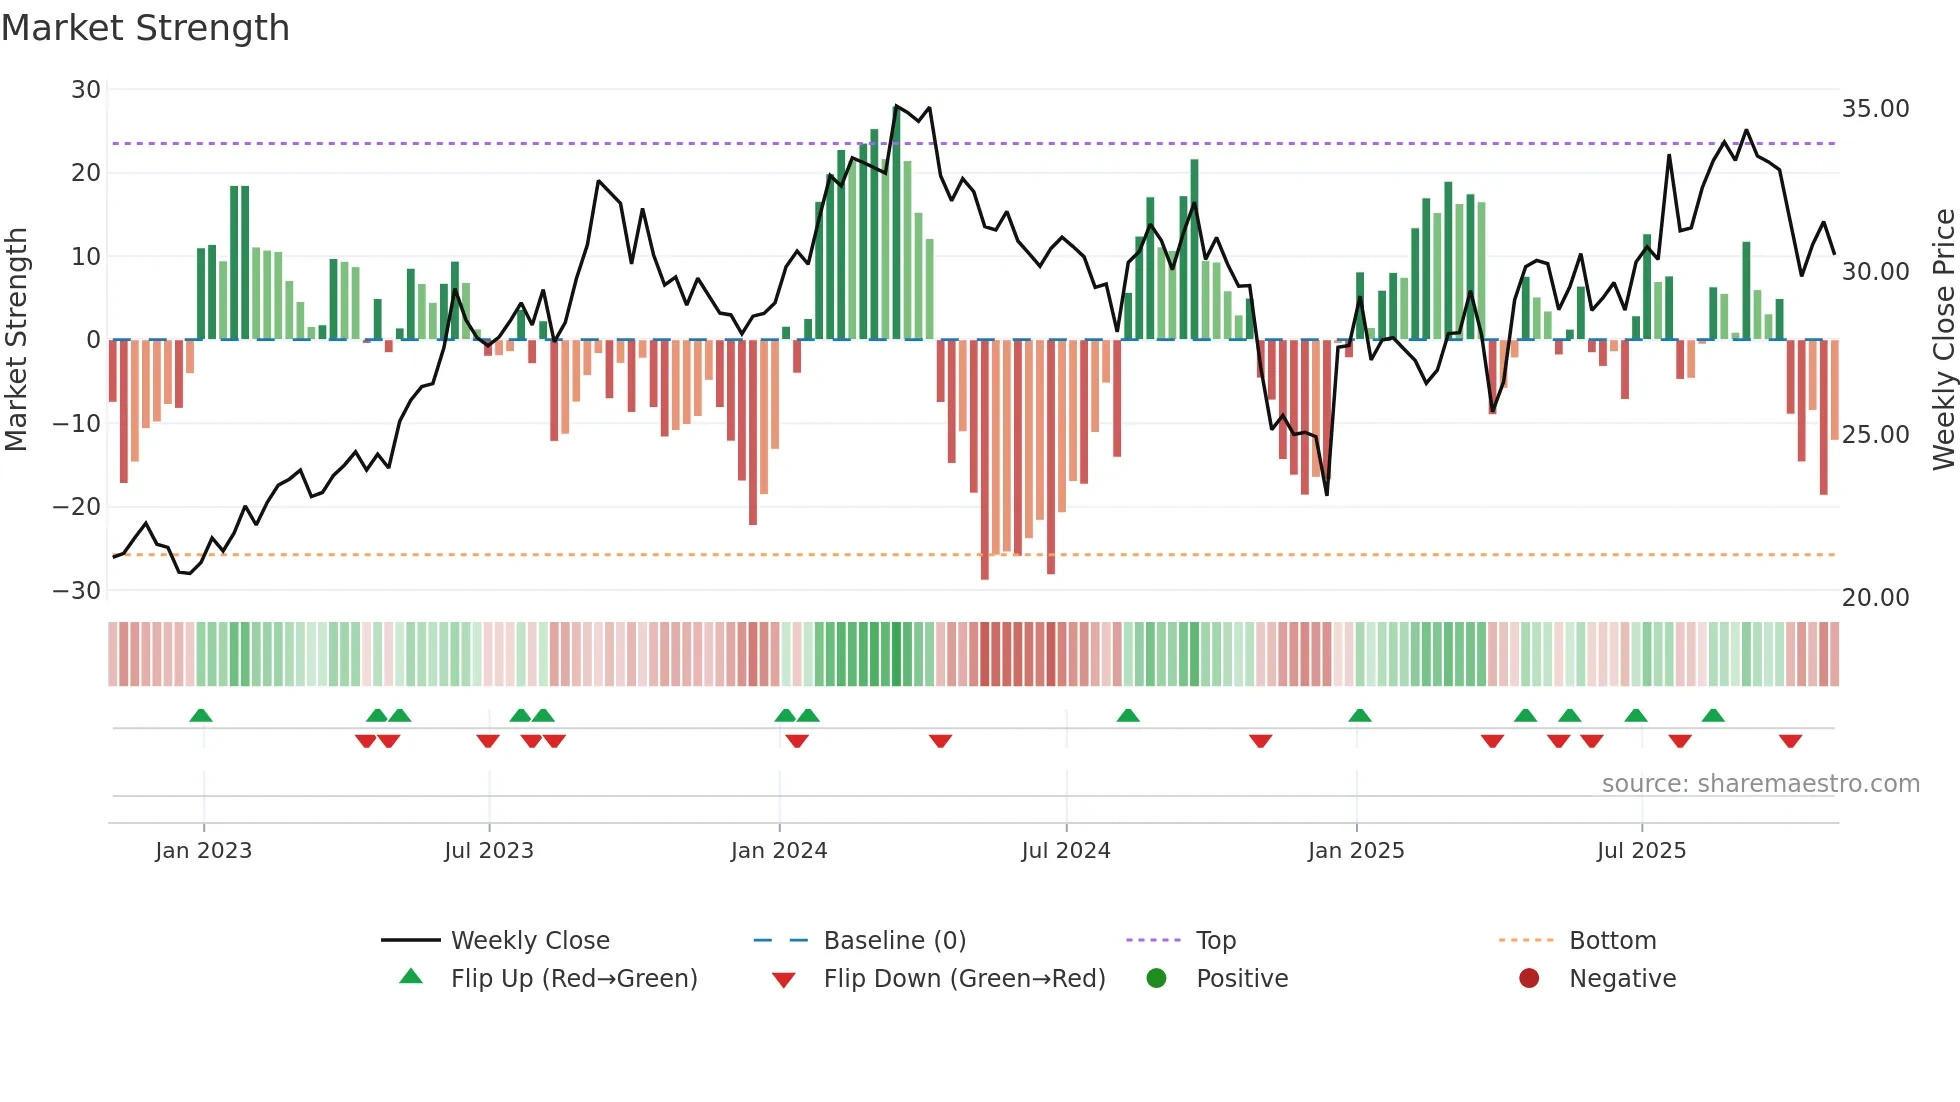
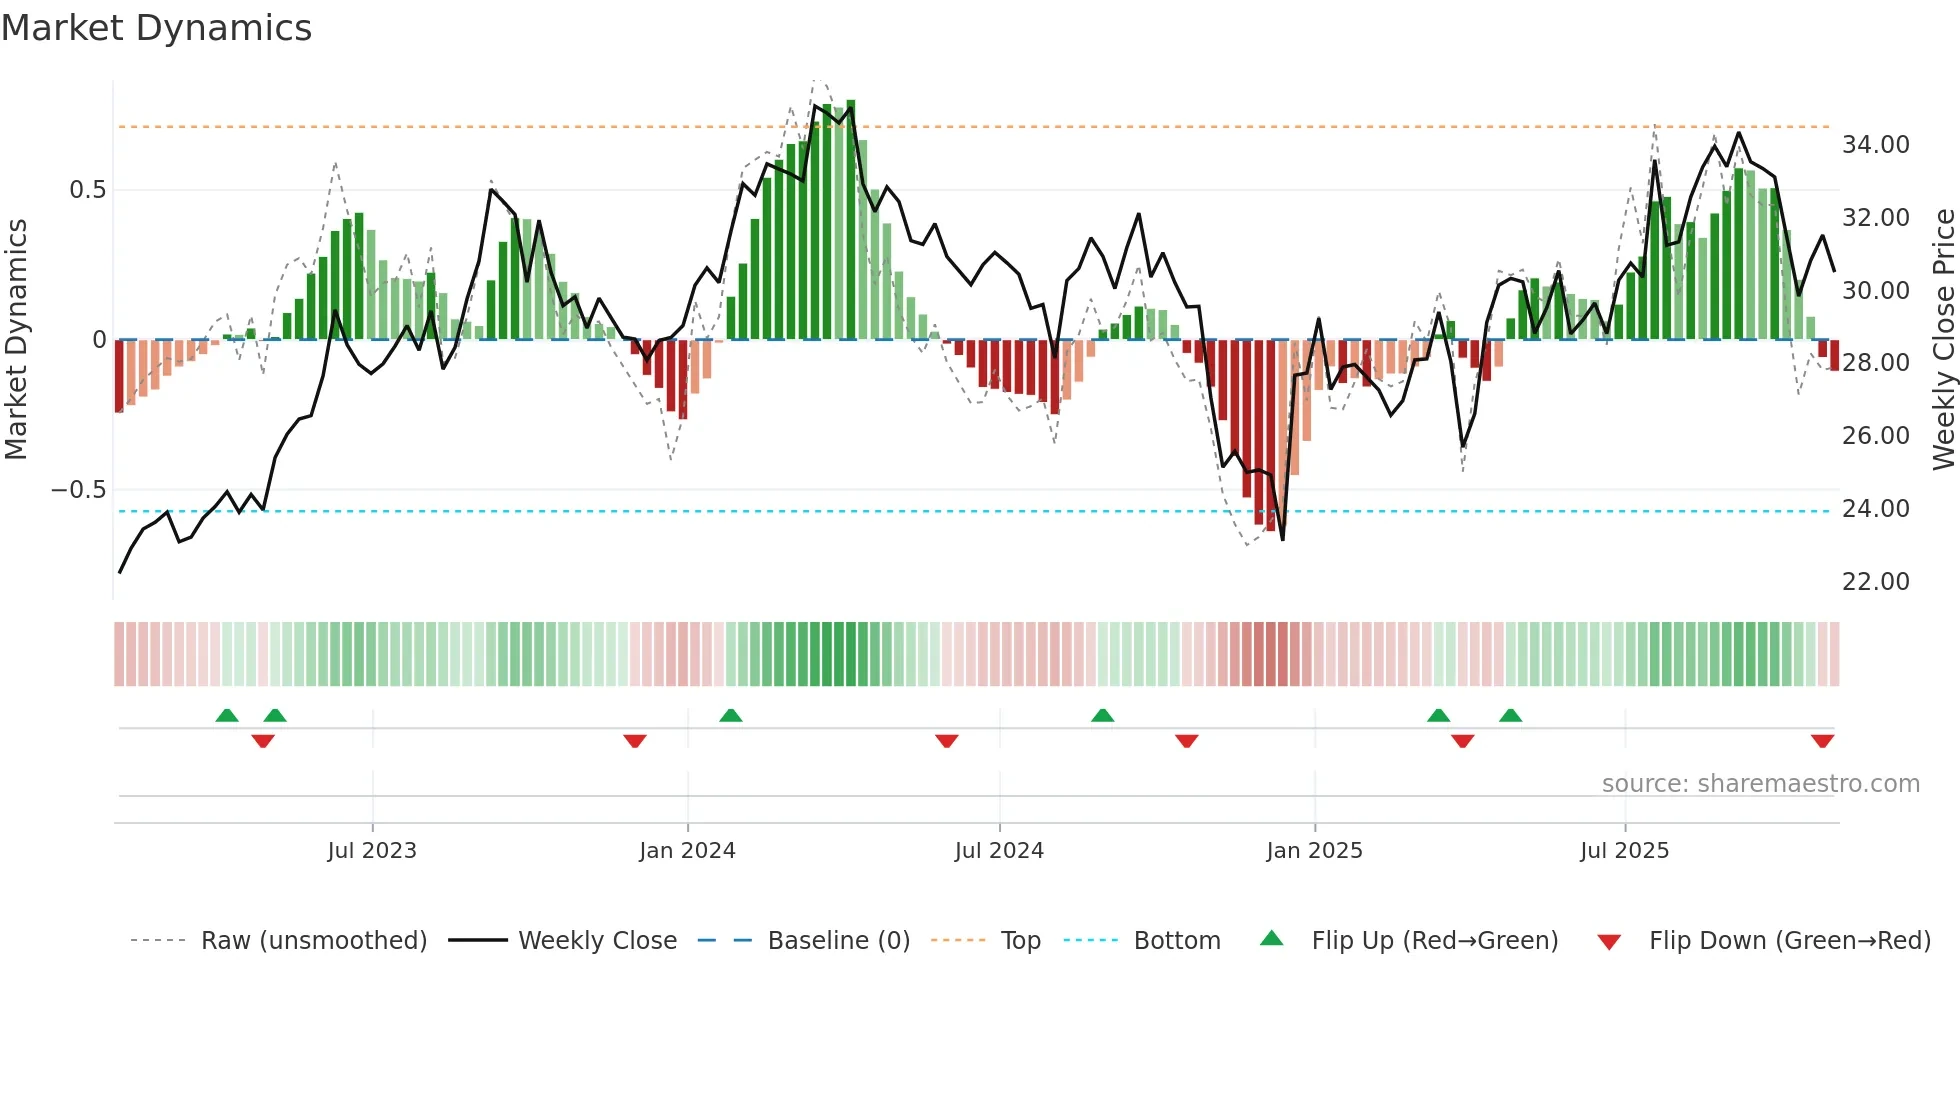
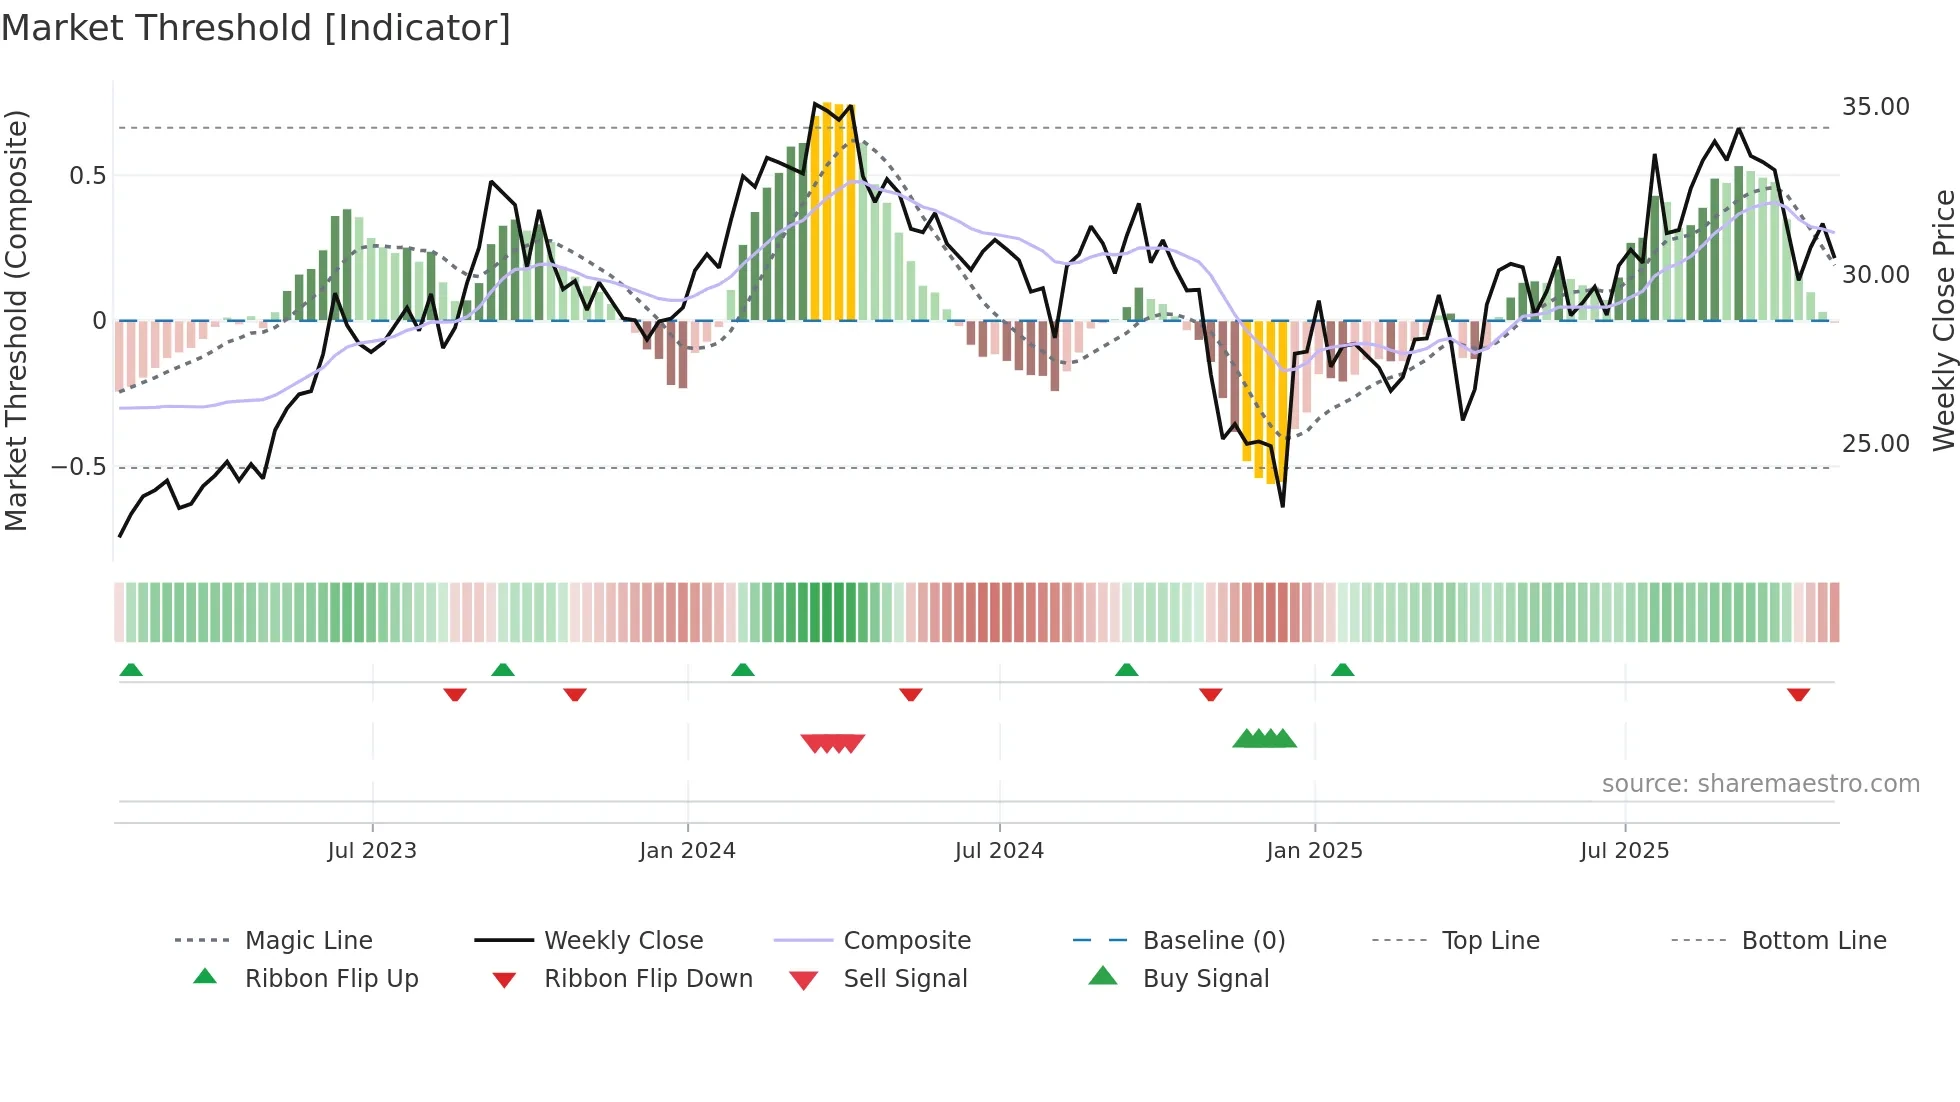
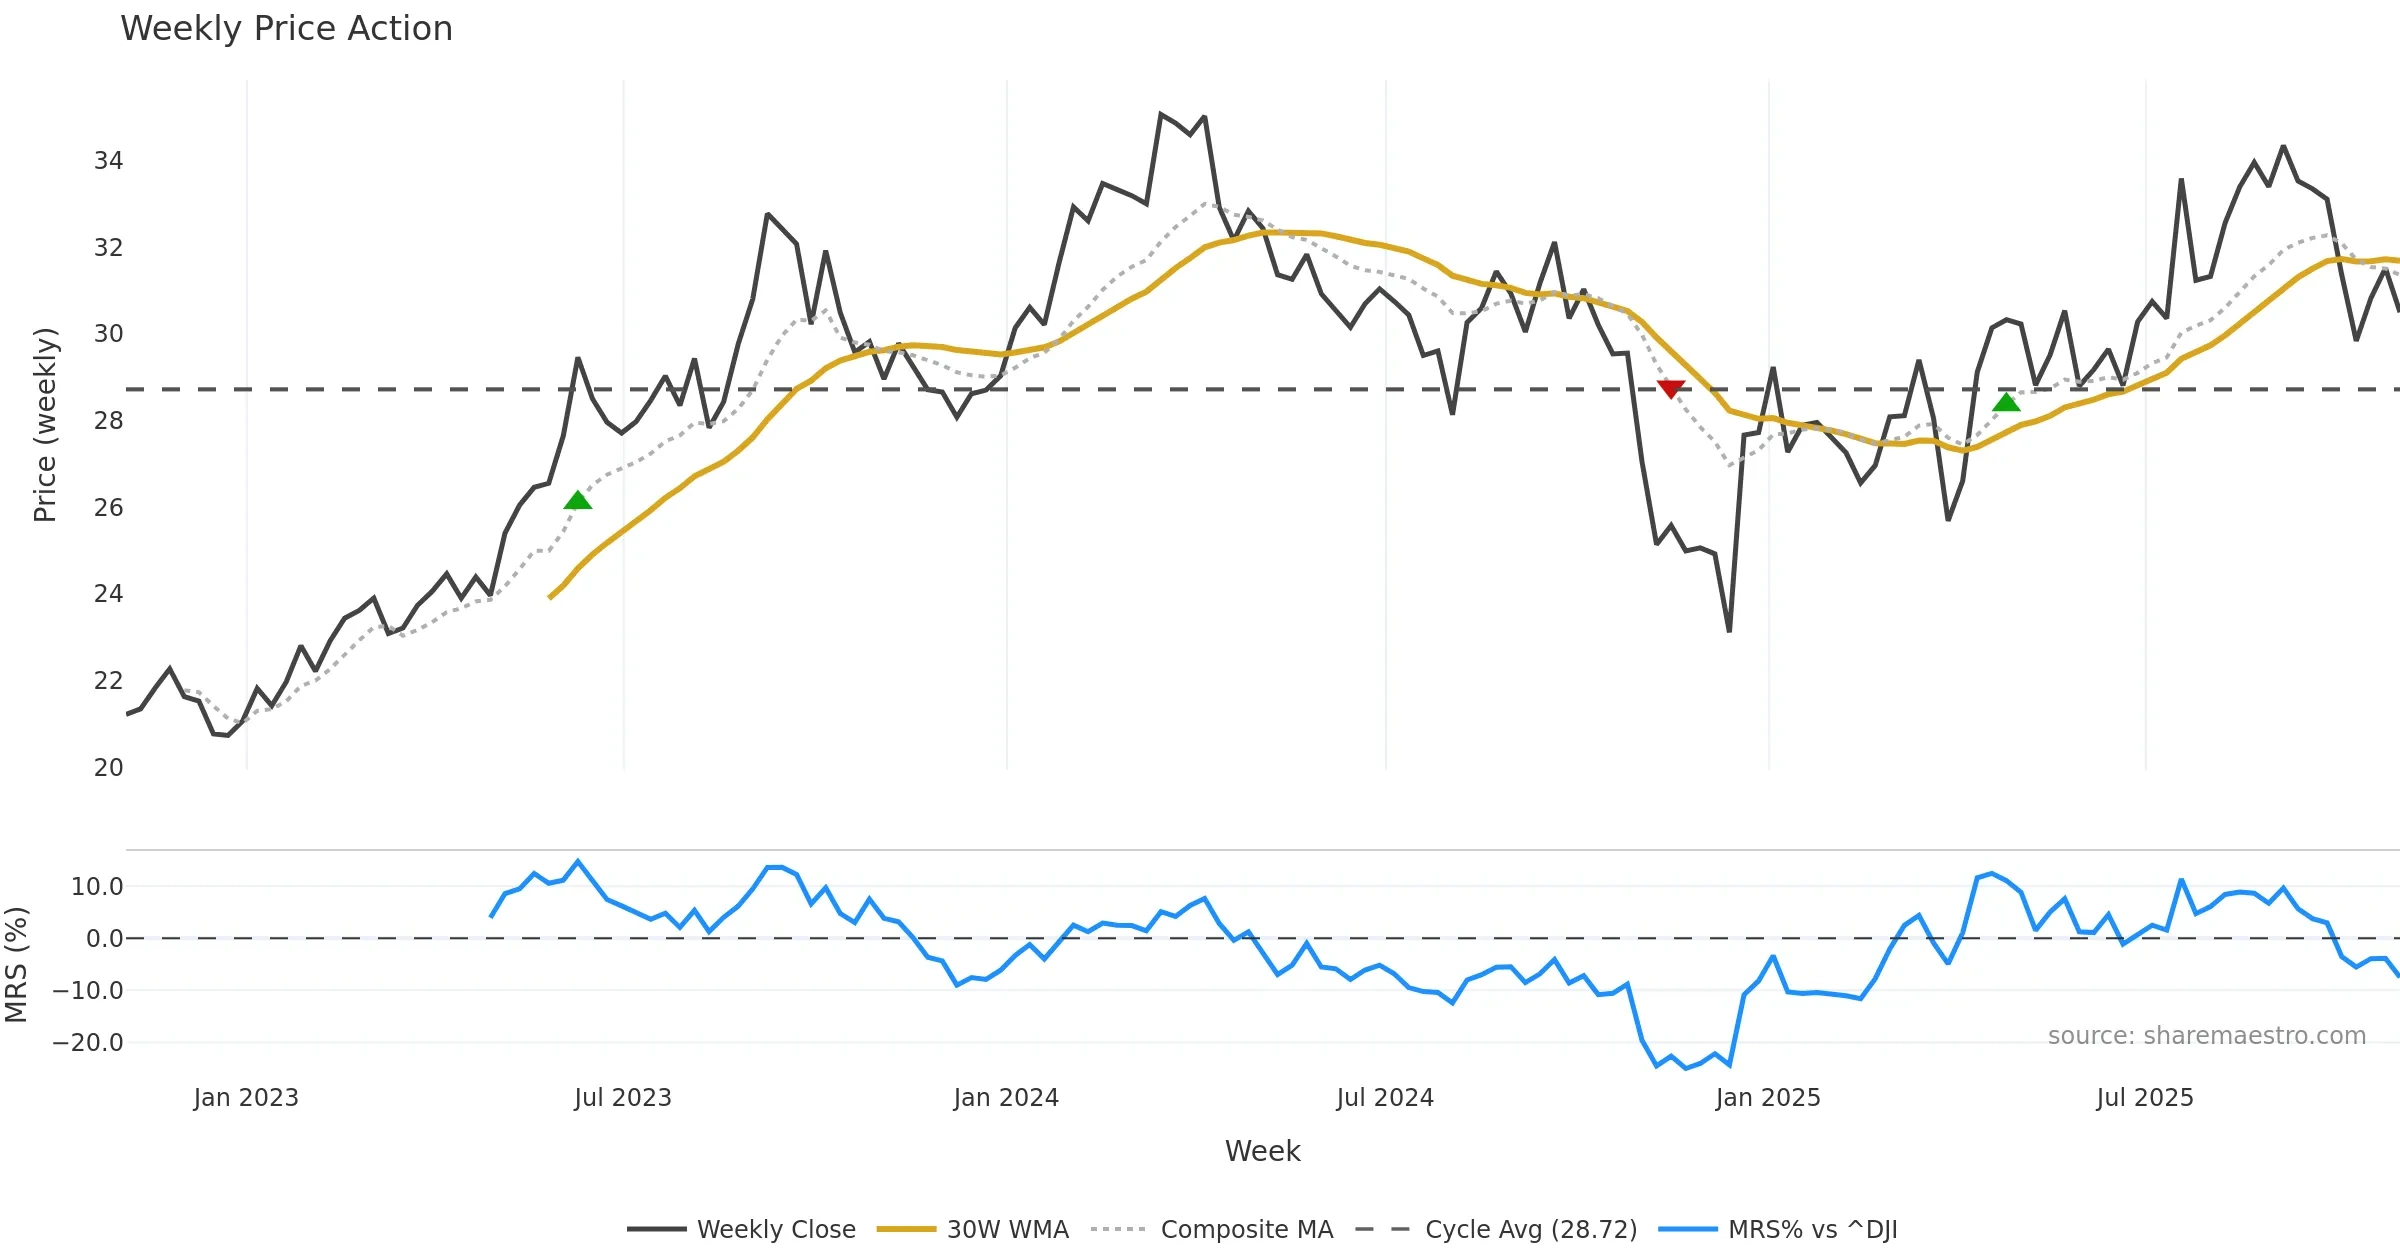
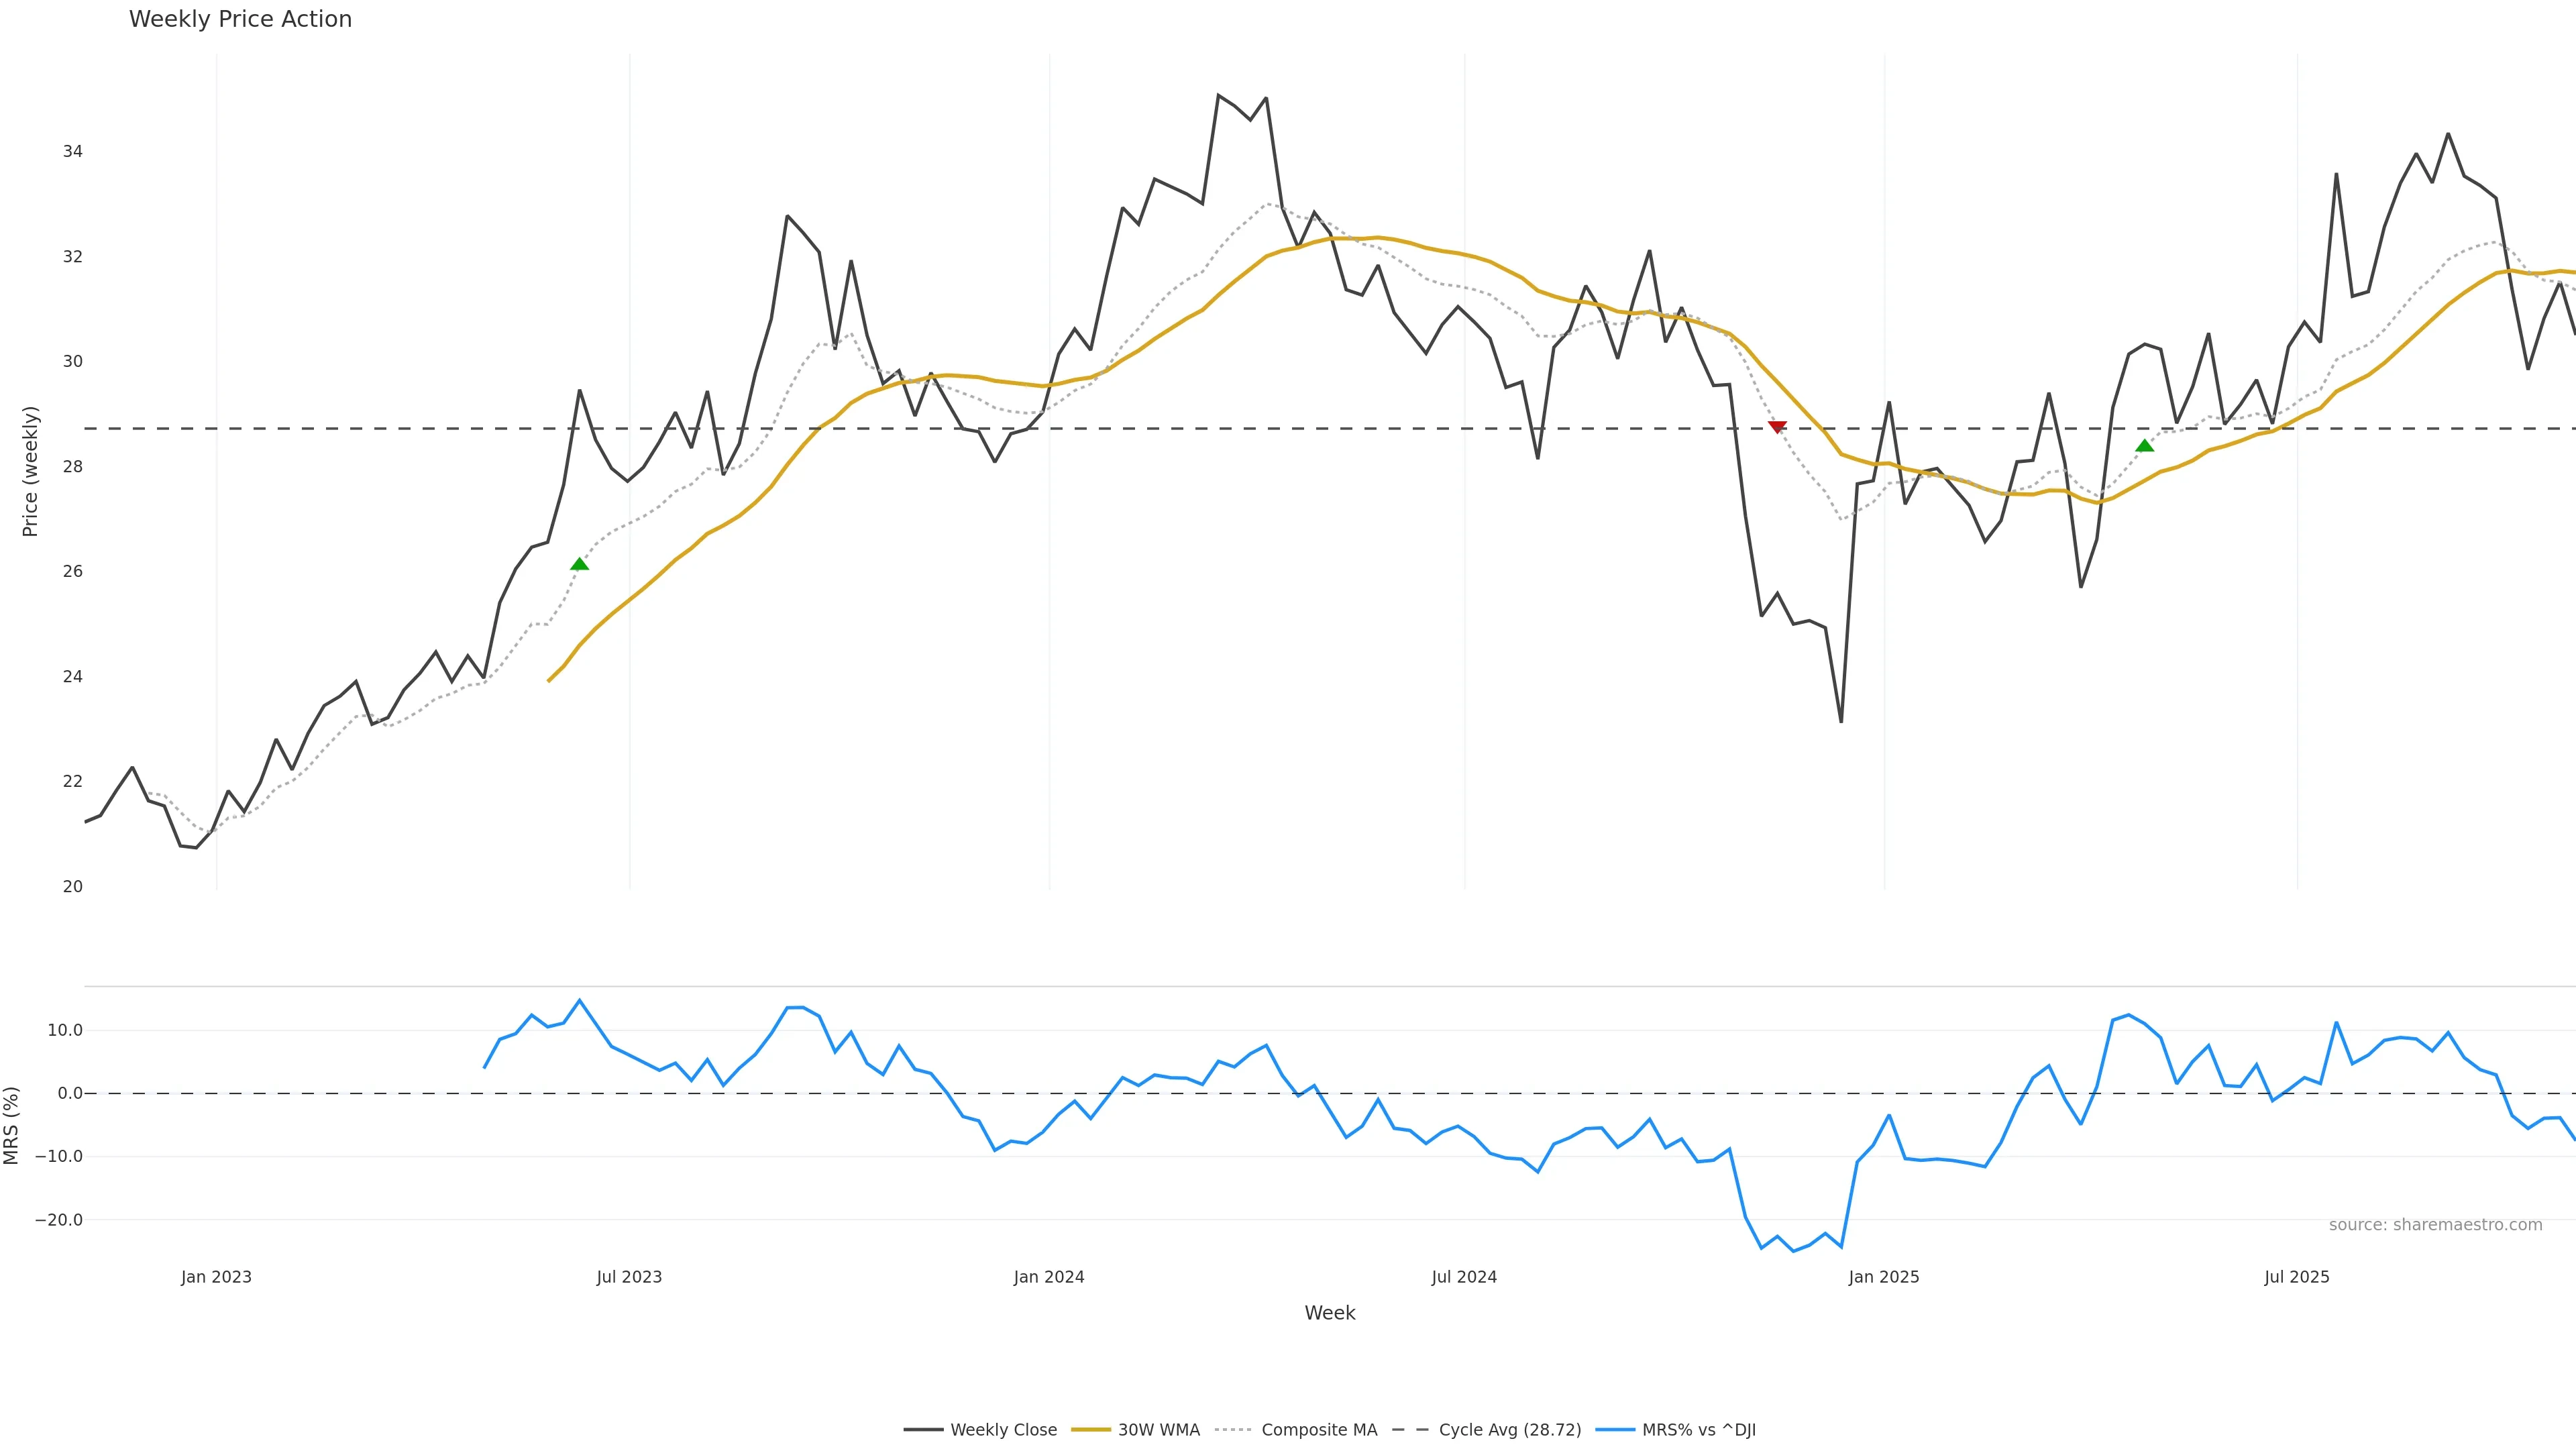
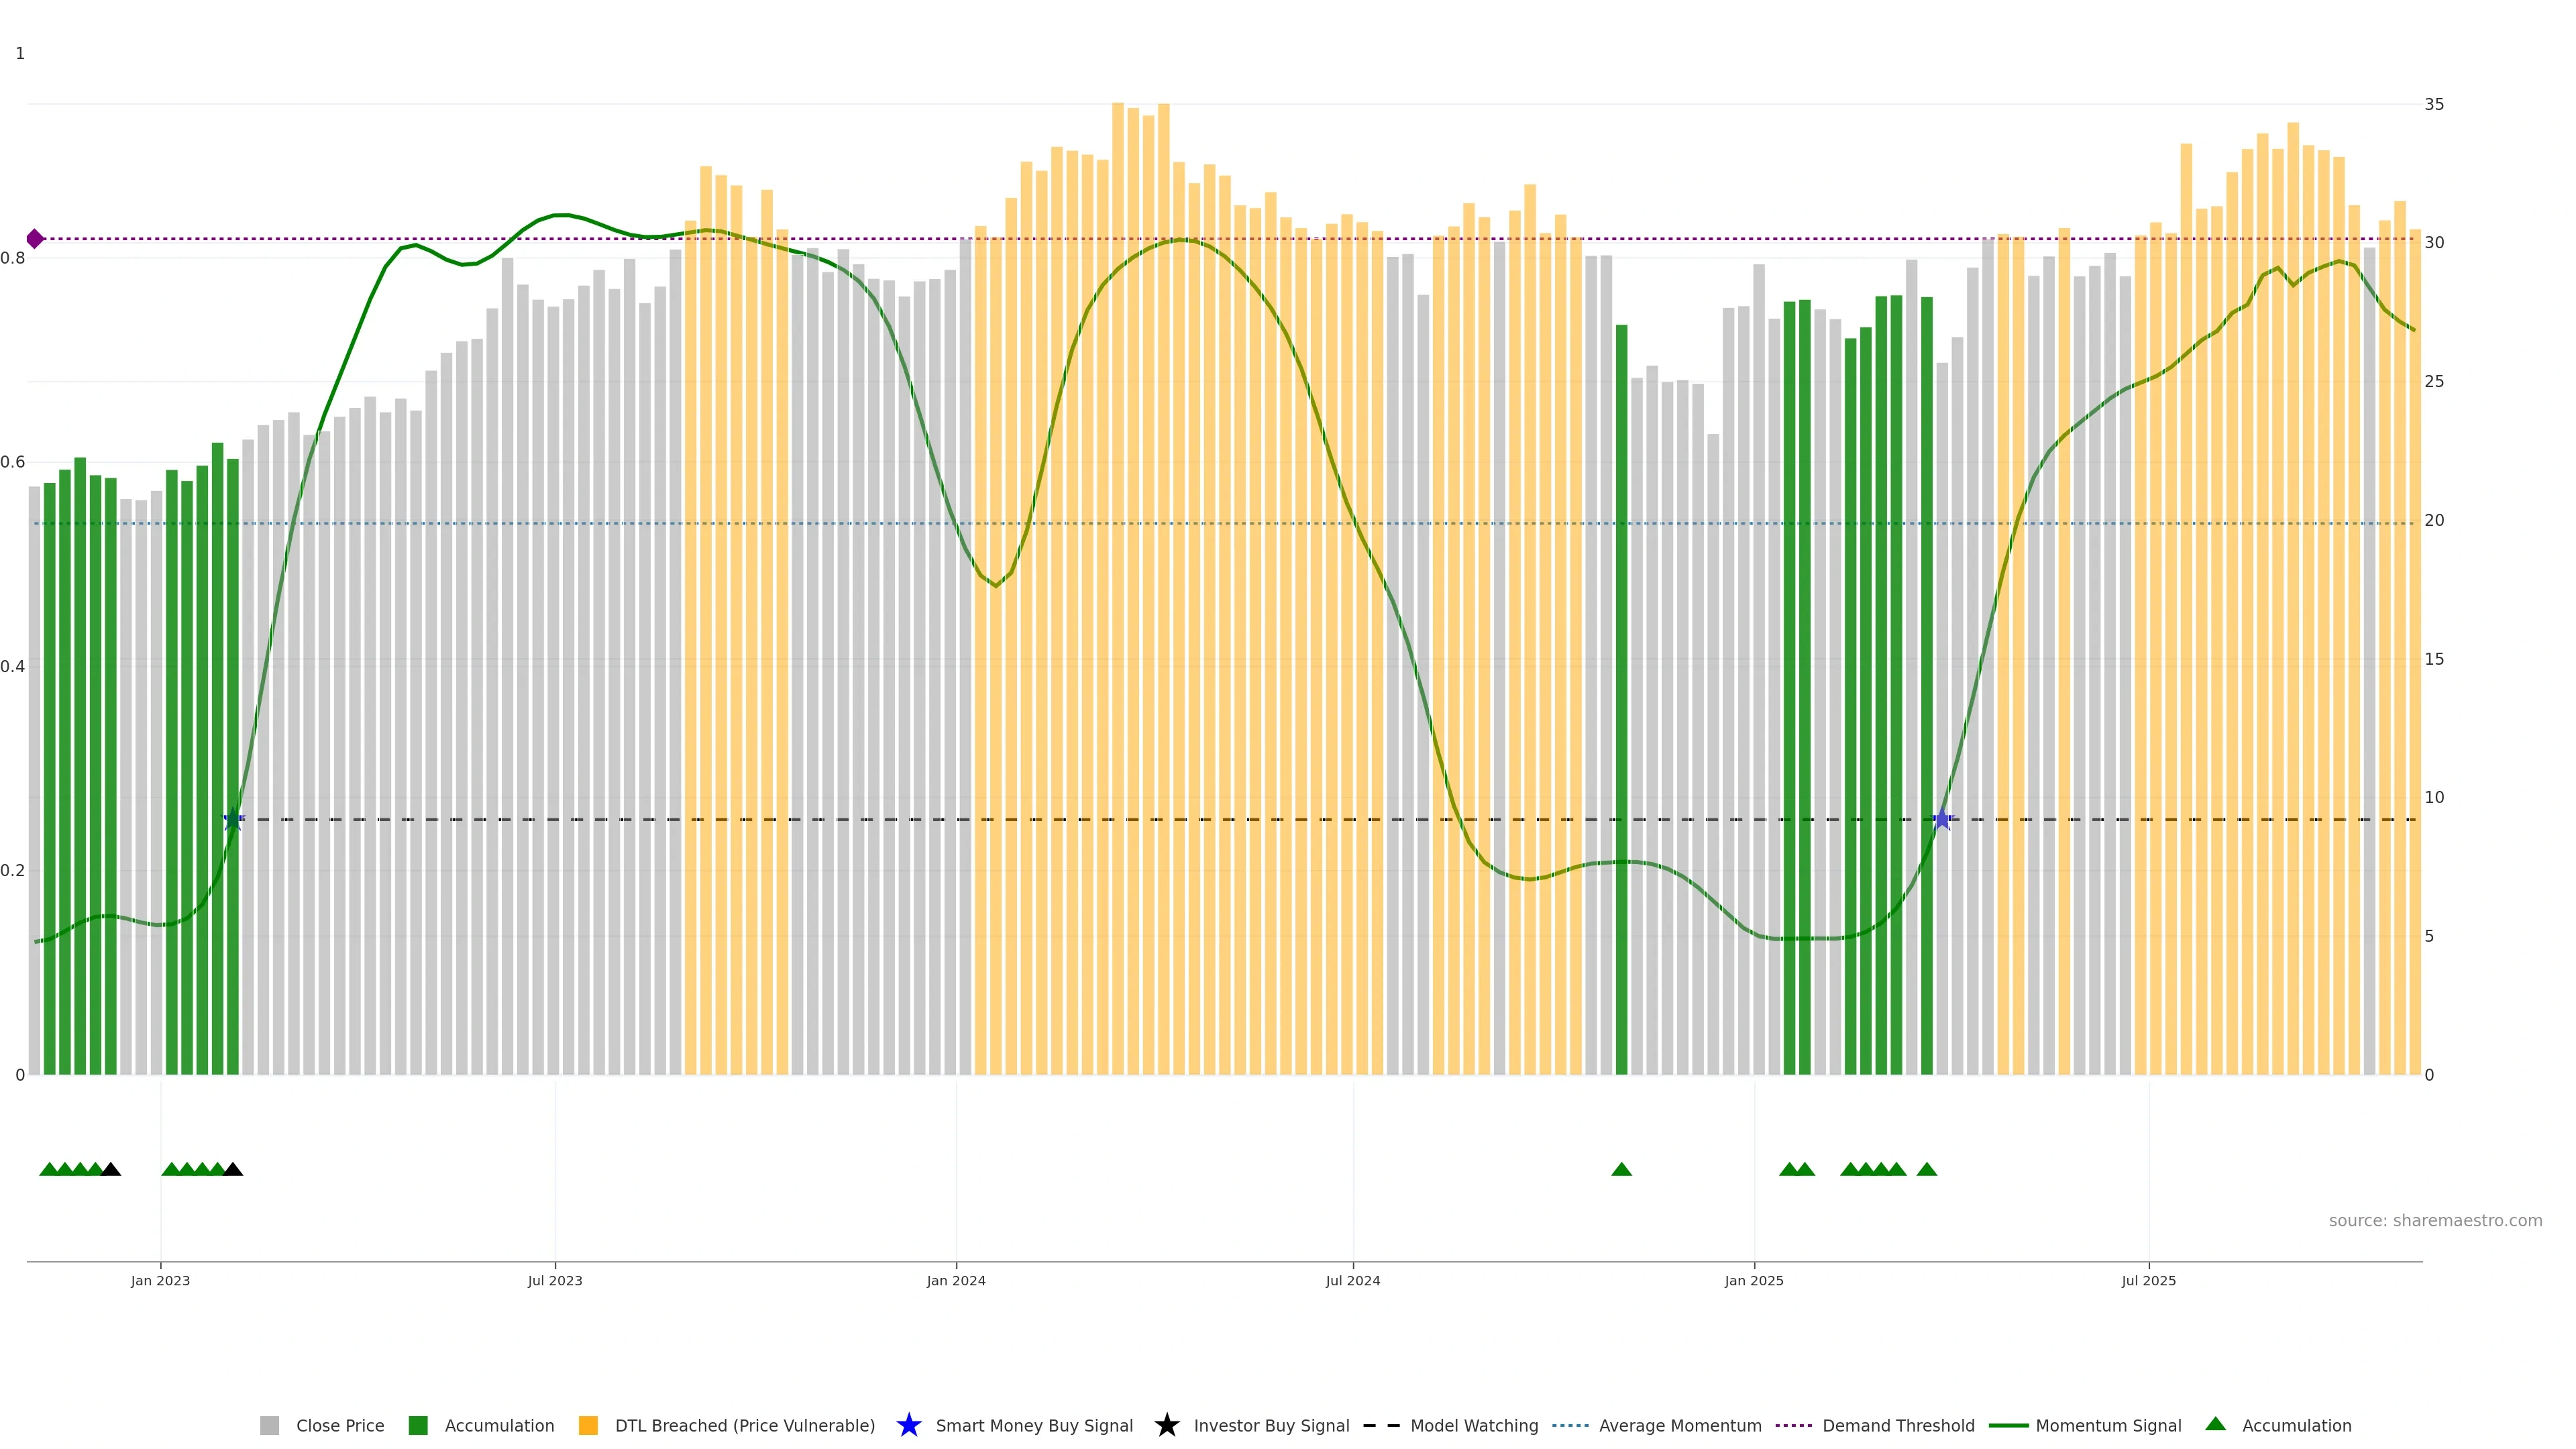
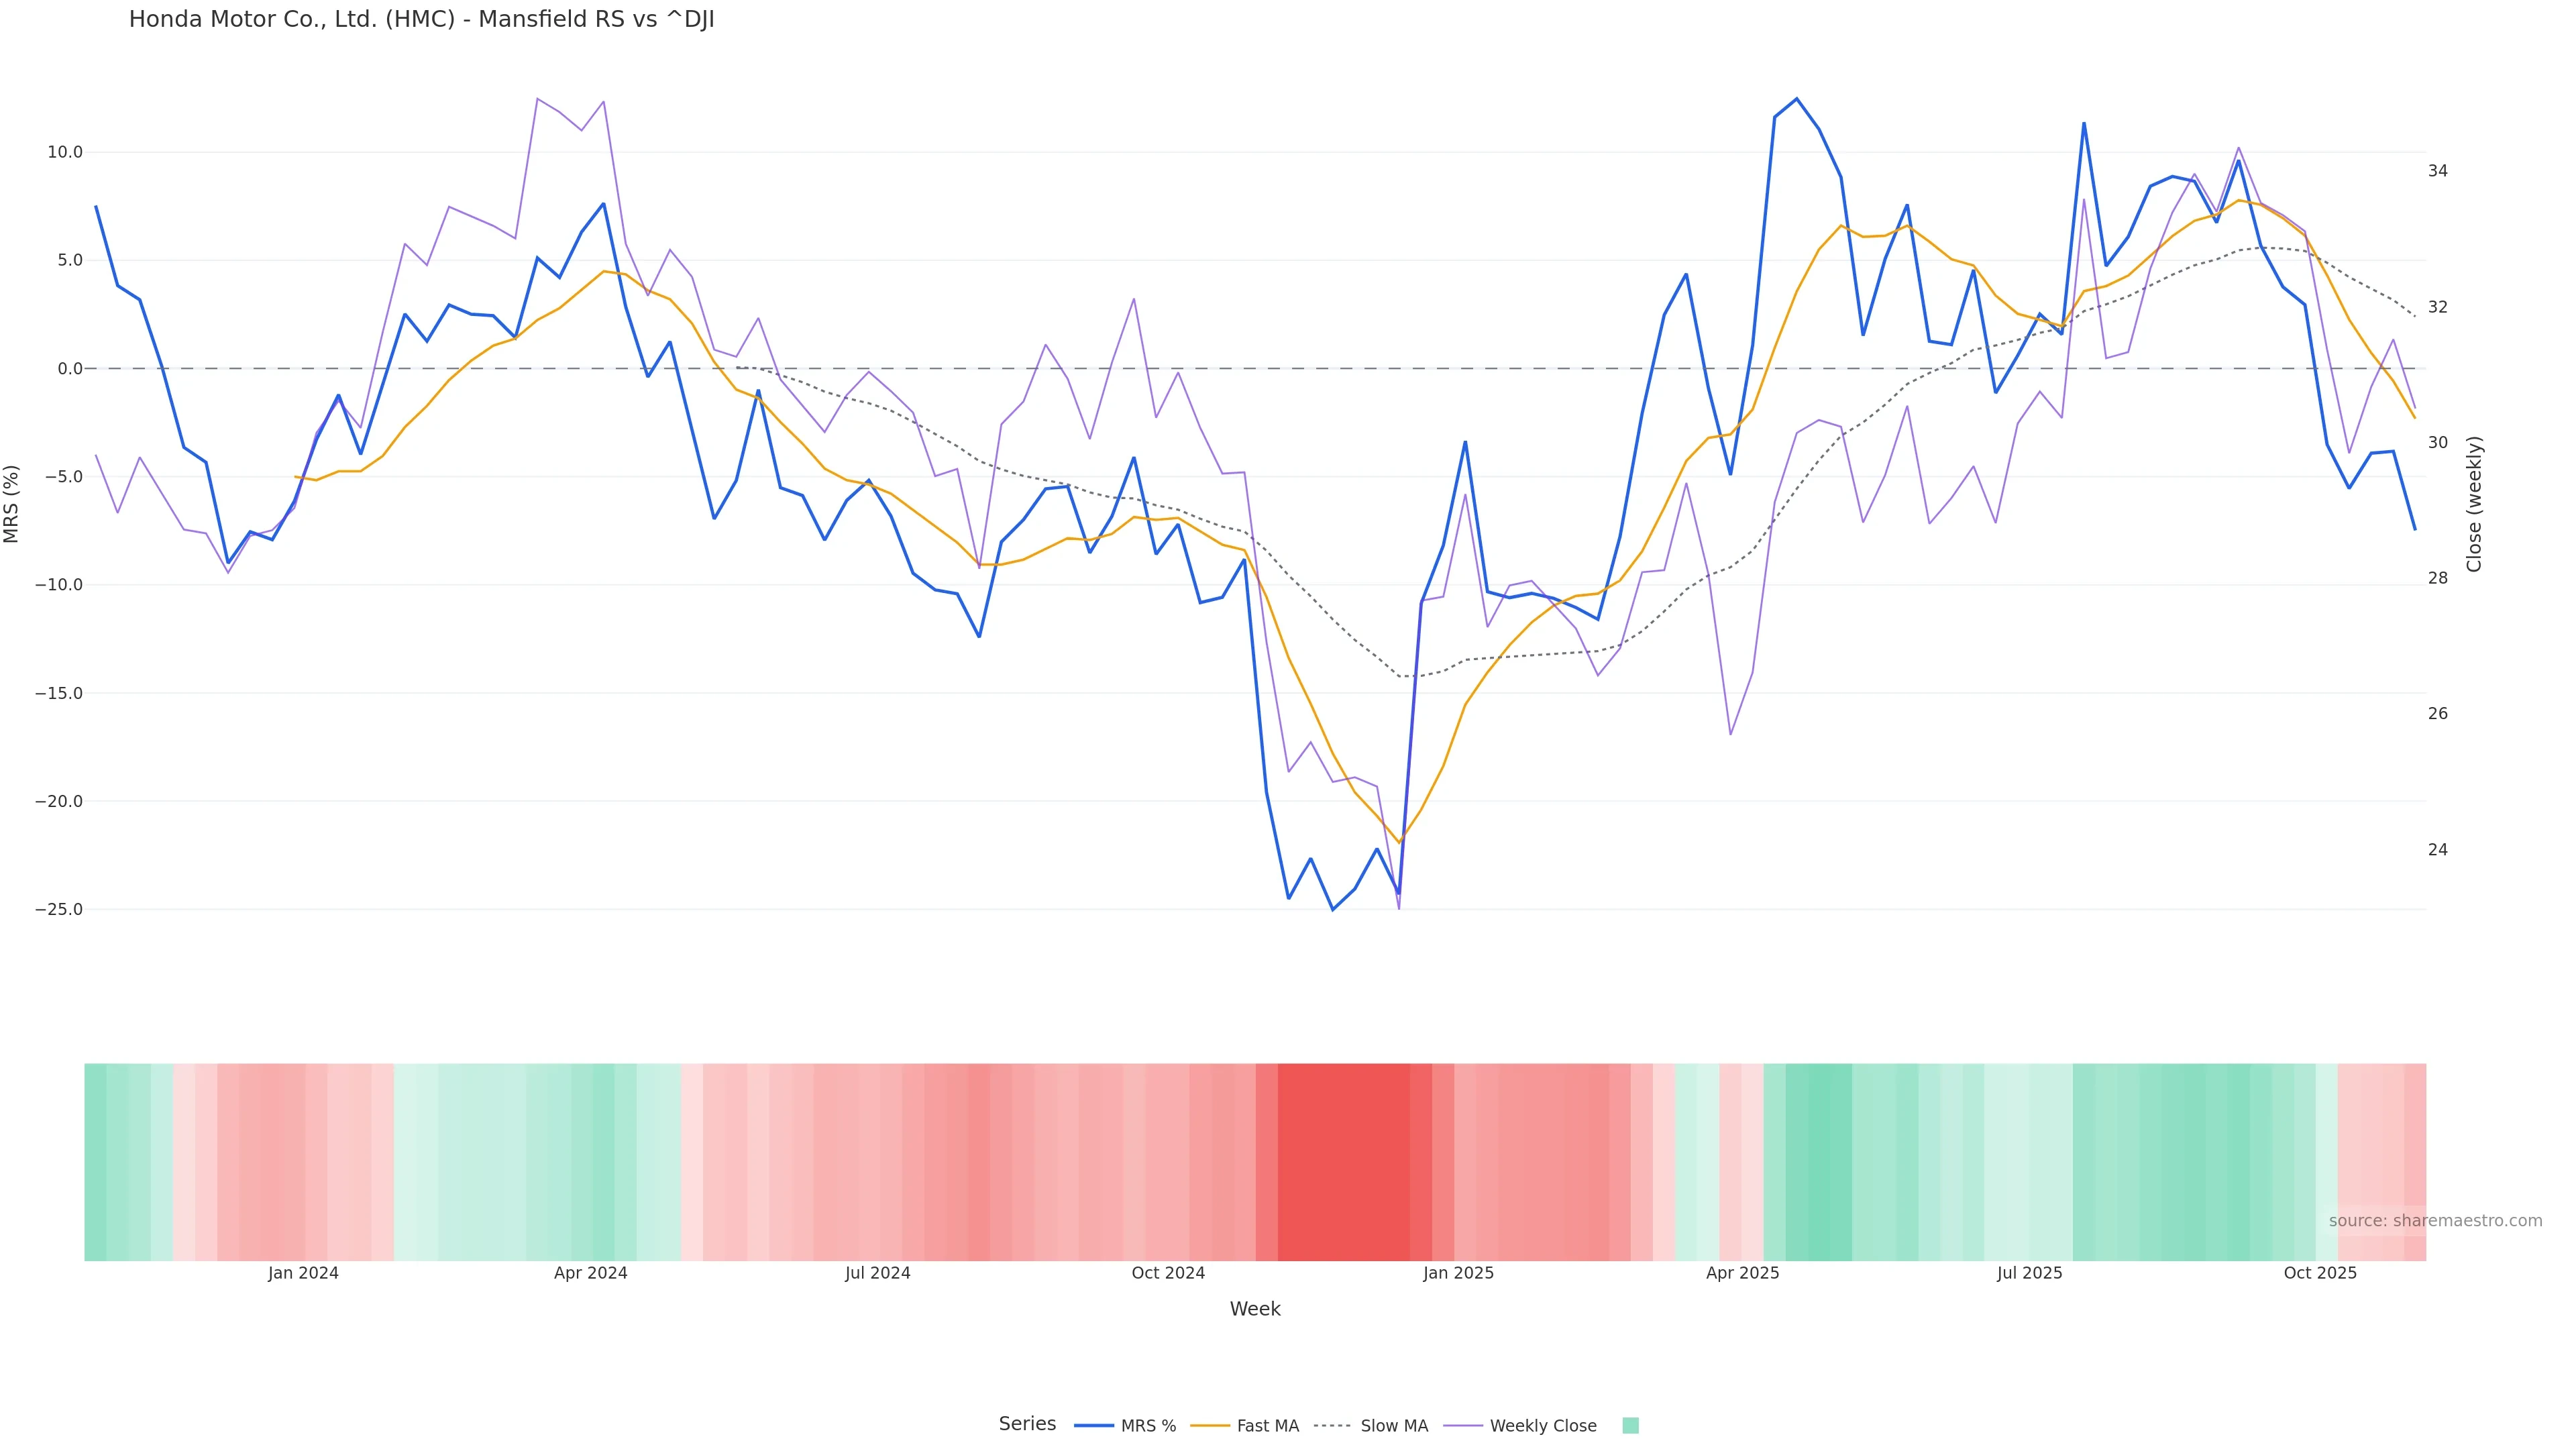
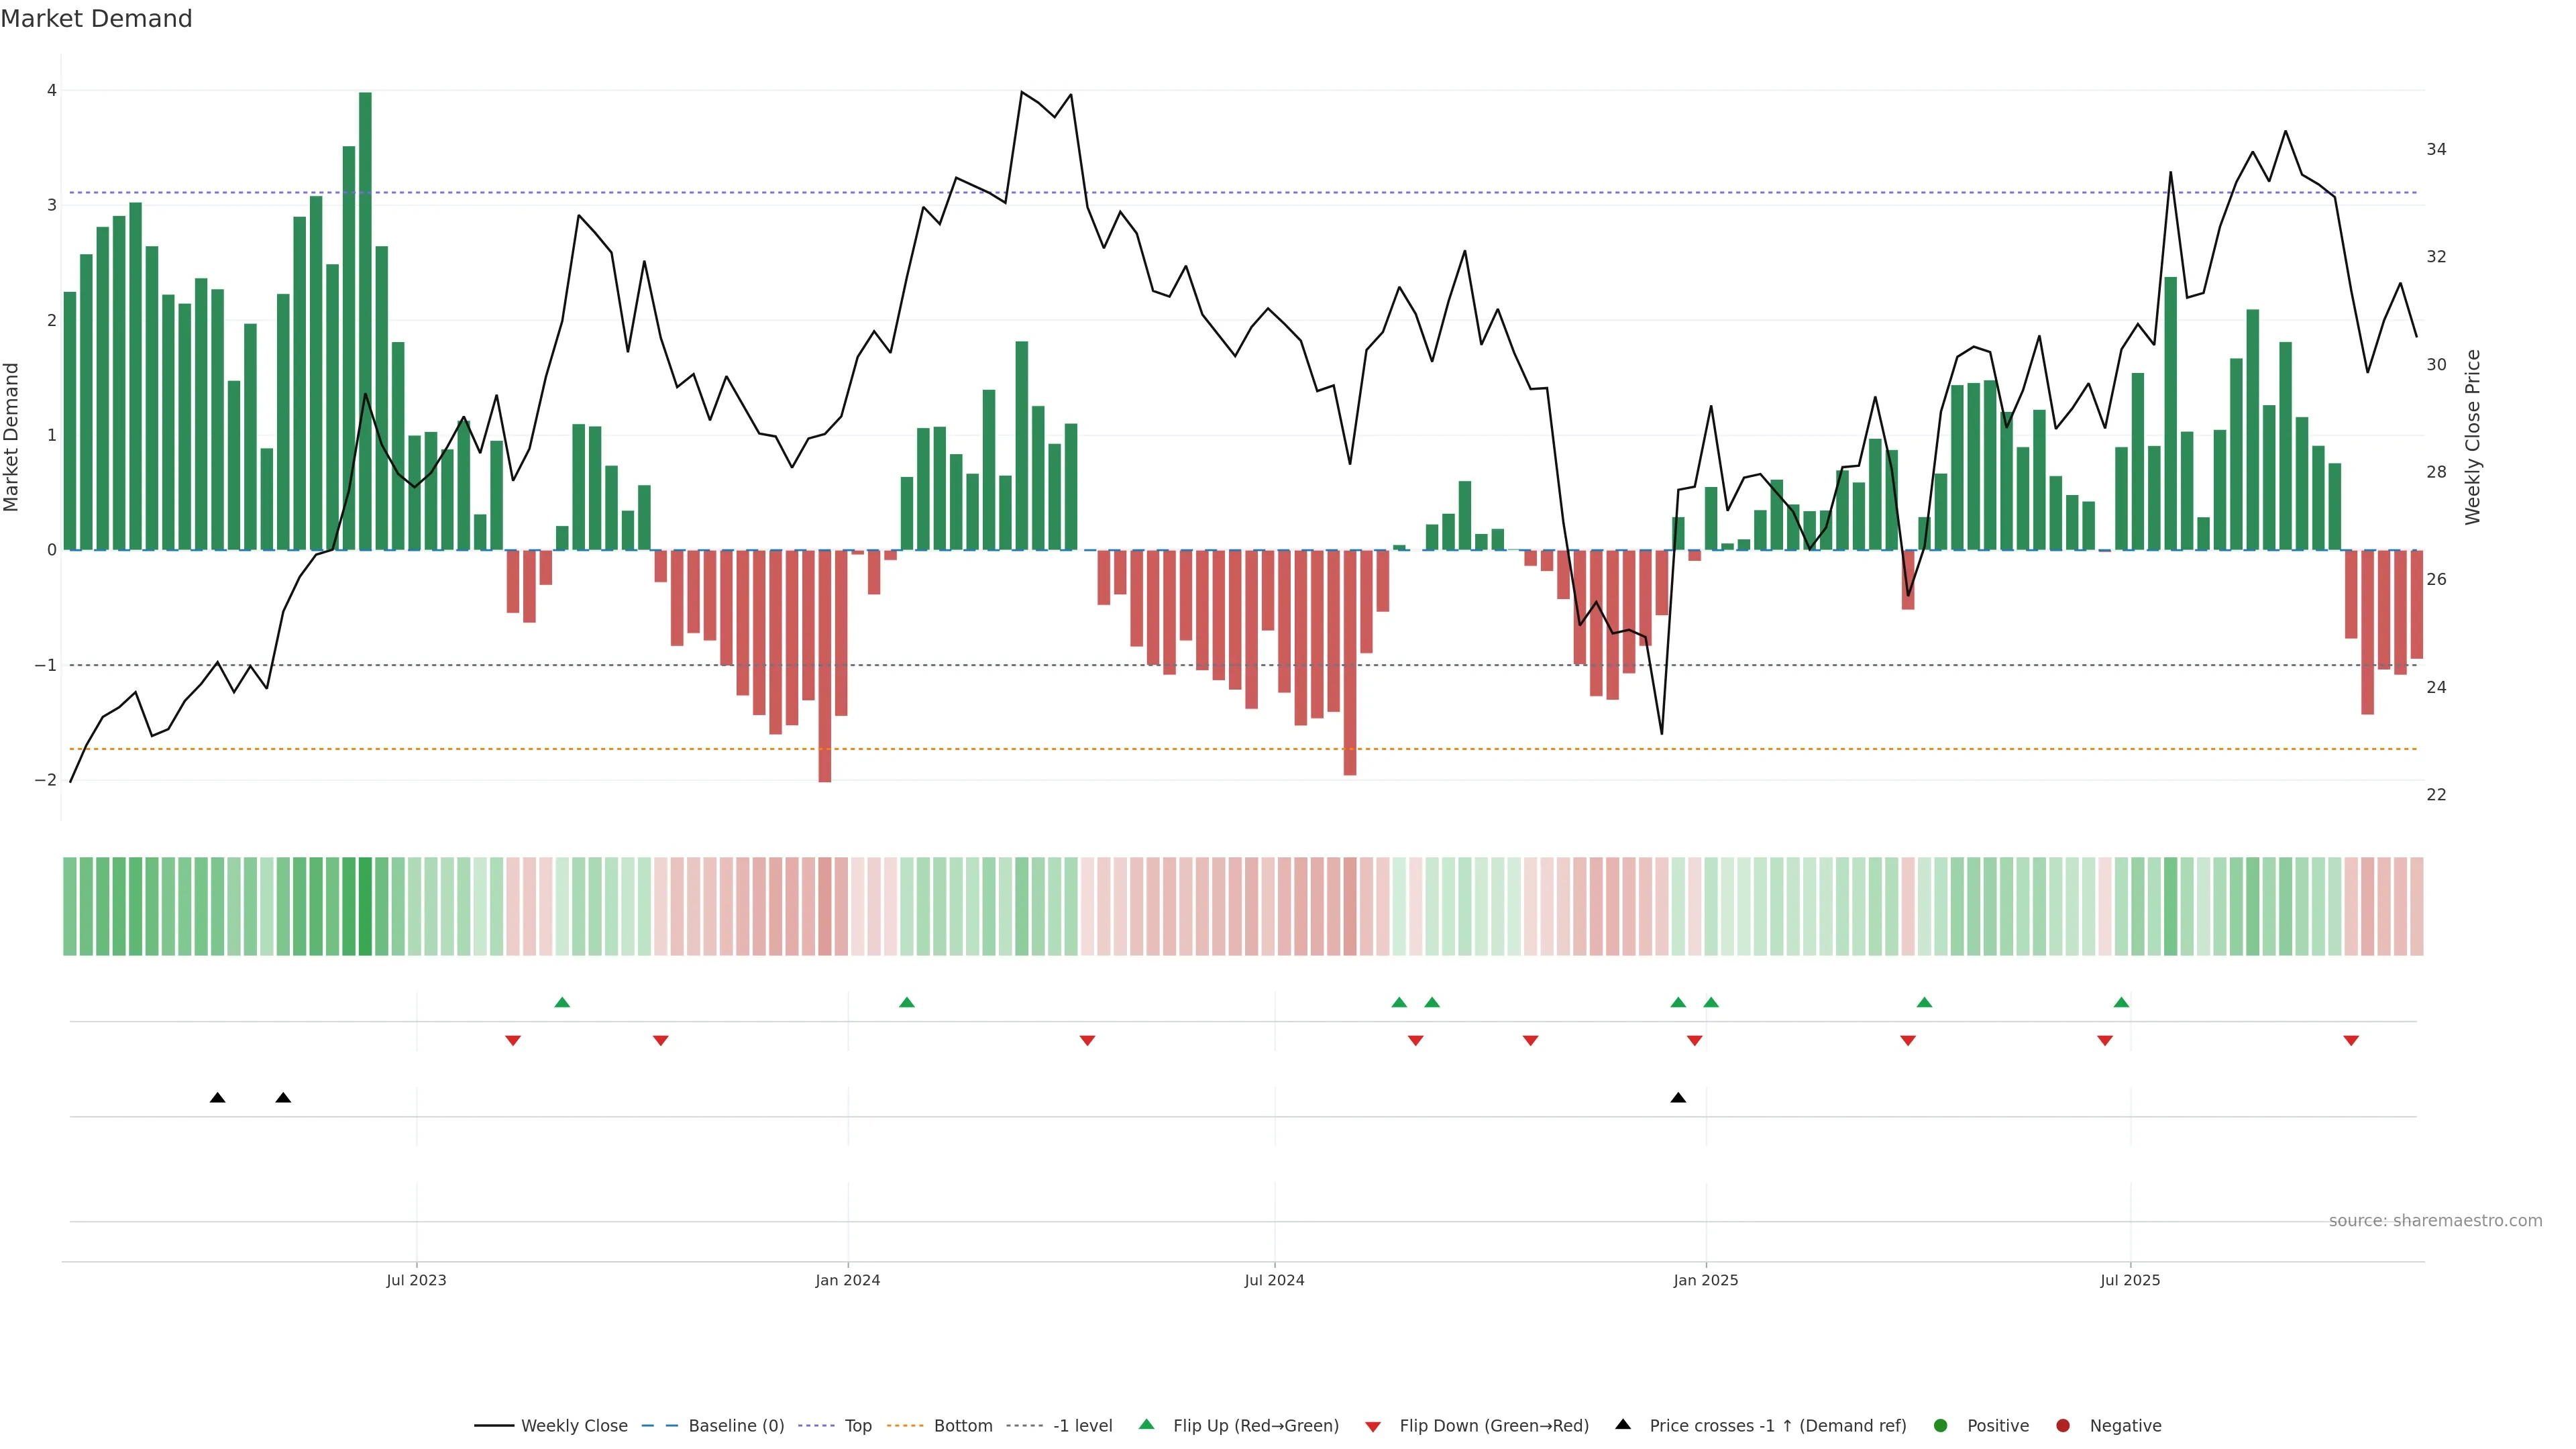
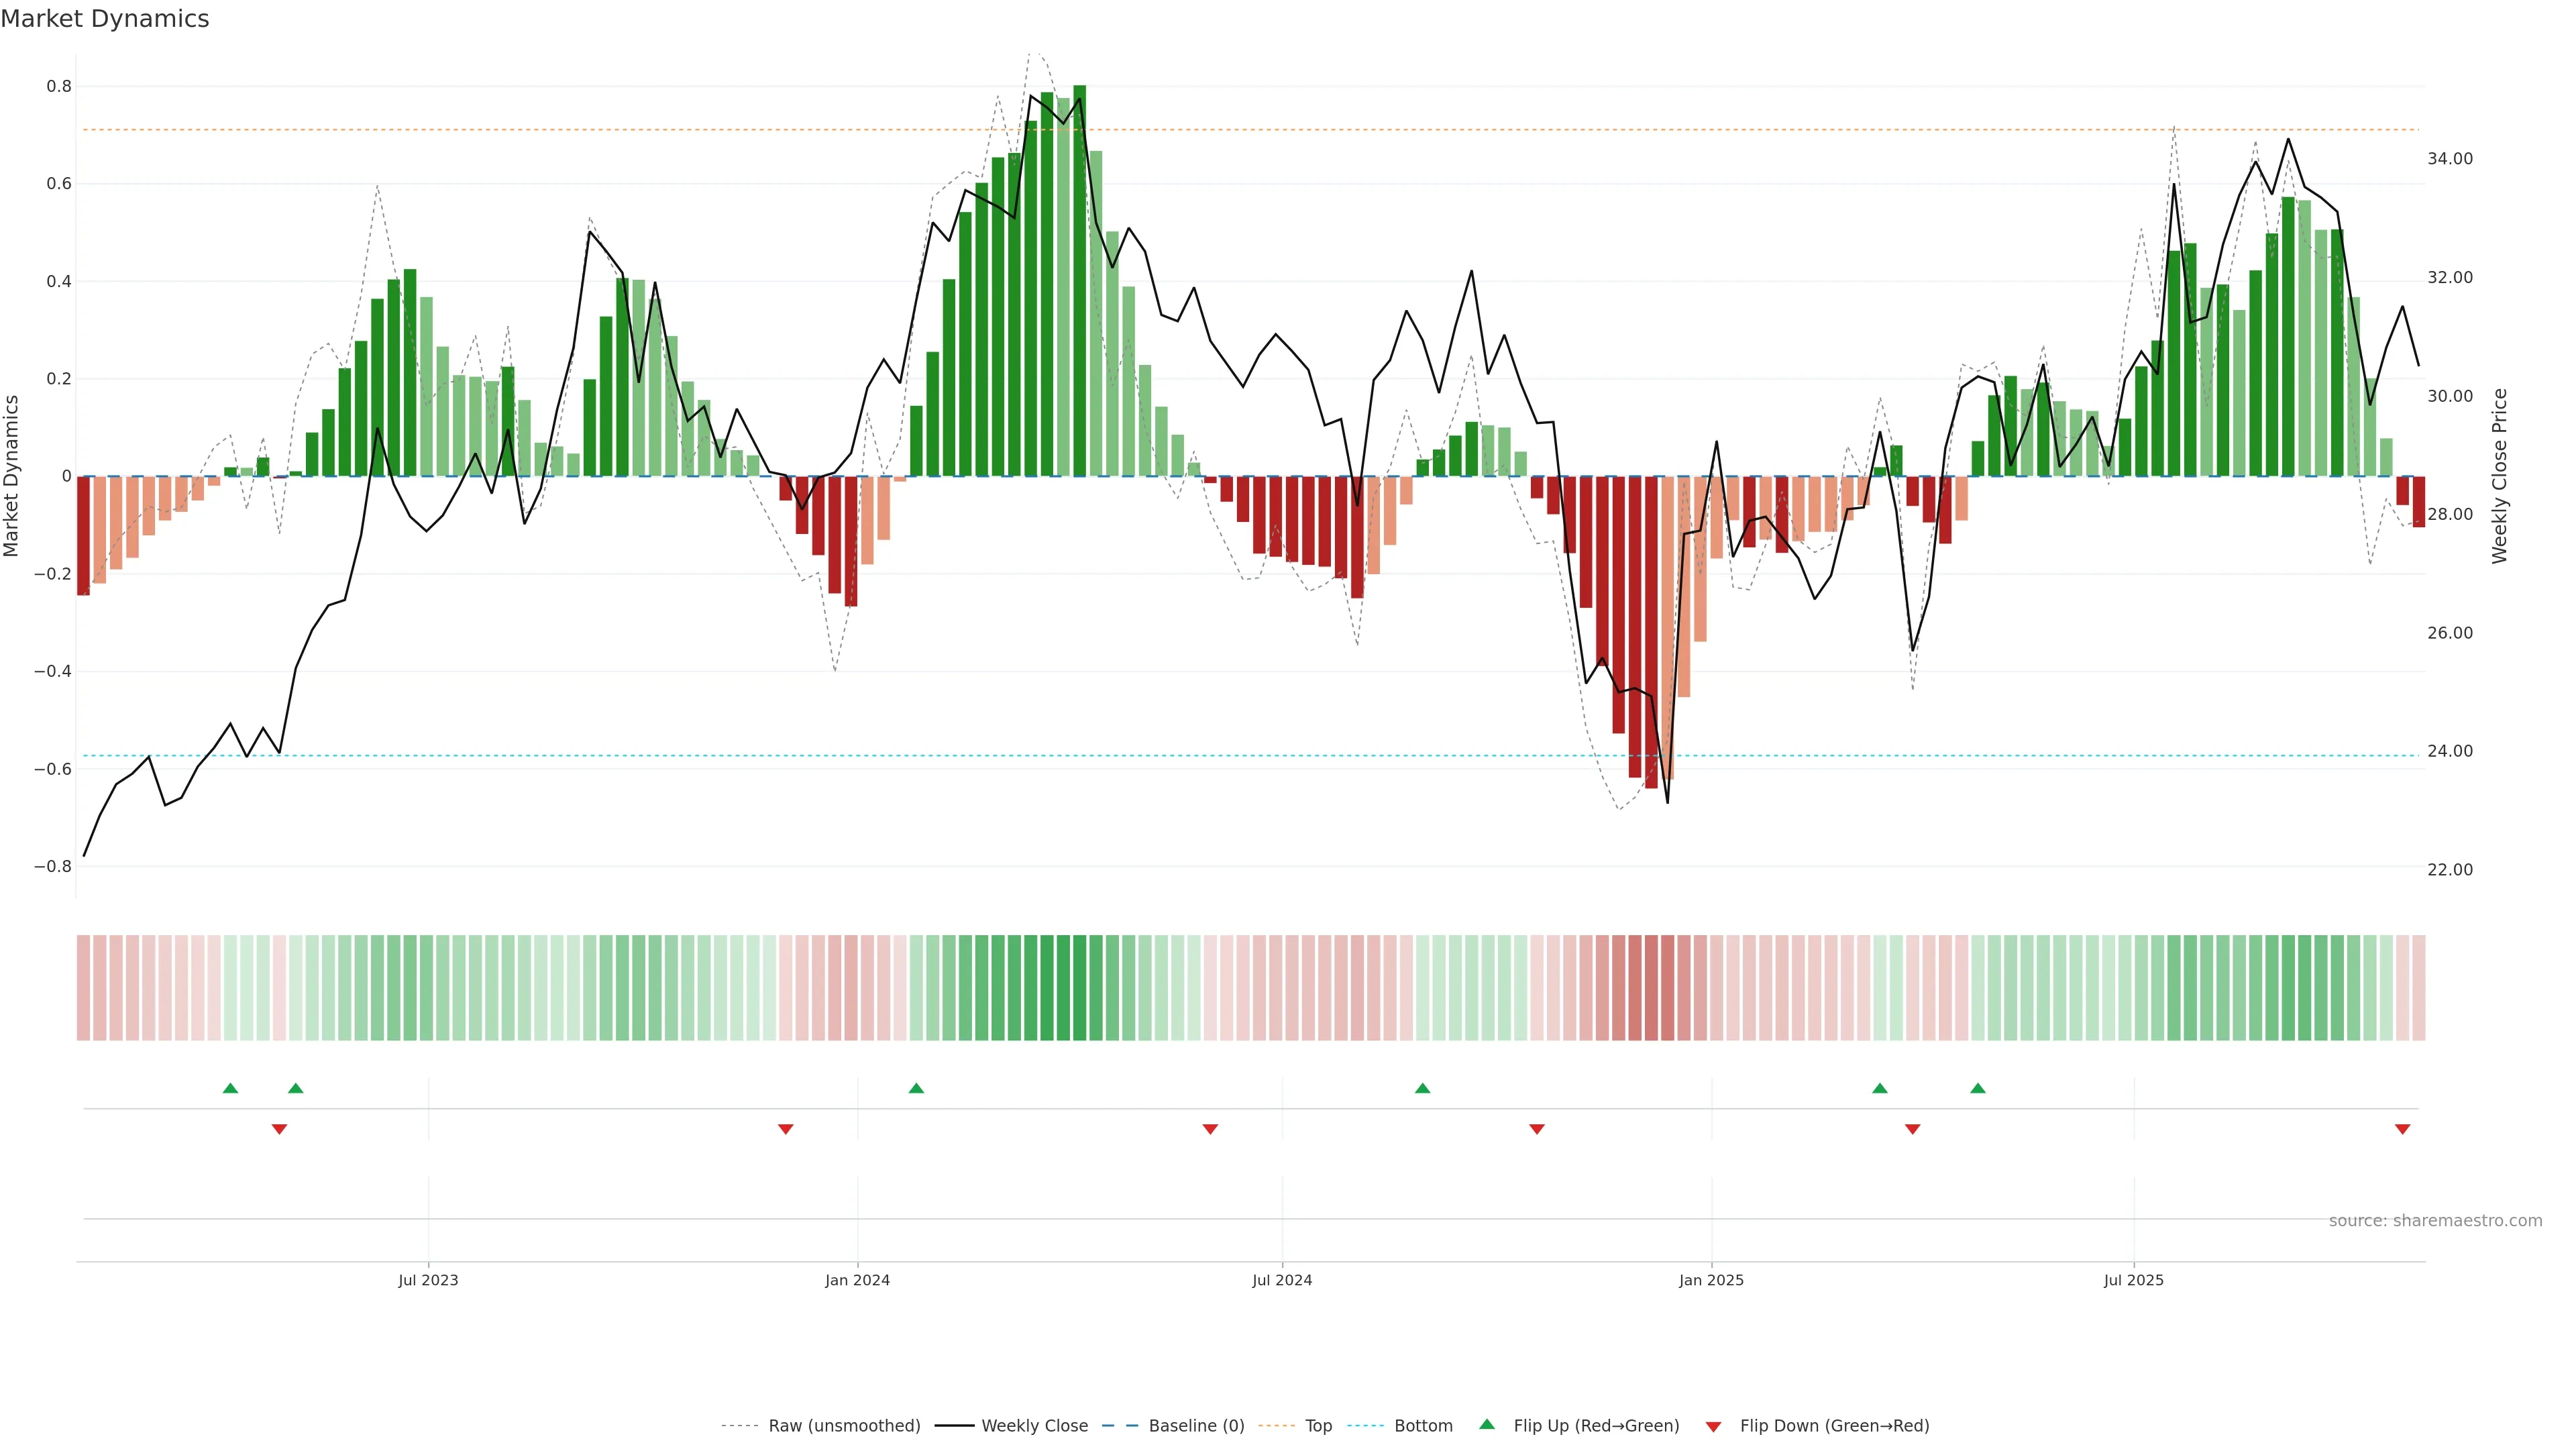
Logo
Please rotate your device

Landscape orientation recommended.

Menu

No results found.

HMC
Honda Motor Co., Ltd. – NYSE
Weekly Share Price & Valuation Overview
Market Overview
Open
33.4700
Close
33.3900
High
33.6300
Low
33.3500
Trend
0.75430

Honda Motor Co., Ltd.

Japan • NYSE - New York Stock Exchange • HMC • Currency: USD

Honda Motor Co., Ltd. develops, manufactures, and distributes motorcycles, automobiles, and power products in Japan, North America, Europe, Asia, and internationally. It operates through four segments: Motorcycle Business, Automobile Business, Financial Services Business, and Power Product and Other Businesses. The Motorcycle Business segment produces motorcycles, including sports, business, and commuter models; and various off-road vehicles, such as all-terrain vehicles and side-by-sides. The Automobile Business segment offers passenger cars, light trucks, and mini vehicles. The Financial Services Business segment provides various financial services, including retail lending and leasing services to customers, as well as wholesale financing services to dealers. The Power Product and Other Businesses manufactures and sells power products, such as general-purpose engines, lawn mowers, generators, water pumps, brush cutters, and tillers. This segment also offers HondaJet aircraft. The company also sells spare parts; and provides after-sales services through retail dealers directly, as well as through independent distributors and licensees. Honda Motor Co., Ltd. was founded in 1946 and is headquartered in Tokyo, Japan.

Scale & Structure Core size and share structure. TTM values unless noted. “Estimated” where reconciled from per-share × shares.
Market Cap Total equity value of the company (share price × shares outstanding).
USD 45.94B
Enterprise Value Operating value: market cap + total debt − cash.
USD 8.11T
Total Revenue (TTM) Sales over the last twelve months. May be estimated from revenue per share when inconsistent.
USD 21.62T
Revenue per Share (TTM) Total revenue divided by shares outstanding (may be estimated).
USD 14.37K
EPS (TTM) Earnings per share over the last twelve months (may be estimated from net income ÷ shares).
2.93
Dividend Yield Annual dividend ÷ share price. Reconciled using dividend per share when available.
4.09%
Shares Outstanding
1.33B
Float Shares
3.74B
Implied Shares Outstanding
1.67B
Profitability & Efficiency TTM basis. “Reconciled” = numerator ÷ TTM revenue. Financials: EBITDA/Gross Profit may be hidden where not meaningful. EBITDA suppressed where implausible vs revenue.
Operating Margin (TTM) Operating income ÷ revenue over the last twelve months (reconciled when possible).
4.57%
Profit Margin (TTM) Net income ÷ revenue over the last twelve months (reconciled when possible).
2.95%
ROA Return on assets: net income ÷ total assets.
1.99%
ROE Return on equity: net income ÷ shareholder equity.
5.46%
Growth Growth rates are YoY unless labeled QoQ.
Revenue Growth Year-over-year revenue growth.
-1.20%
Earnings Growth (YoY) Year-over-year earnings growth.
-42.80%
Earnings Growth (QoQ) Quarter-over-quarter earnings growth.
-50.20%
Liquidity & Solvency Balance-sheet health. Debt metrics shown as latest ratios; D/E is a ratio (not %).
Quick Ratio Liquid current assets ÷ current liabilities (ex-inventory).
0.95
Debt to Equity Total debt ÷ shareholder equity; leverage.
0.98
Total Cash Cash and equivalents.
USD 4.17T
Total Debt Short + long-term interest-bearing debt.
USD 11.87T
Net Debt Total debt − cash (negative = net cash).
USD 7.70T
Sharemaestro House View
Risk: 1 Sharemaestro internal risk profile (0–3, higher is safer). Operational: 2 Operational quality/consistency (0–3, higher is better). Composite Score: 1 Overall internal composite (0–3, higher is better). Suggested Allocation: 1.67% Indicative portfolio weighting suggestion based on house view.
Structural Insights (experimental)
Ownership & Liquidity
Free Float Proportion of shares available for public trading.
Insiders Shares held by company insiders (officers, directors).
Institutions Shares held by institutions (funds, pensions). 3.7%
Capital Structure
Potential Dilution Increase in share count if options/convertibles exercise.
25.5%
Net Debt Total debt − cash (negative = net cash).
USD 7.70T
35.6% of revenue Net debt relative to revenue — debt load vs business scale.
Resilience Score 0–100 composite of liquidity, leverage and cash conversion; higher is better. If inputs are unavailable, we estimate using proxies (Net debt vs revenue, Cash-to-Debt). It is a guide, not a rating. 60
Methodology Notes
  • EBITDA & EBITDA margin suppressed (implausible vs revenue or not meaningful for financials).
  • Gross Profit hidden for financial institutions (often redundant with revenue).
As of: 2025-08-21 20:11

Disclaimer: Information is compiled from publicly available sources and is subject to errors and omissions. It is provided as a guide only and does not constitute investment advice. Please do your own research.