Zhangzhou Pientzehuang Pharmaceutical., Ltd
600436 SHA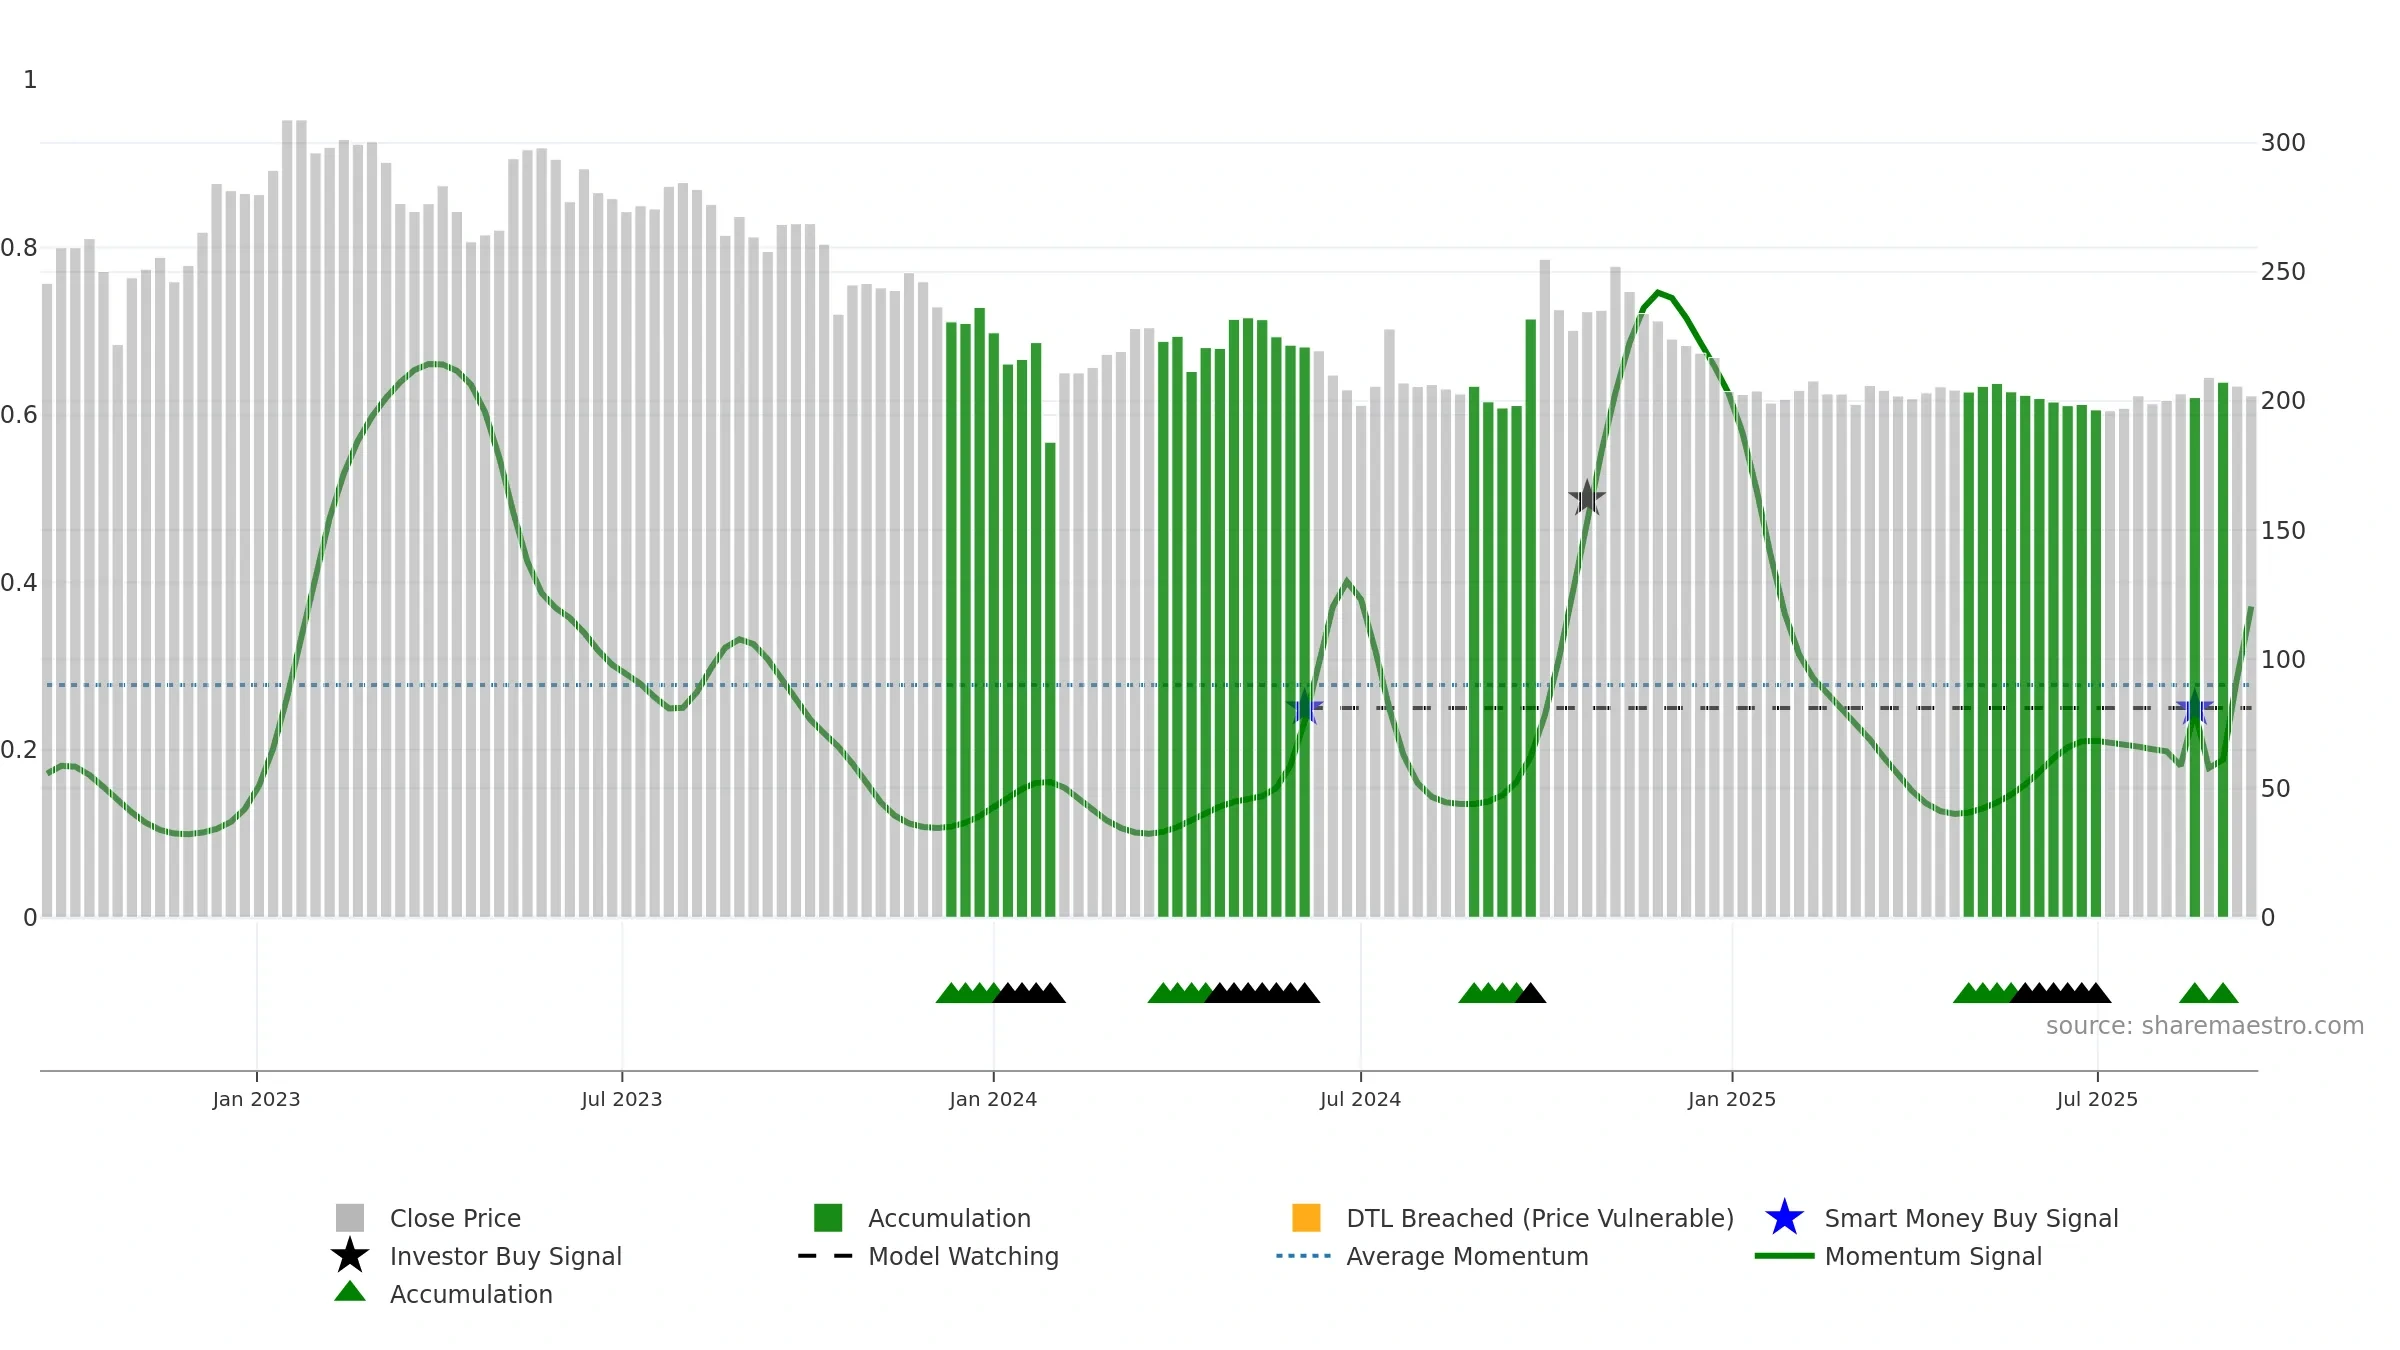
Weekly Report
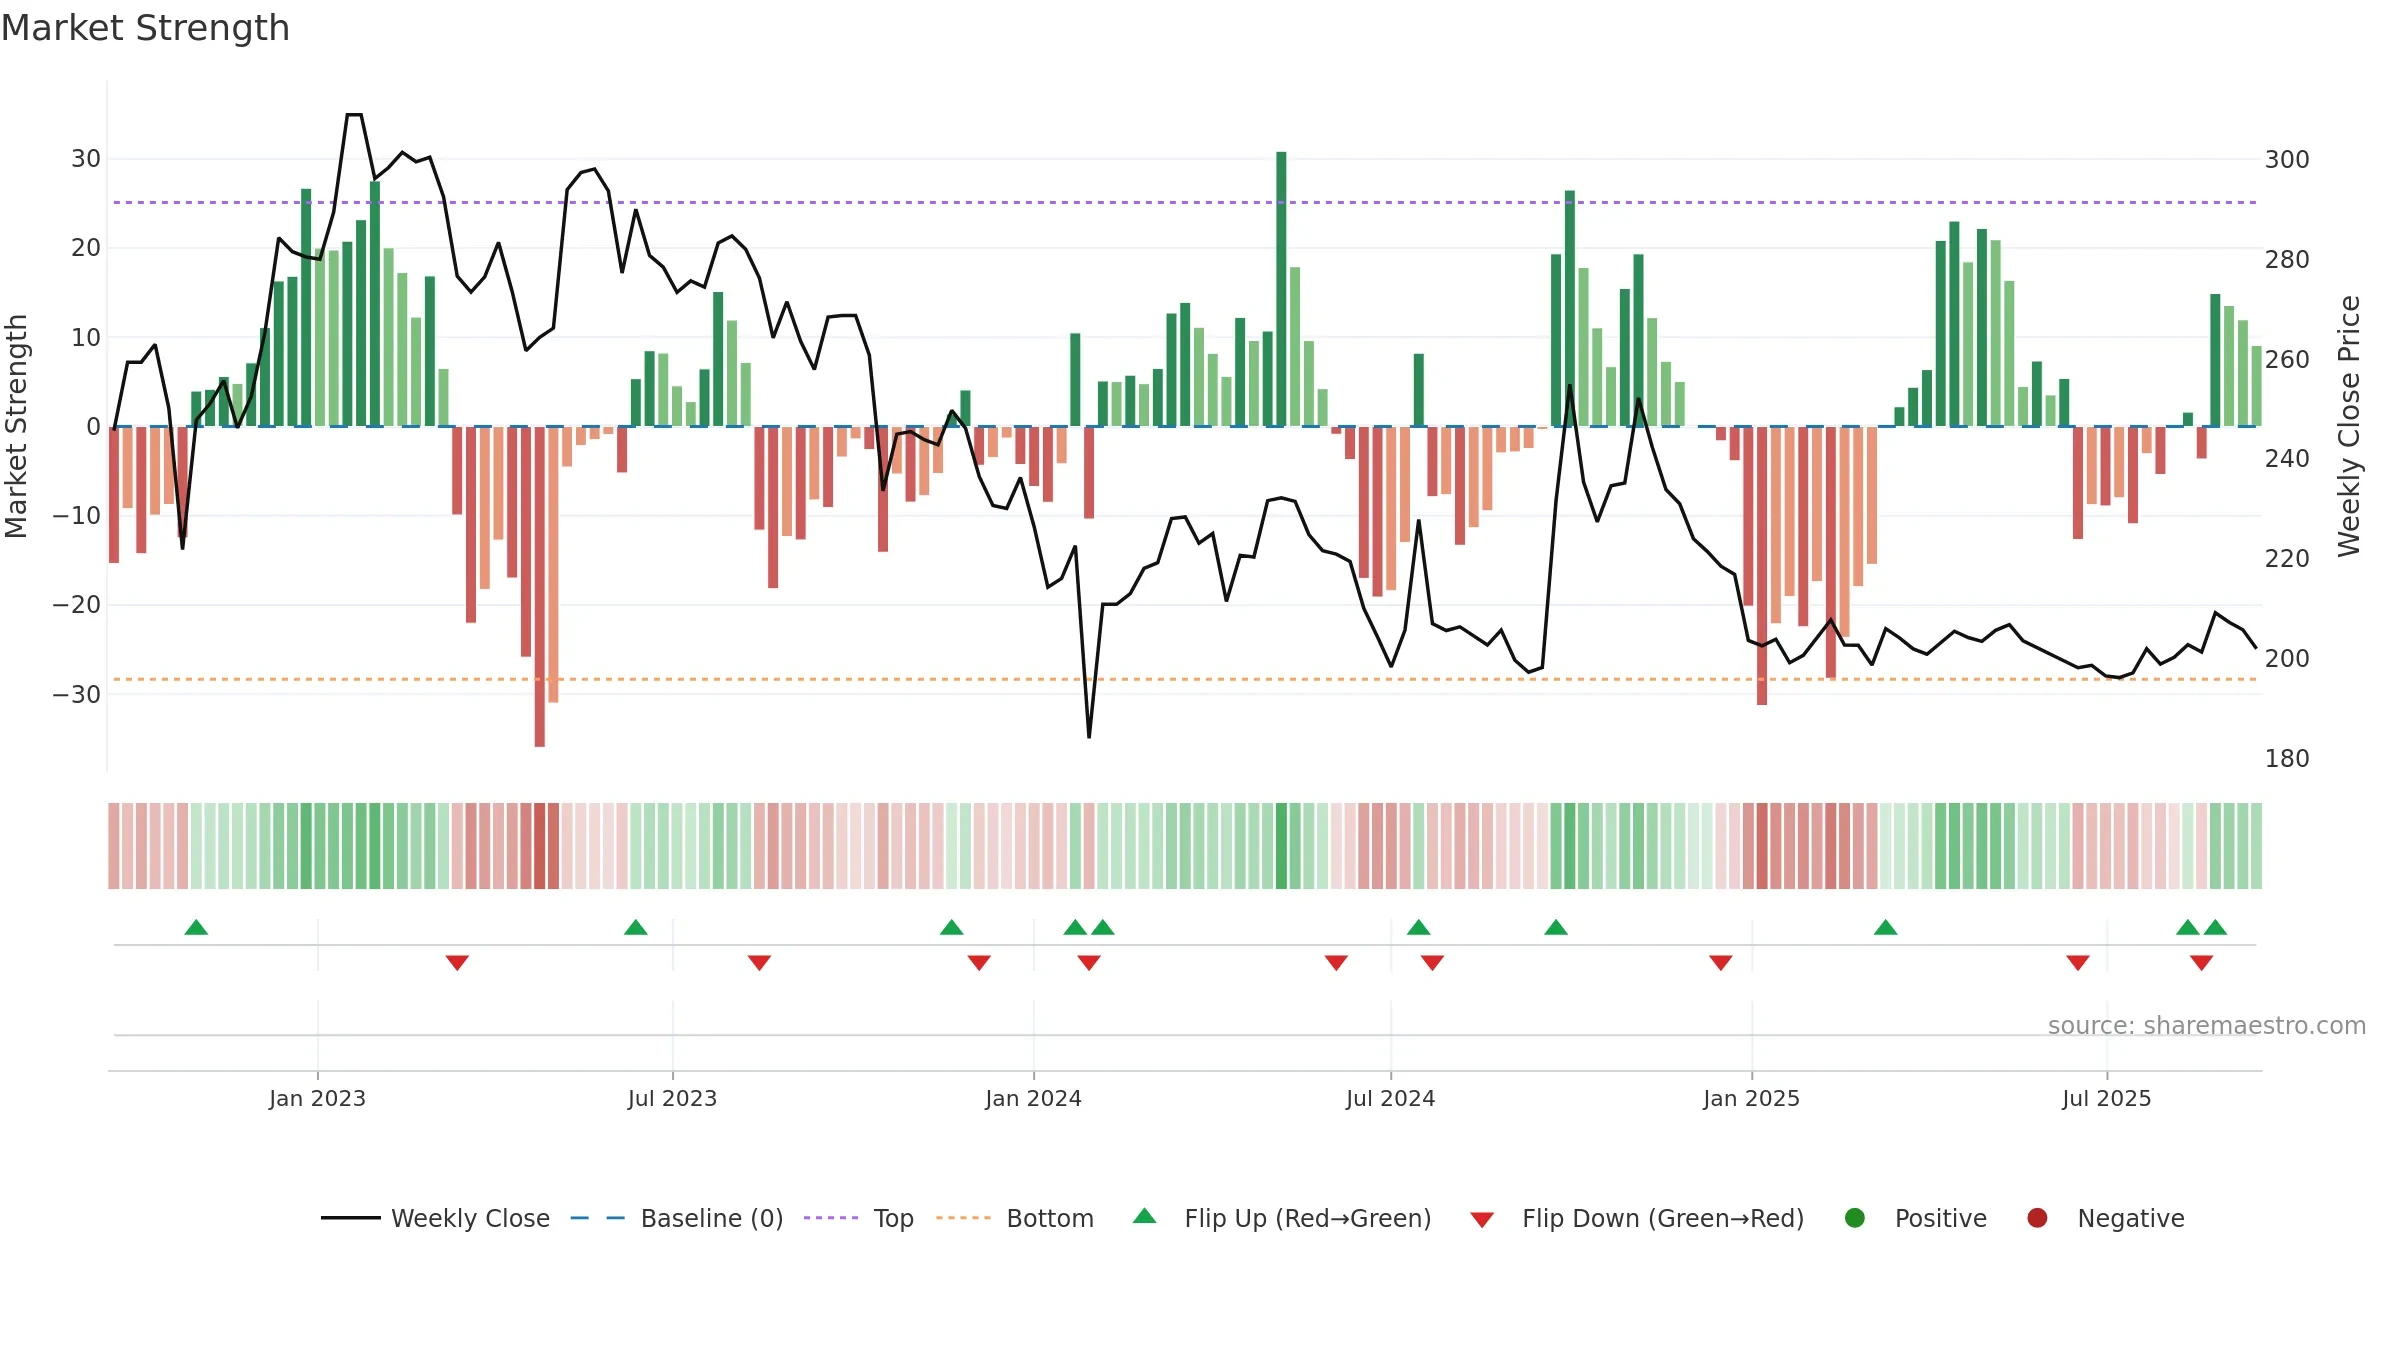
Zhangzhou Pientzehuang Pharmaceutical., Ltd closed at 202.0200 (-0.48% WoW) . Data window ends Mon, 15 Sep 2025.
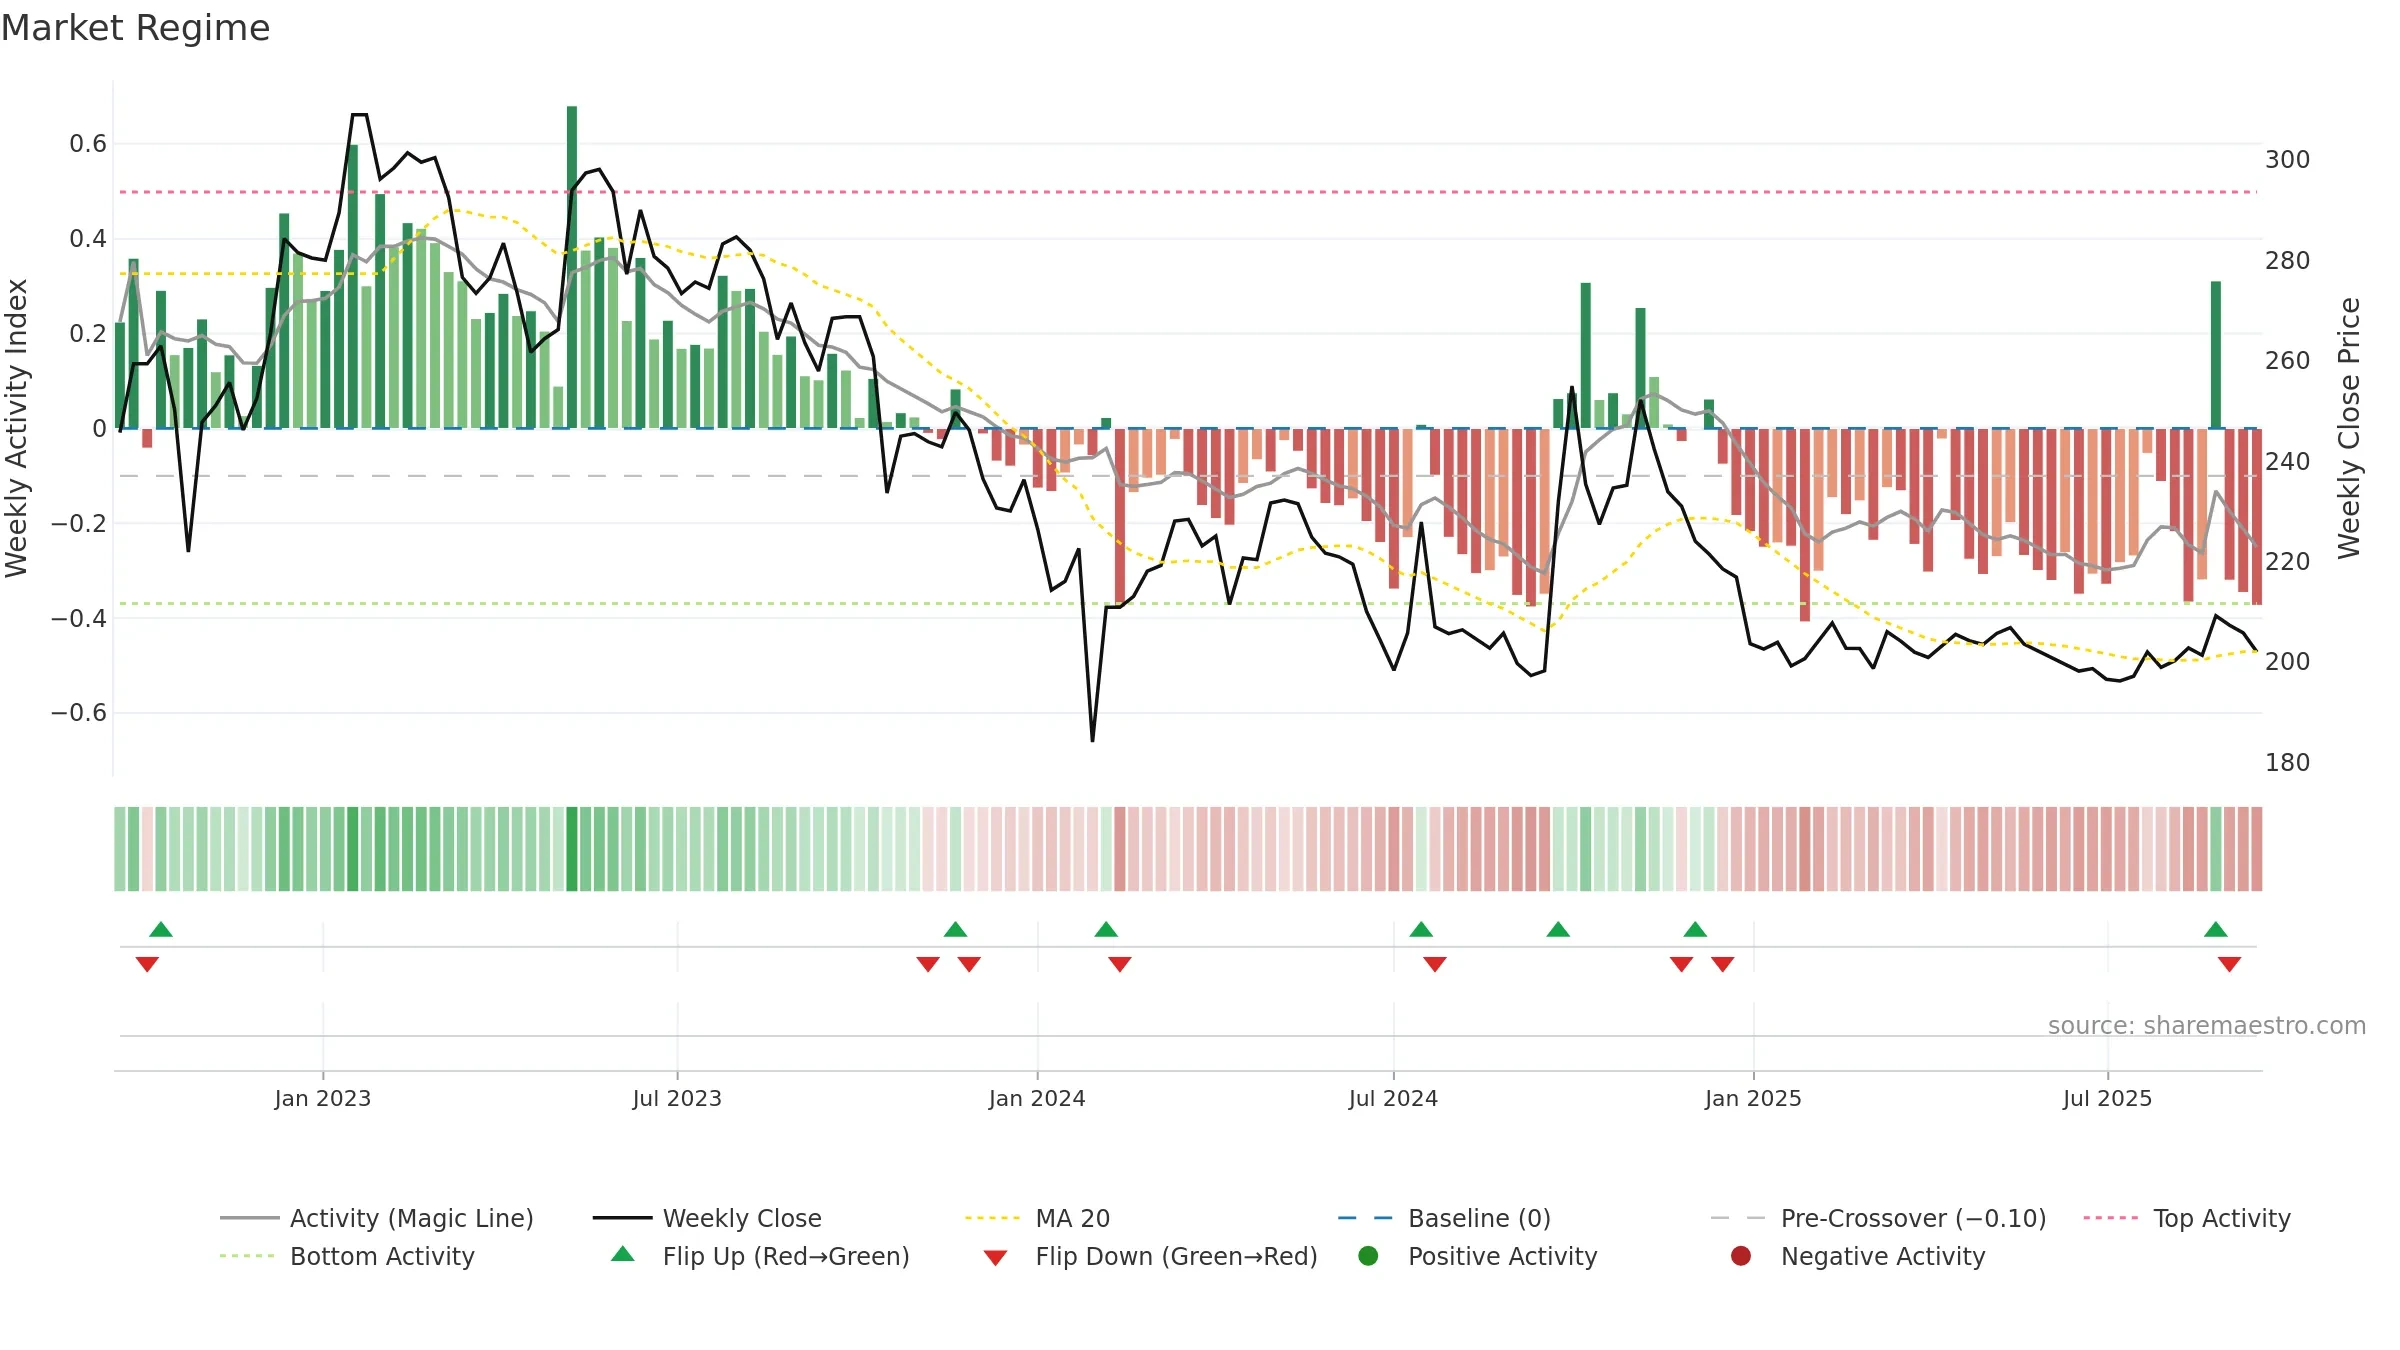
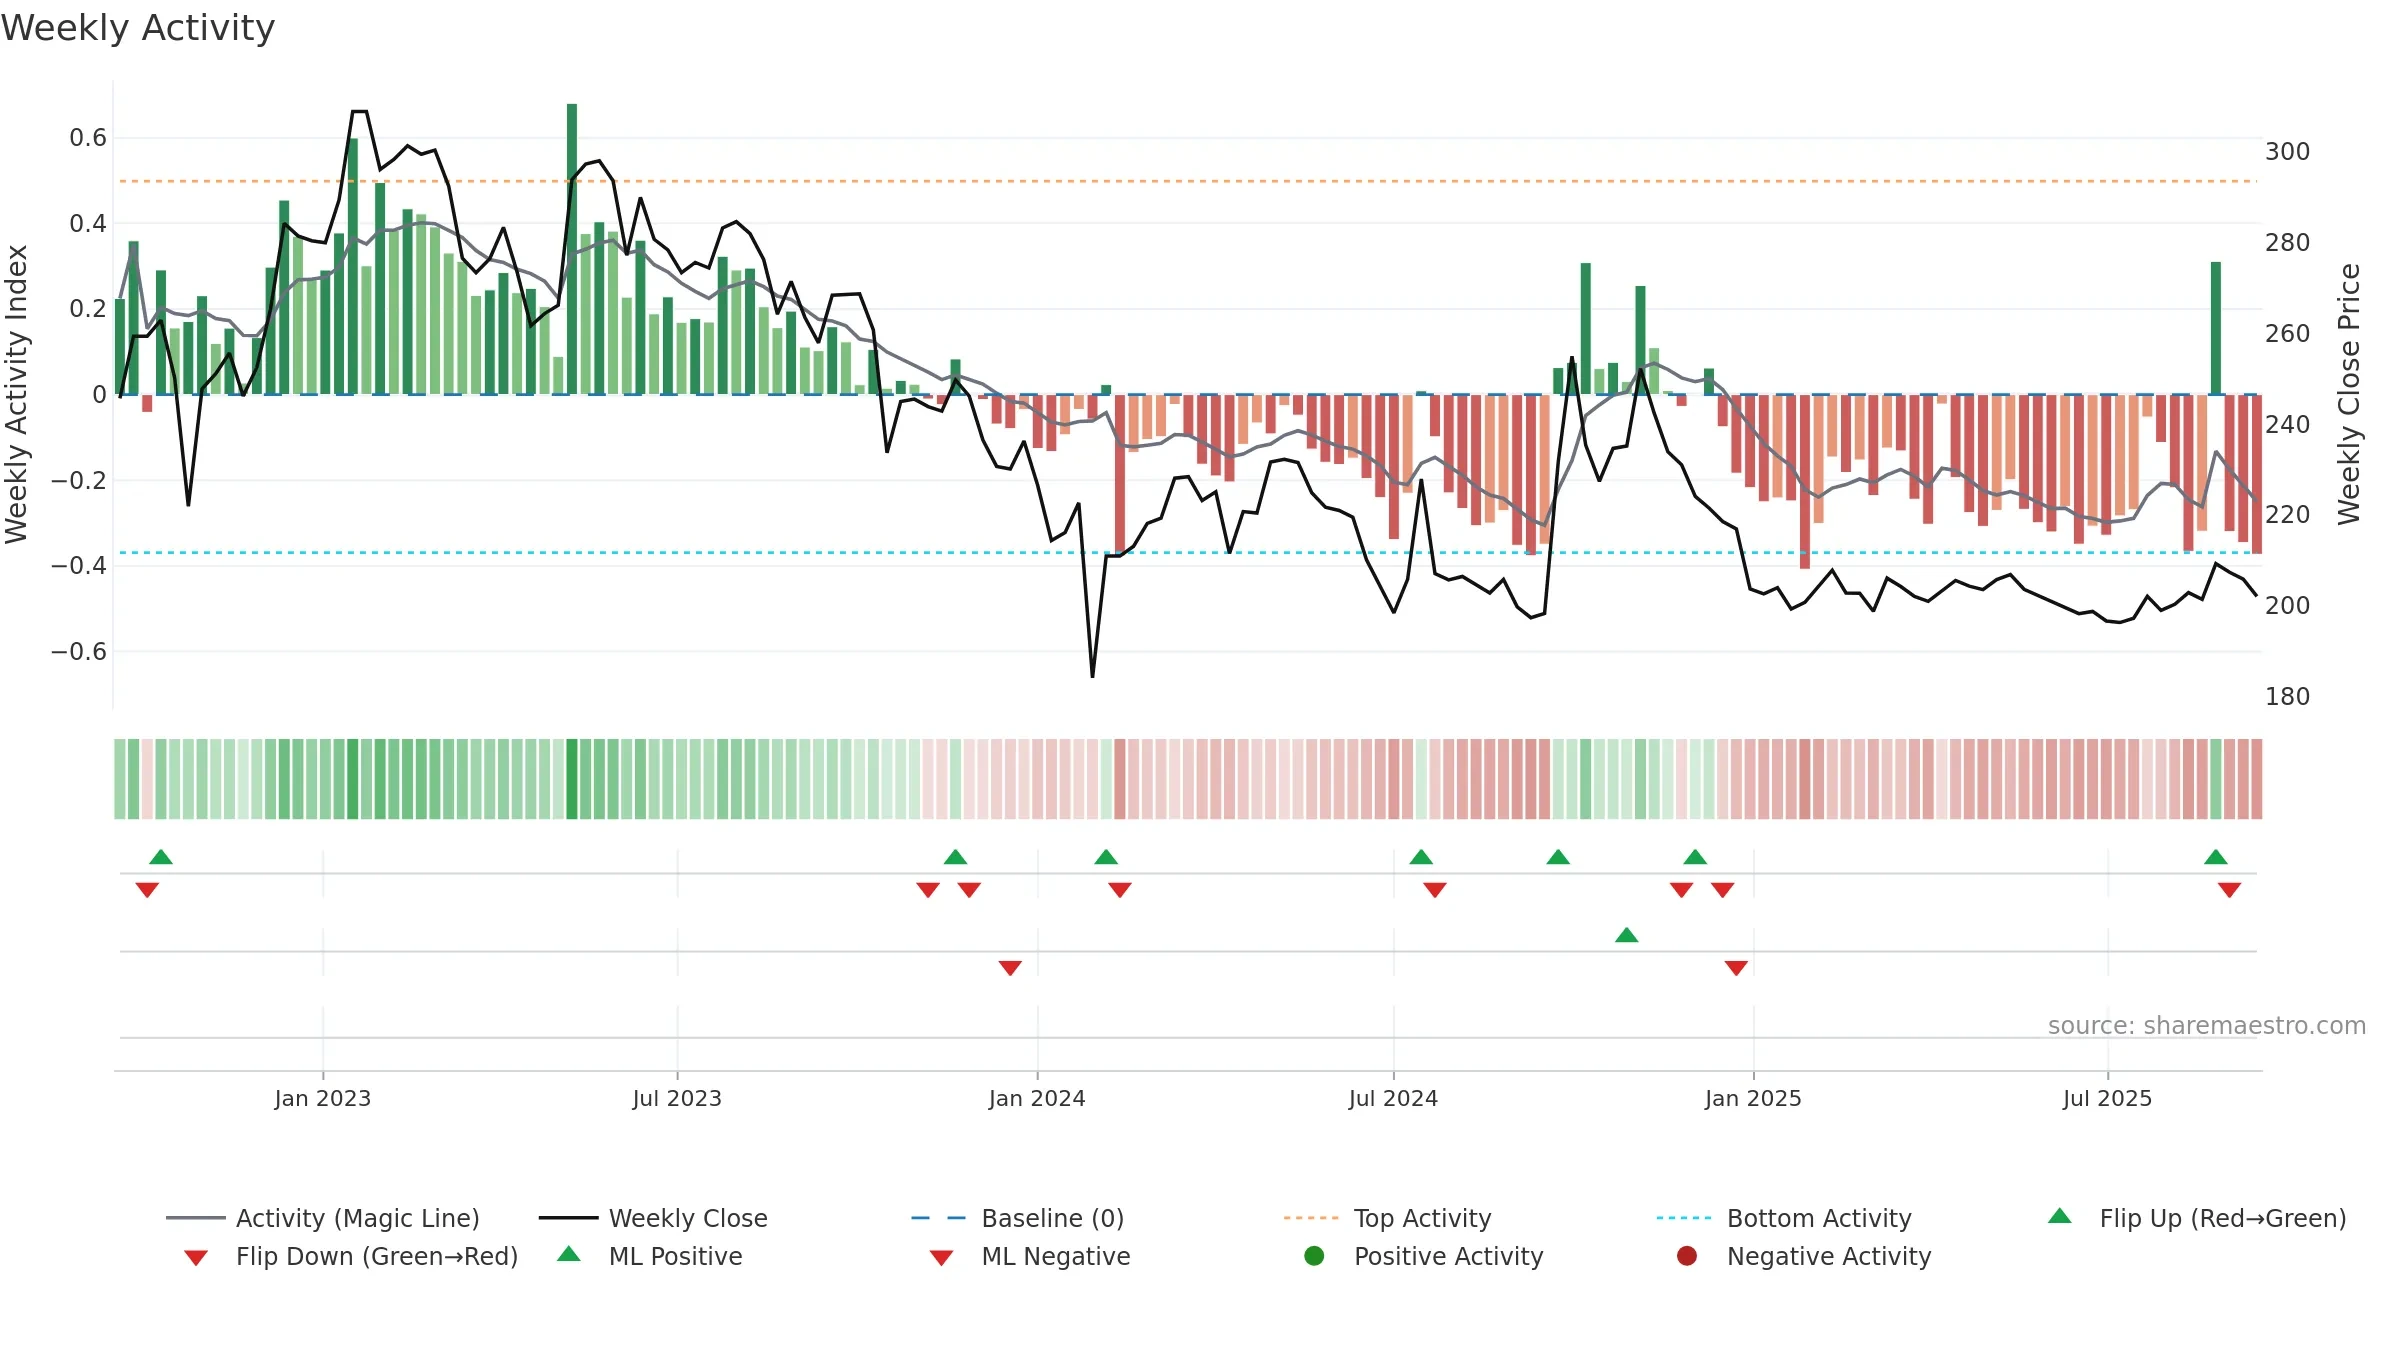
How to read this — Price slope is upward, indicating persistent buying over the window. Low weekly volatility favours steadier follow-through. Volume trend diverges from price — watch for fatigue or rotation. Returns are negatively correlated with volume — strength may come on lighter activity. Price sits below key averages, keeping pressure on the tape.
Up-slope supports buying interest; pullbacks may be contained if activity stays firm. Because liquidity isn’t confirming, prefer evidence of fresh demand before chasing moves.
Gauge maps the trend signal to a 0–100 scale.
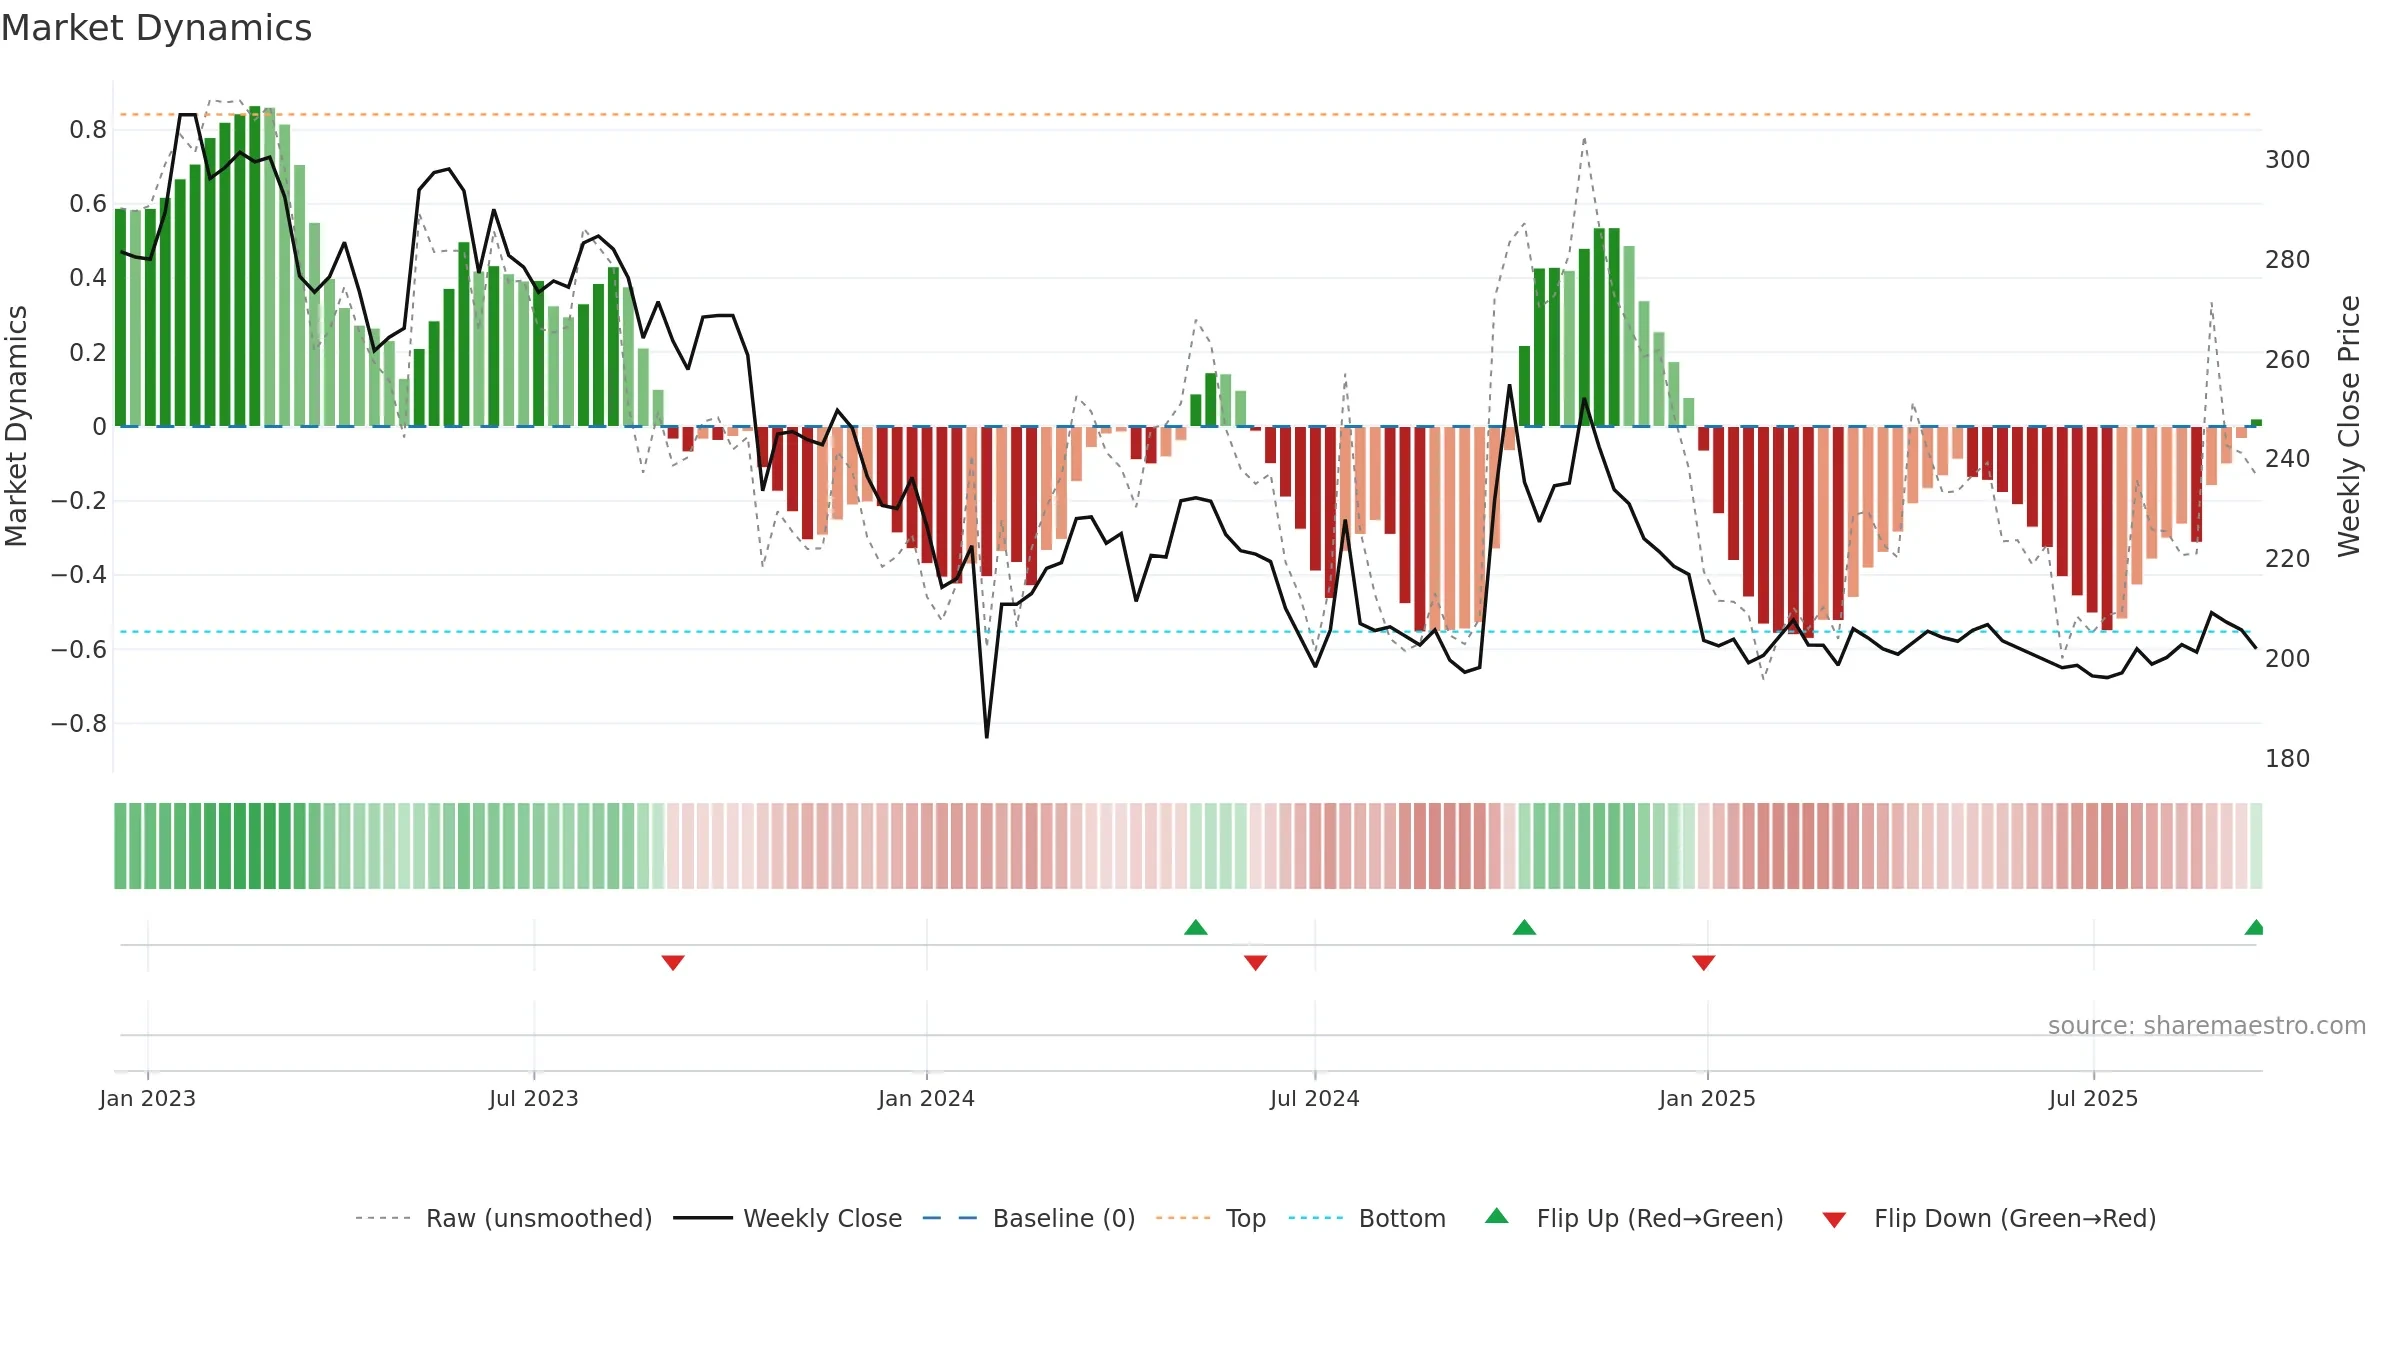
How to read this — Bearish backdrop but short-term momentum is improving; confirmation still needed.
Early improvement — look for a reclaim of 0.50→0.60 to validate.
Price is above fair value; upside may be capped without catalysts.
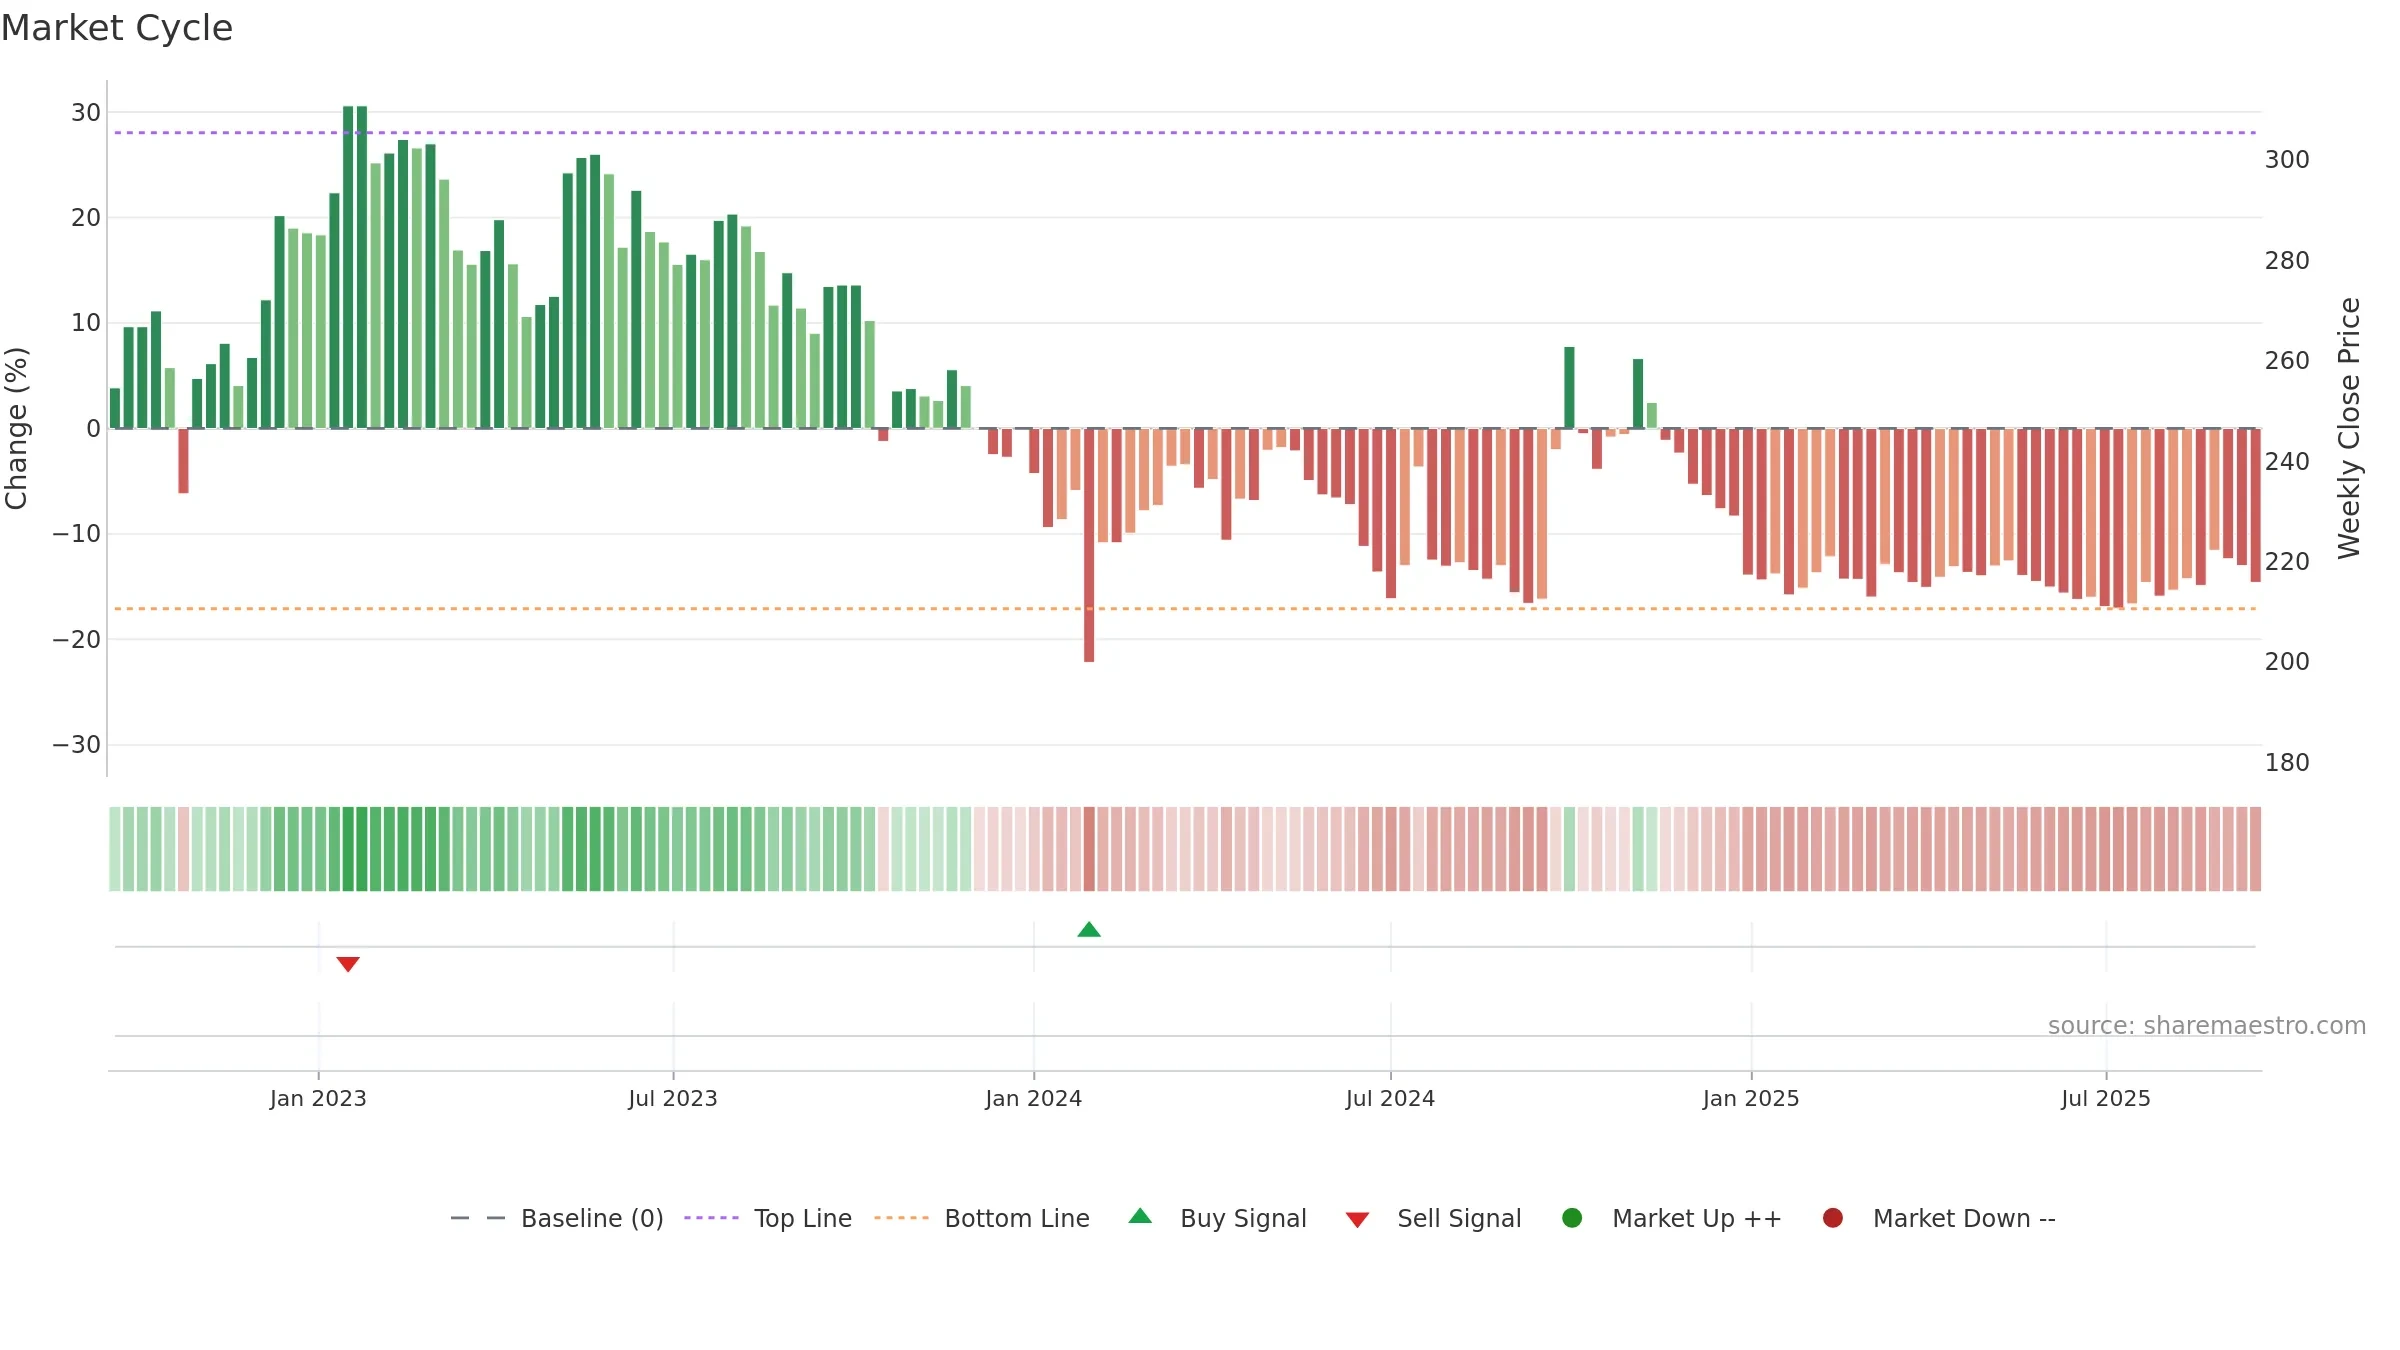
Conclusion
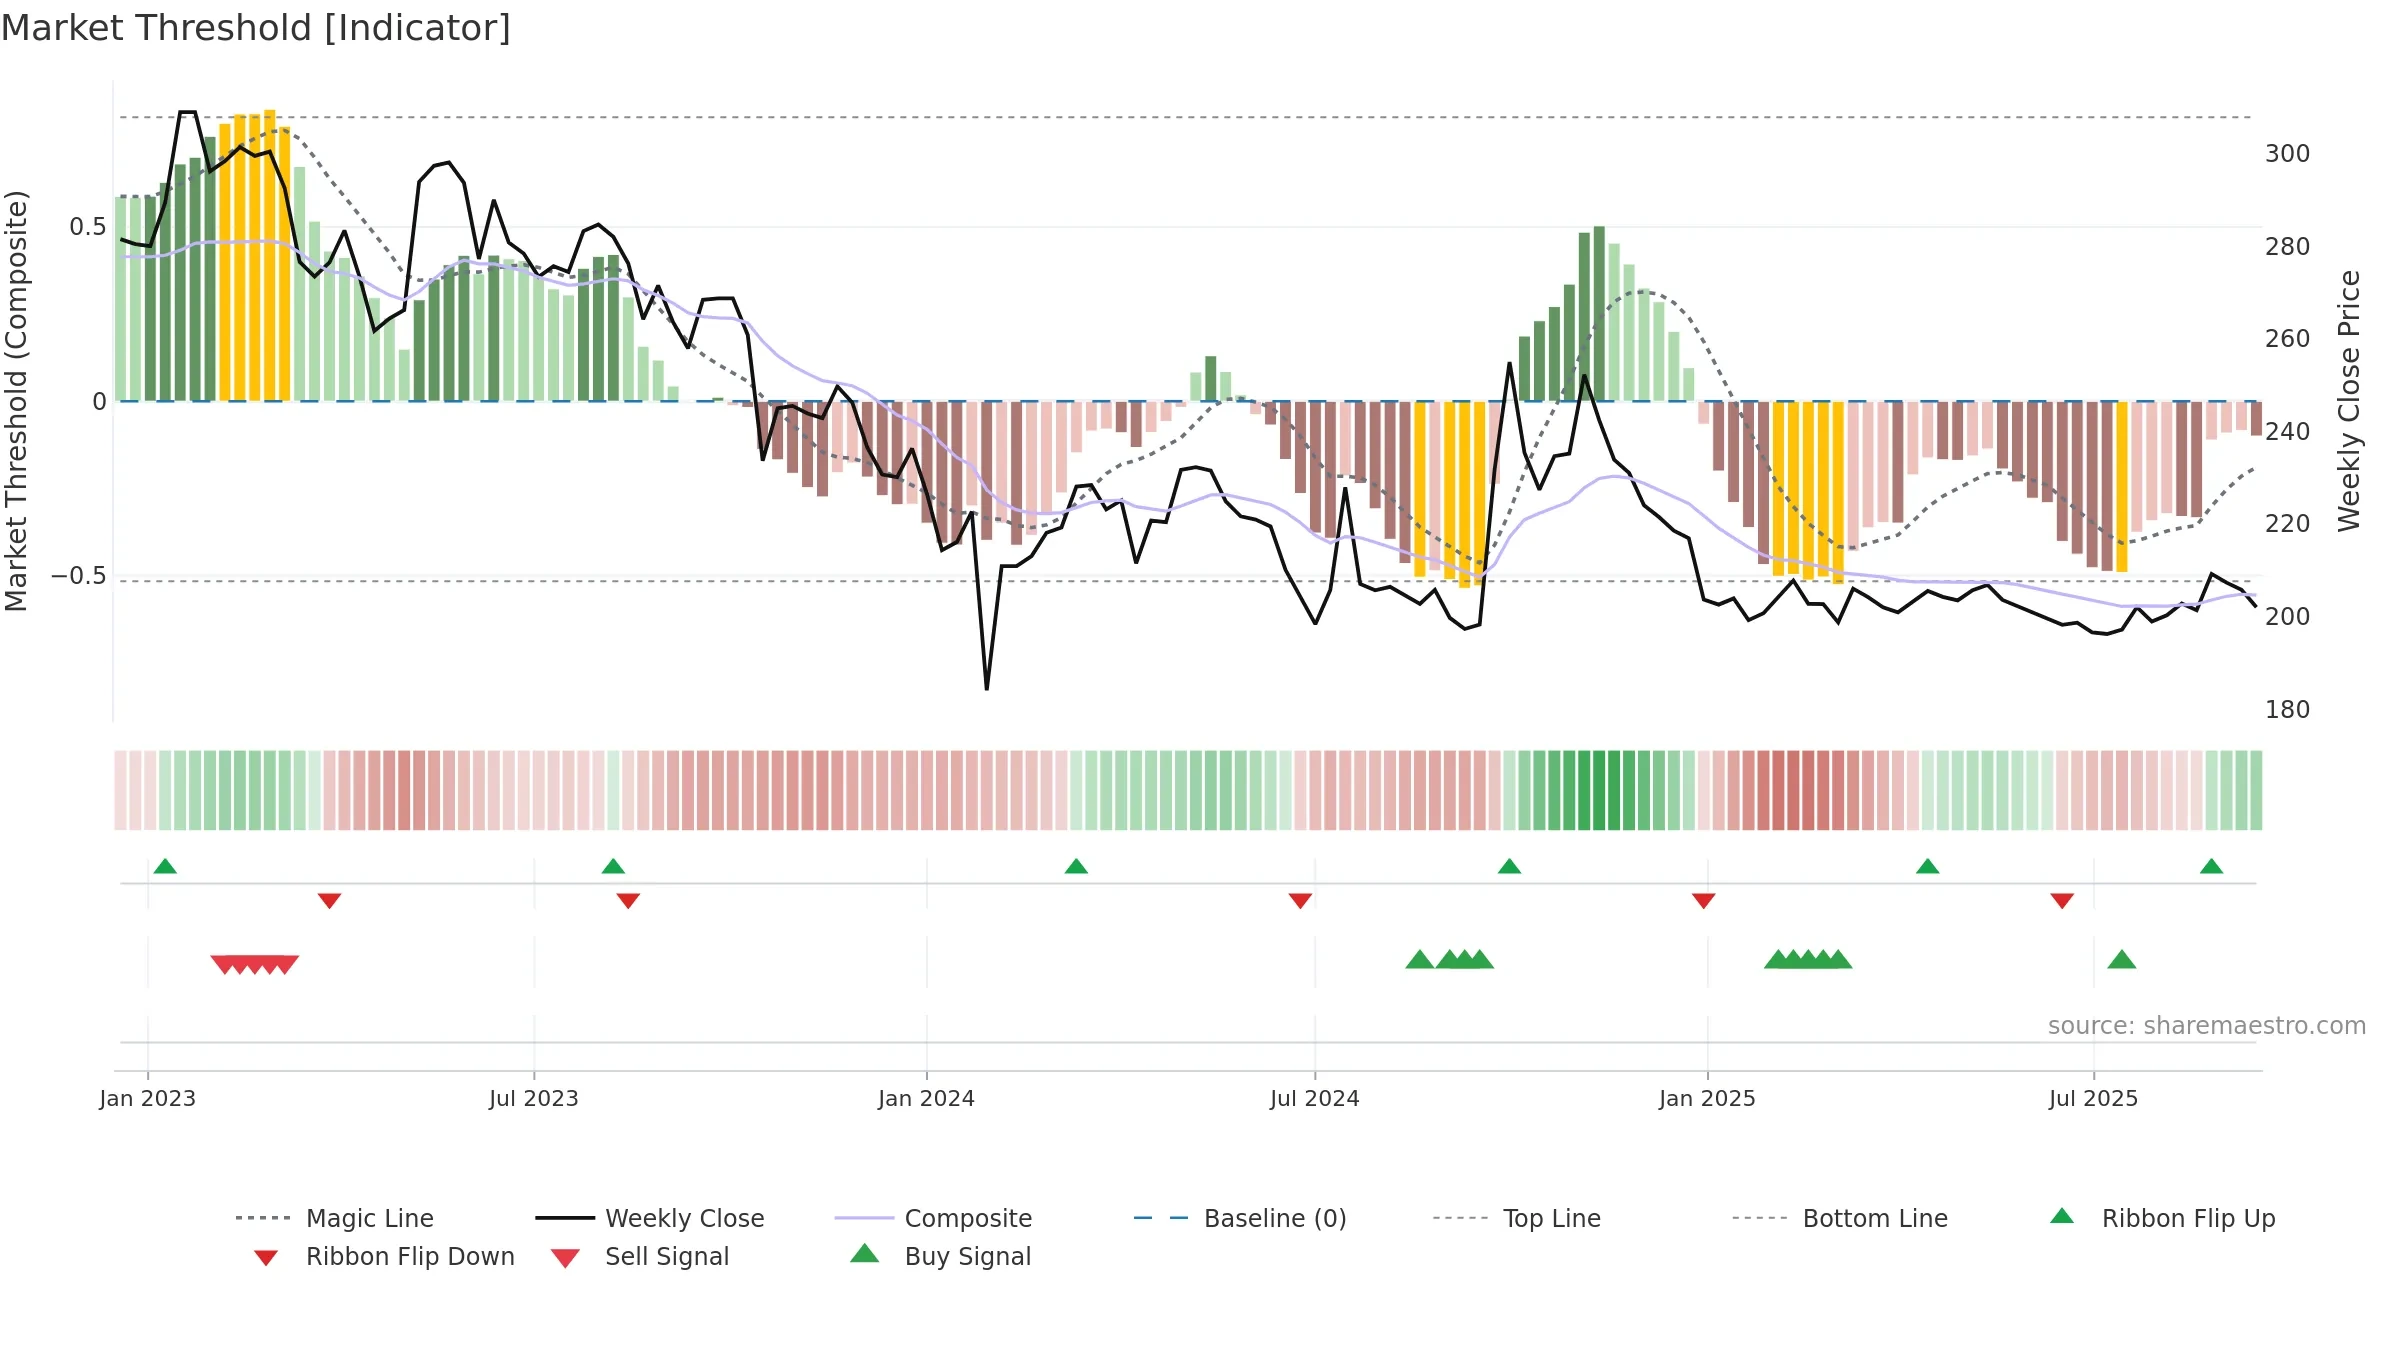
Neutral setup. ★★★☆☆ confidence. Price window: 1. Trend: Bottoming Attempt; gauge 37. In combination, liquidity diverges from price.
- Early improvement from bearish zone (bottoming attempt)
- Low return volatility supports durability
- Price is not above key averages
- Liquidity diverges from price
Why: Price window 1.55% over 8w. Close is -3.44% below the prior-window high. Return volatility 0.81%. Volume trend falling. Liquidity divergence with price. Trend state bottoming attempt. Low-regime (≤0.25) upticks 3/6 (50.0%) • Distributing. Momentum neutral and rising. Valuation limited upside without catalysts.
Tip: Most metrics include a hover tooltip where they appear in the report.