Okta, Inc.
OKTA NASDAQ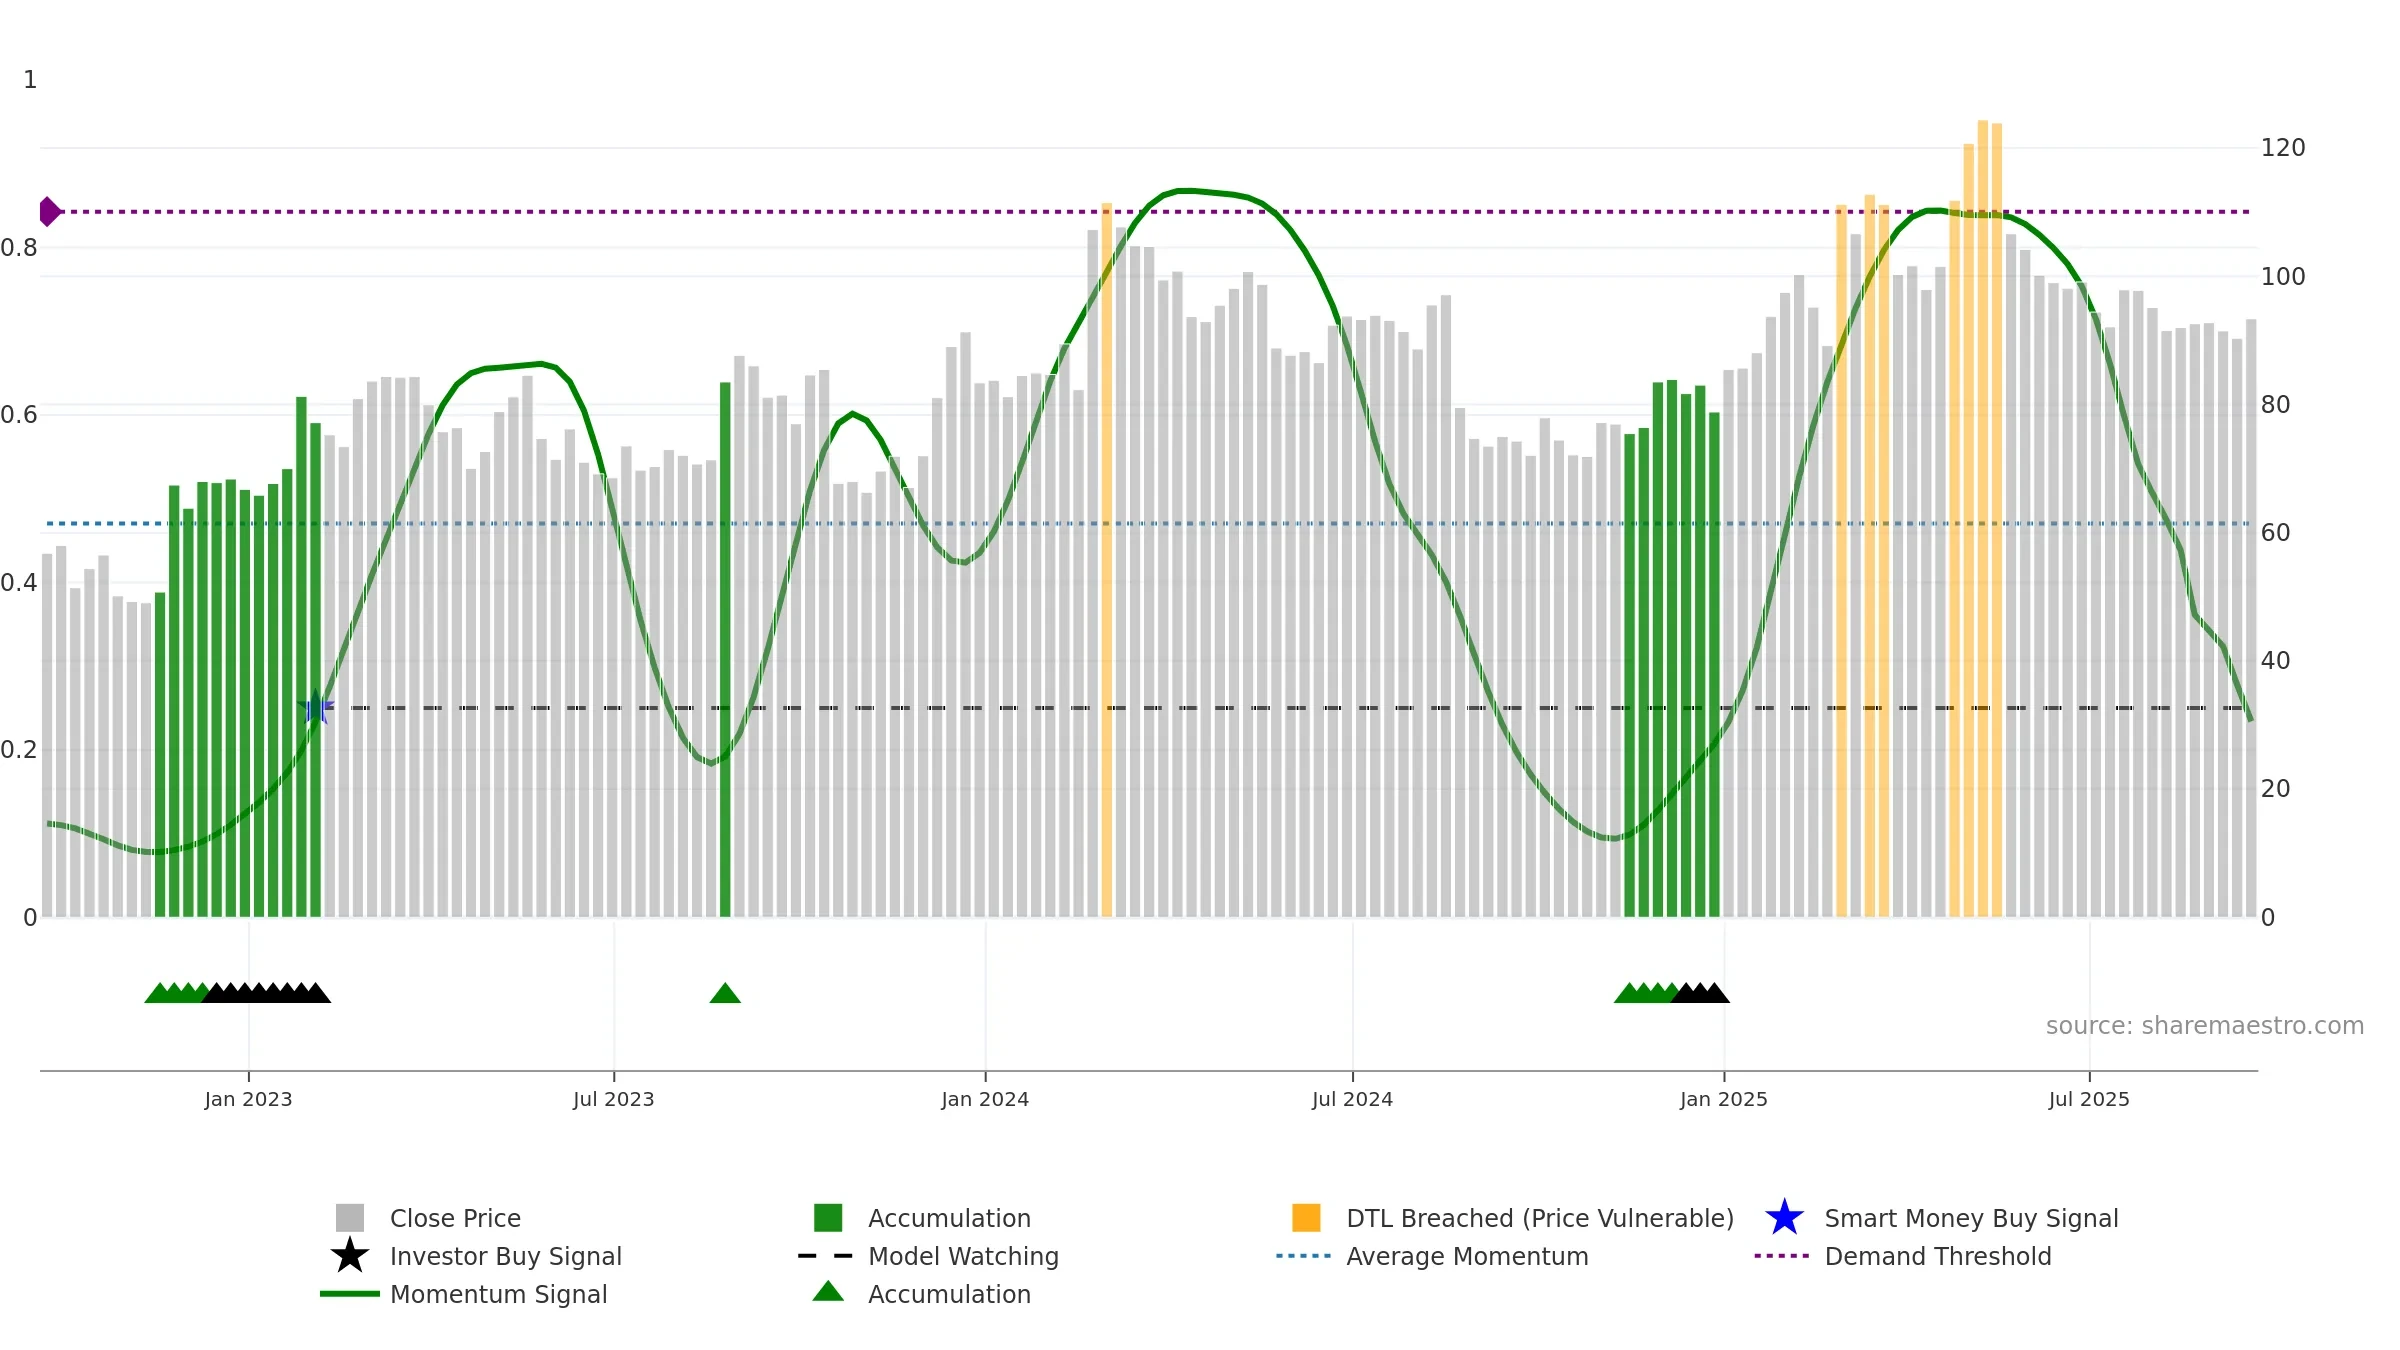
Weekly Report
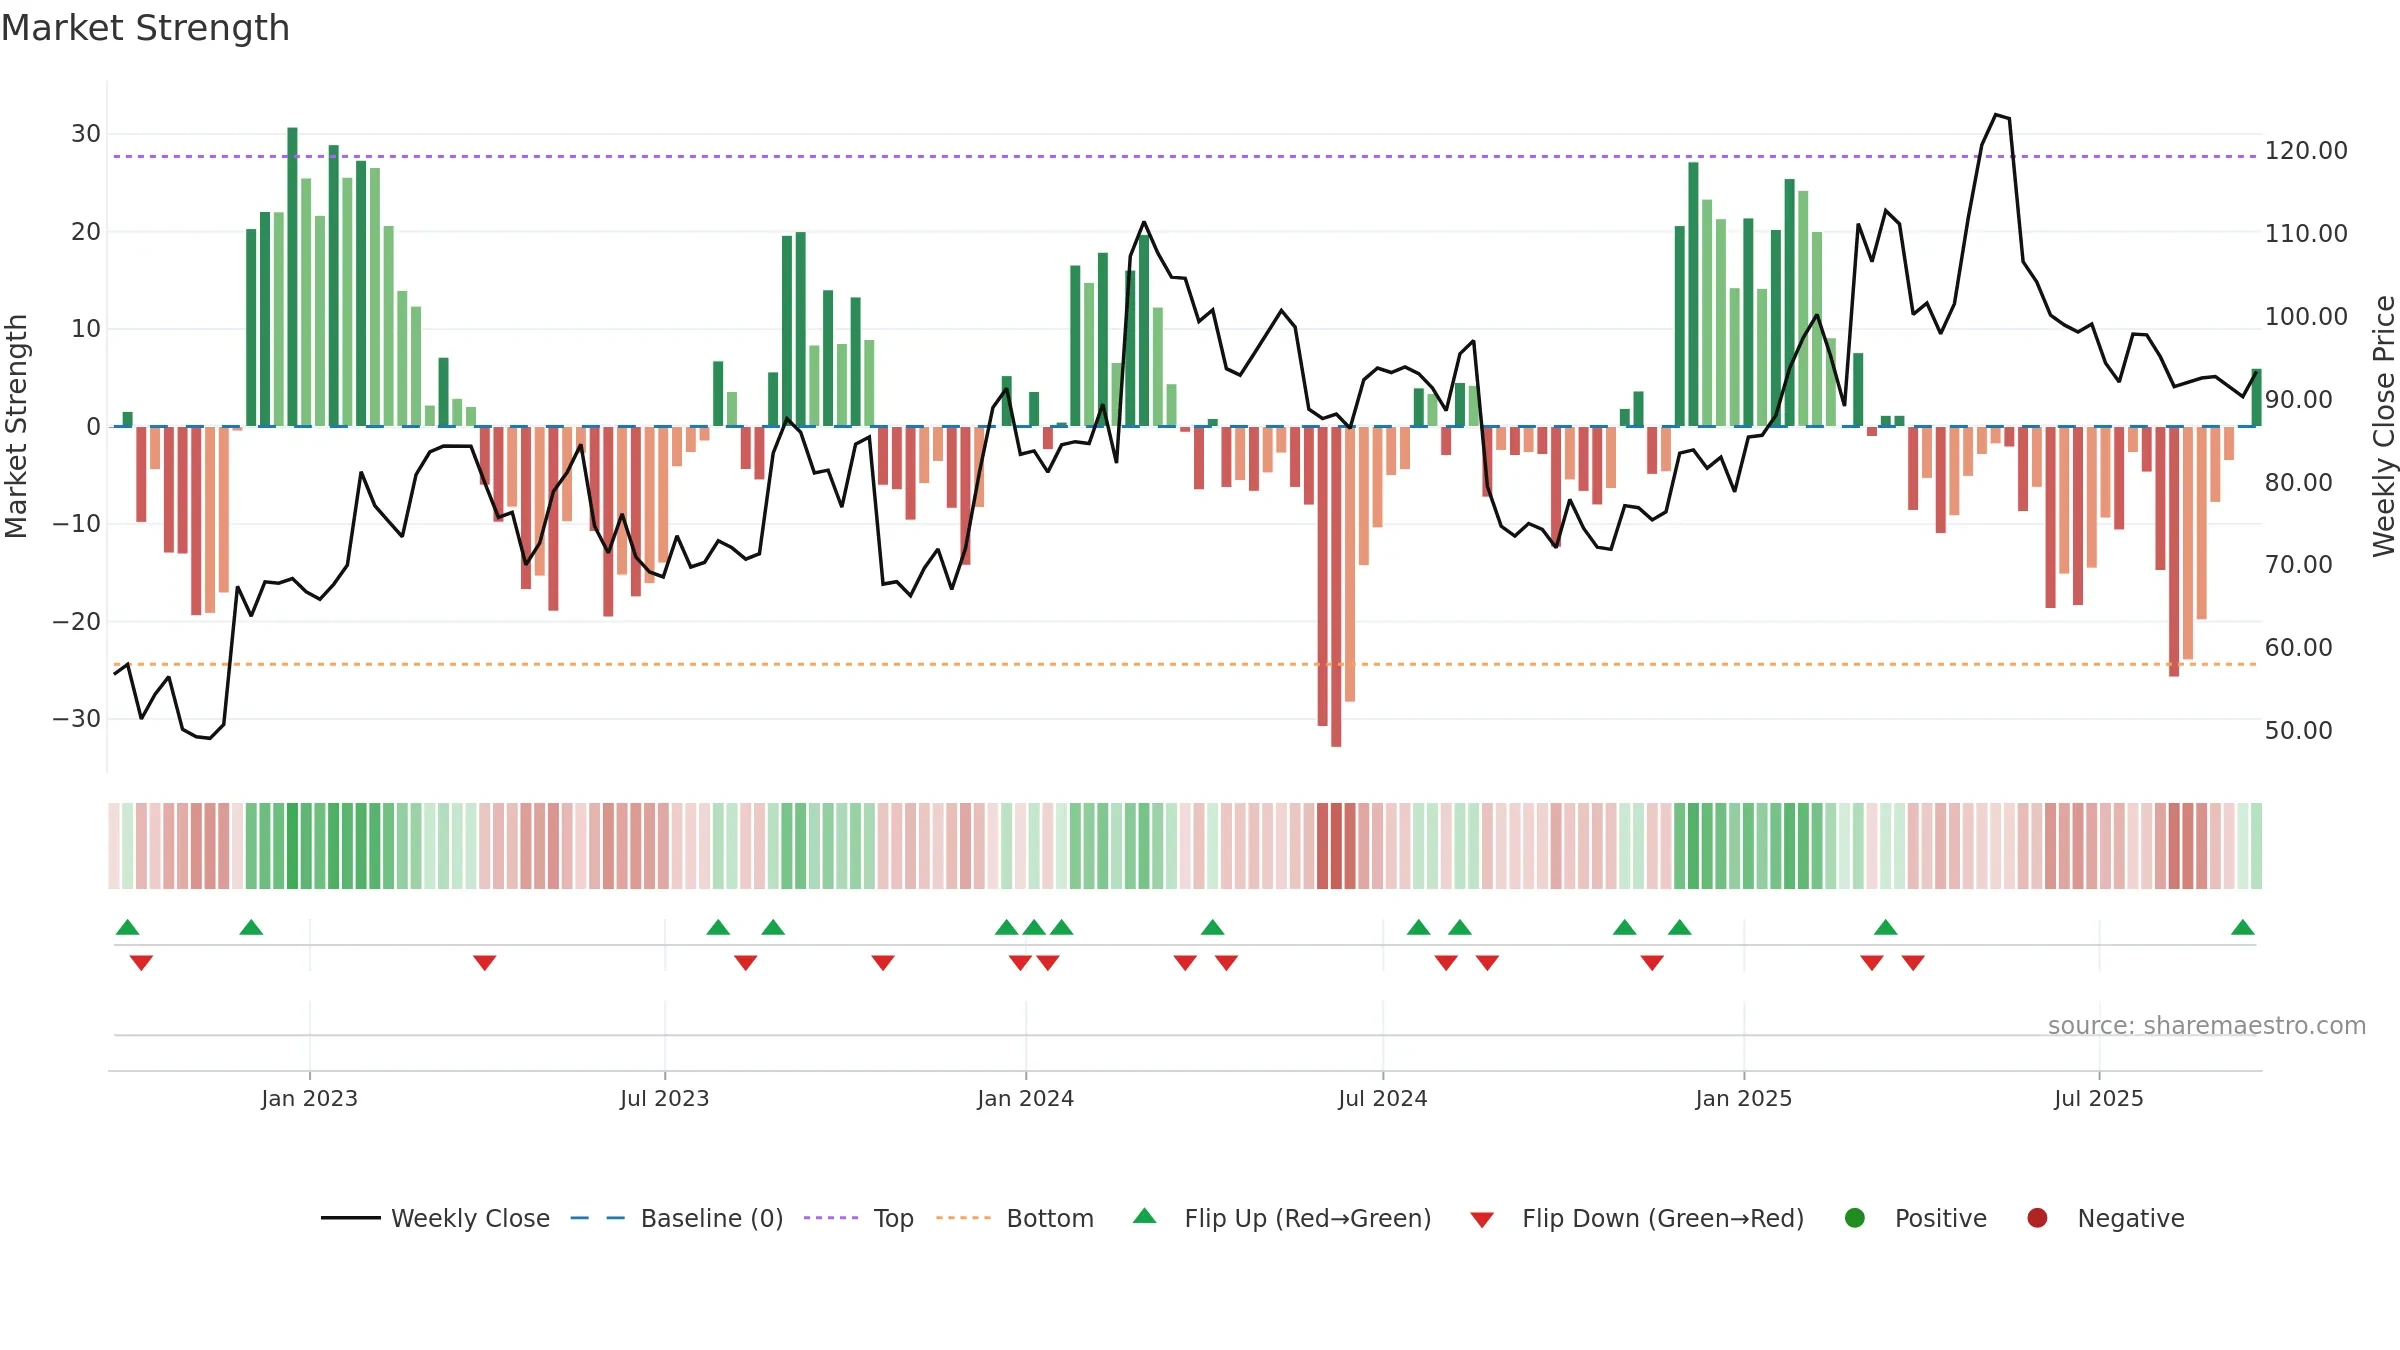
Okta, Inc. closed at 93.3700 (-0.67% WoW) . Data window ends Fri, 19 Sep 2025.
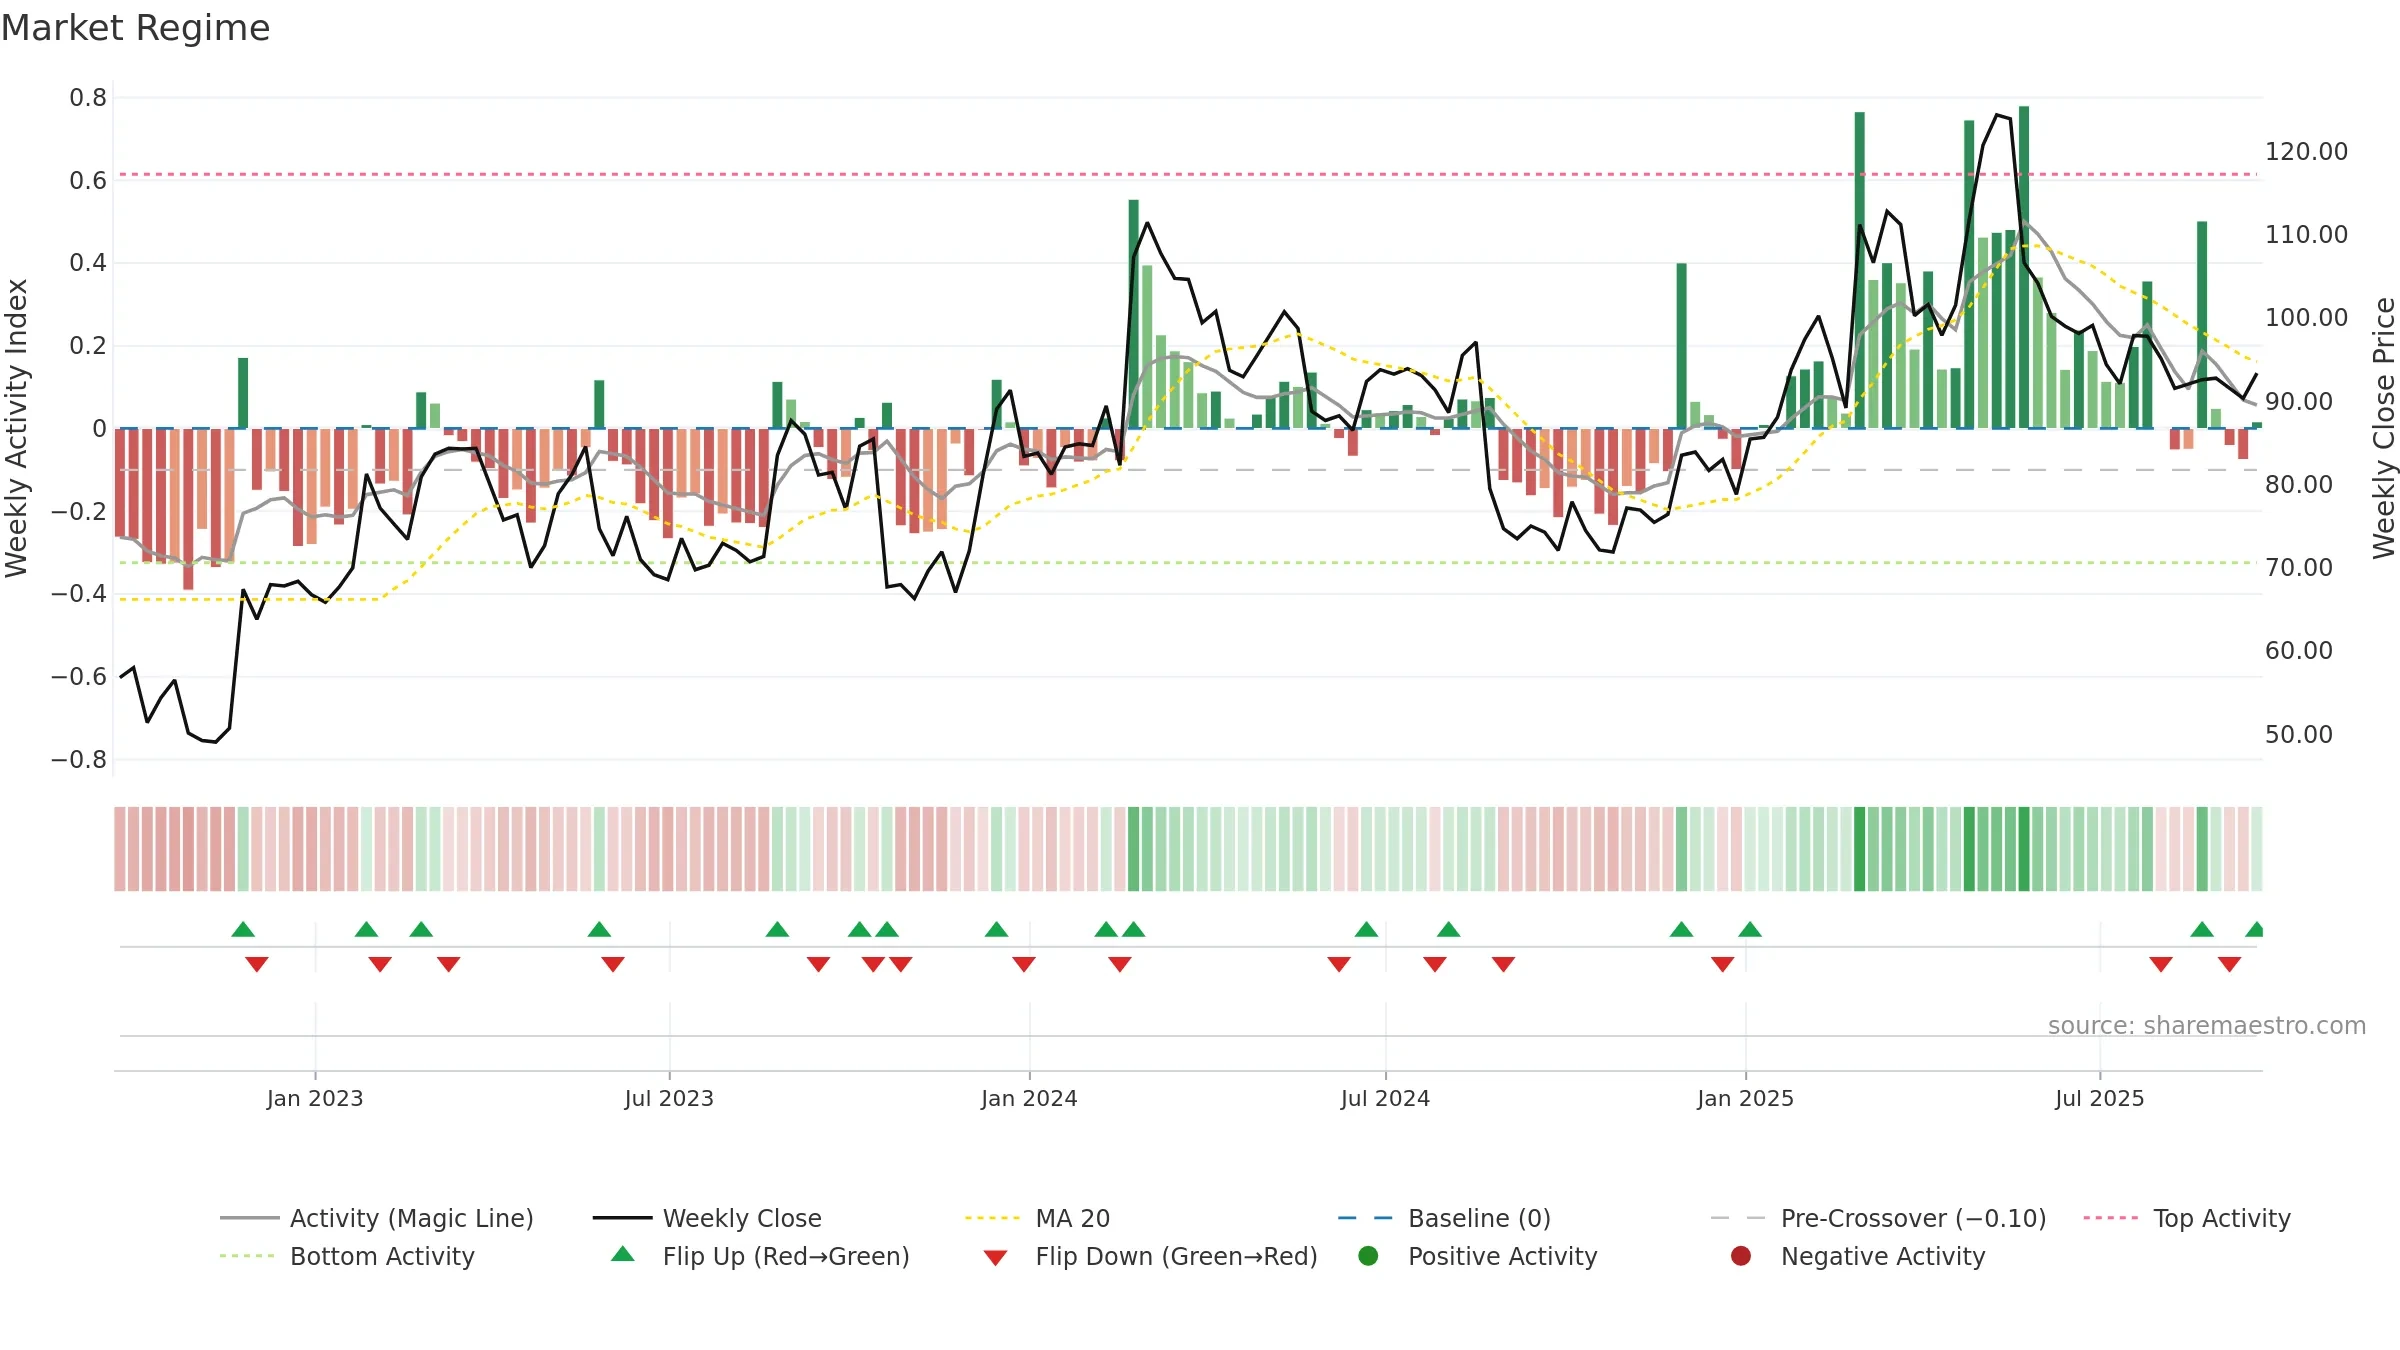
How to read this — Price slope is downward, indicating persistent supply pressure. Low weekly volatility favours steadier follow-through. Volume and price are moving in the same direction — a constructive confirmation. Returns are positively correlated with volume — strength tends to arrive on higher activity. Weak MA stack argues for caution; rallies can fail near the 8–13 week region.
Down-slope argues for patience; rallies can fade sooner unless participation improves.
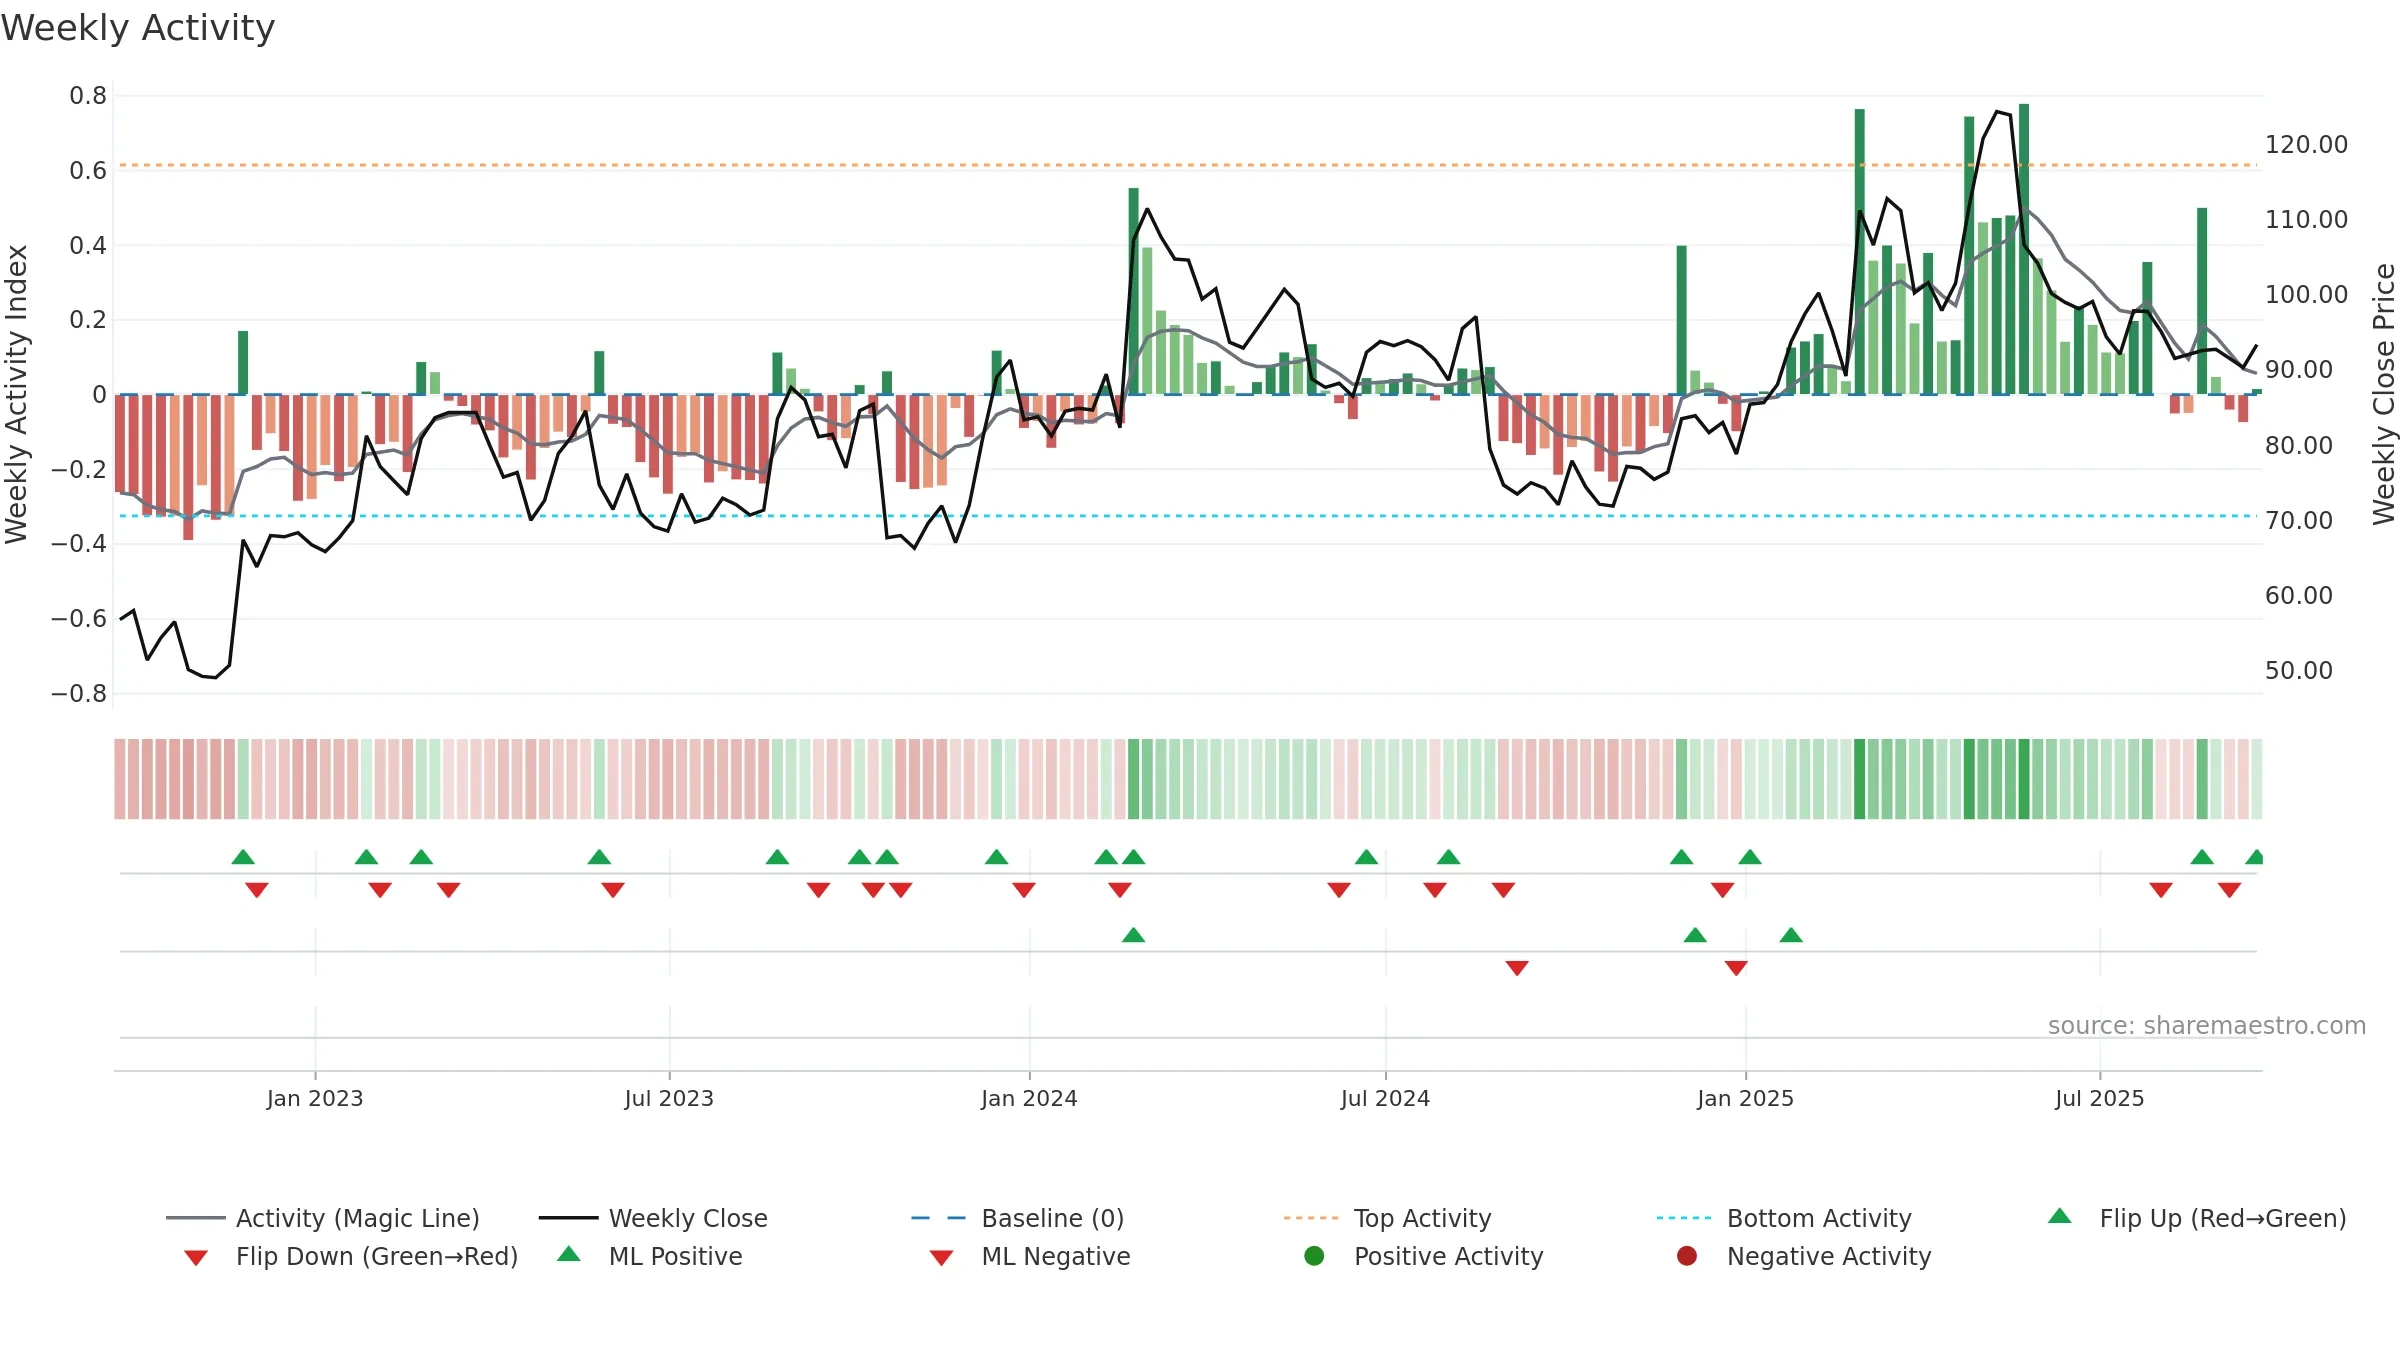
Gauge maps the trend signal to a 0–100 scale.
How to read this — Bearish zone with falling momentum — sellers in control.
Bias remains lower; rallies are suspect unless gauge reclaims 0.50/0.60.
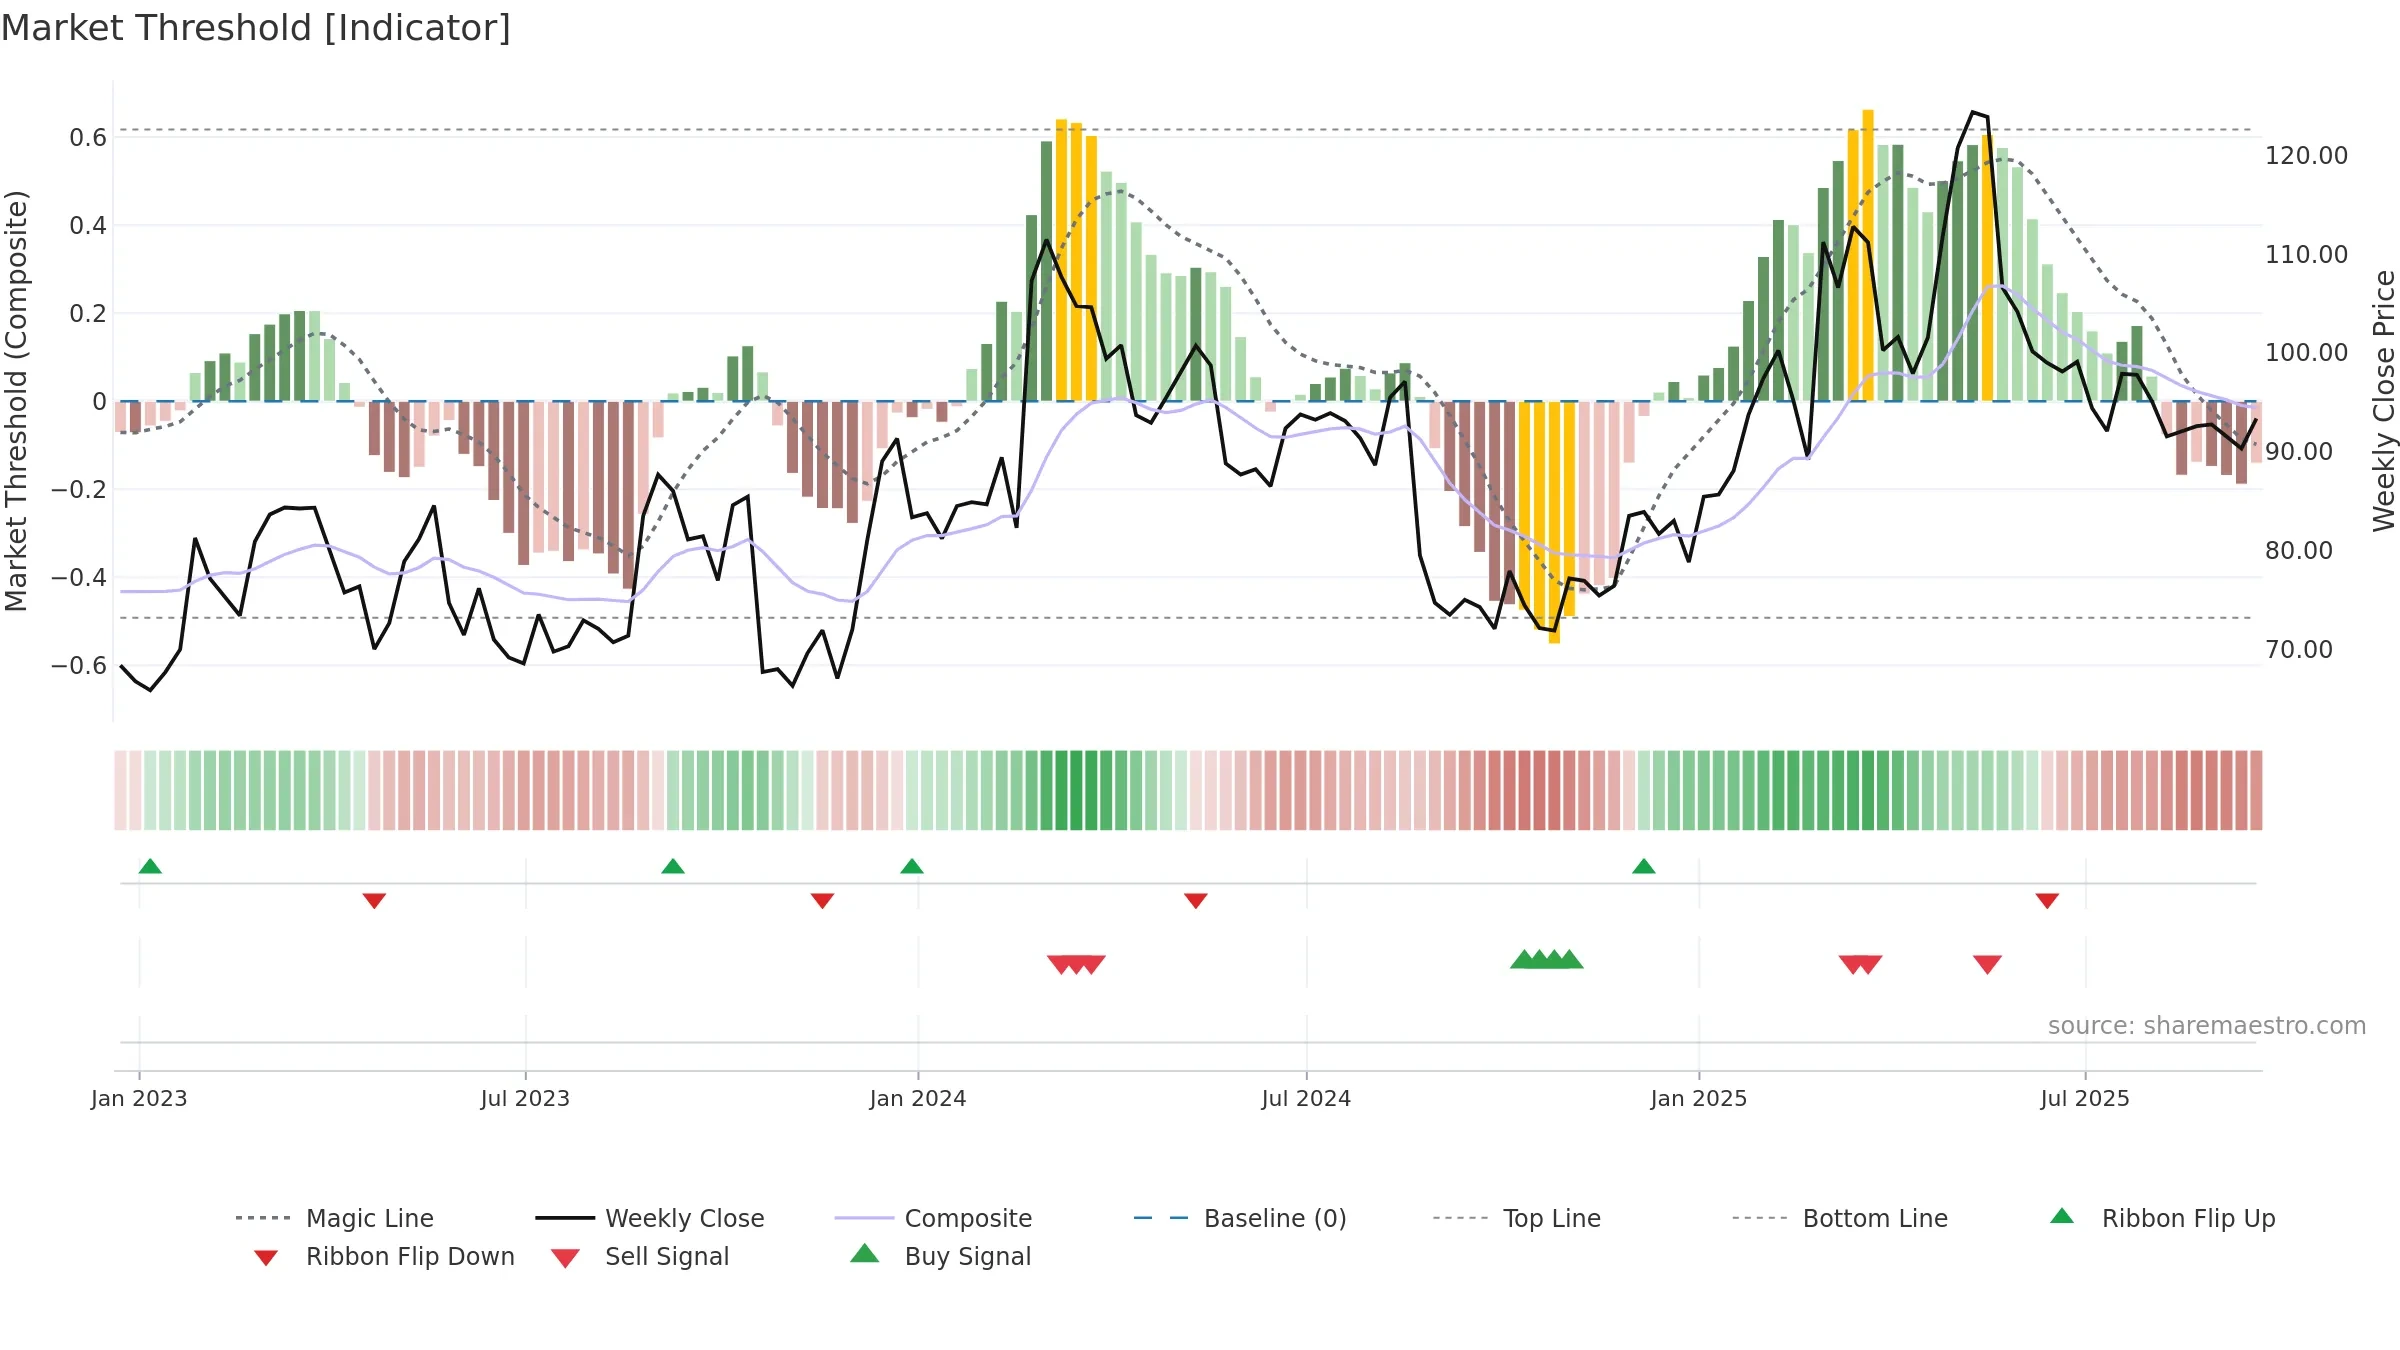
The flag is positive: favourable upside skew with supportive conditions.
Conclusion
Negative setup. ★★☆☆☆ confidence. Price window: -1. Trend: Downtrend Confirmed; gauge 23. In combination, liquidity confirms the move.
- Liquidity confirms the price trend
- Low return volatility supports durability
- Bearish control with falling momentum
- Momentum is weak/falling
- Price is not above key averages
- Weak moving-average stack
Why: Price window -1.85% over 8w. Close is -1.85% below the prior-window high. Return volatility 1.79%. Volume trend falling. Liquidity convergence with price. Trend state downtrend confirmed. MA stack weak. Momentum bearish and falling. Valuation stance positive.
Tip: Most metrics include a hover tooltip where they appear in the report.