Megaport Limited
MP1 ASX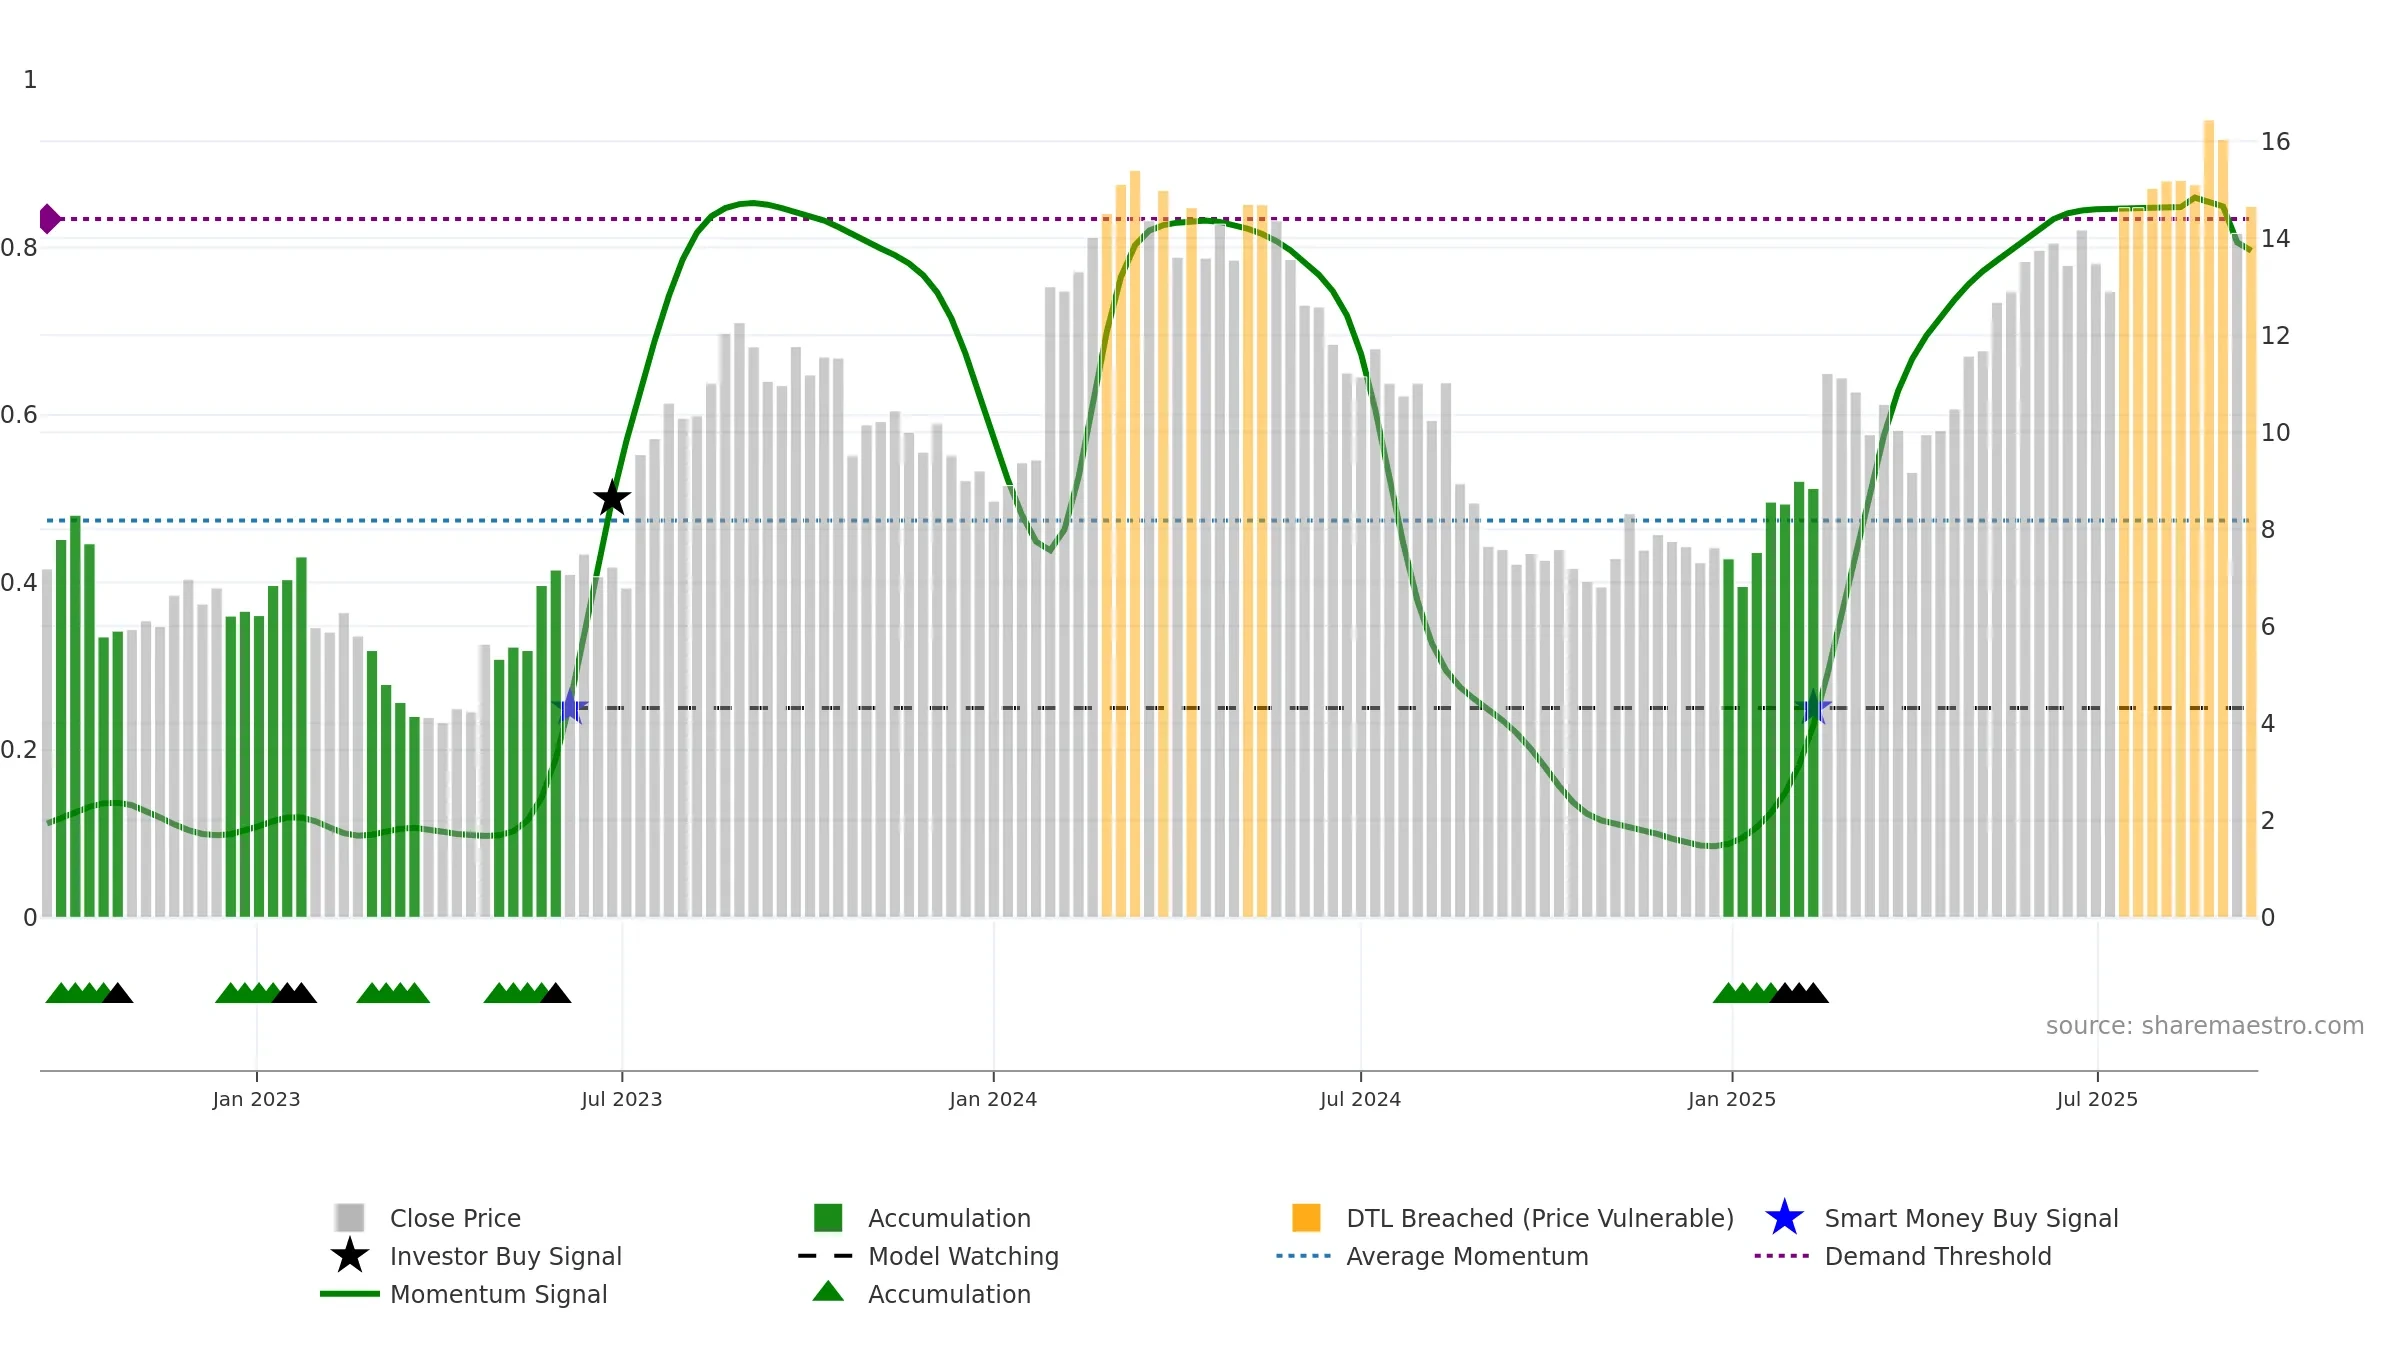
Weekly Report
Megaport Limited closed at 14.6600 (-0.68% WoW) . Data window ends Mon, 15 Sep 2025.
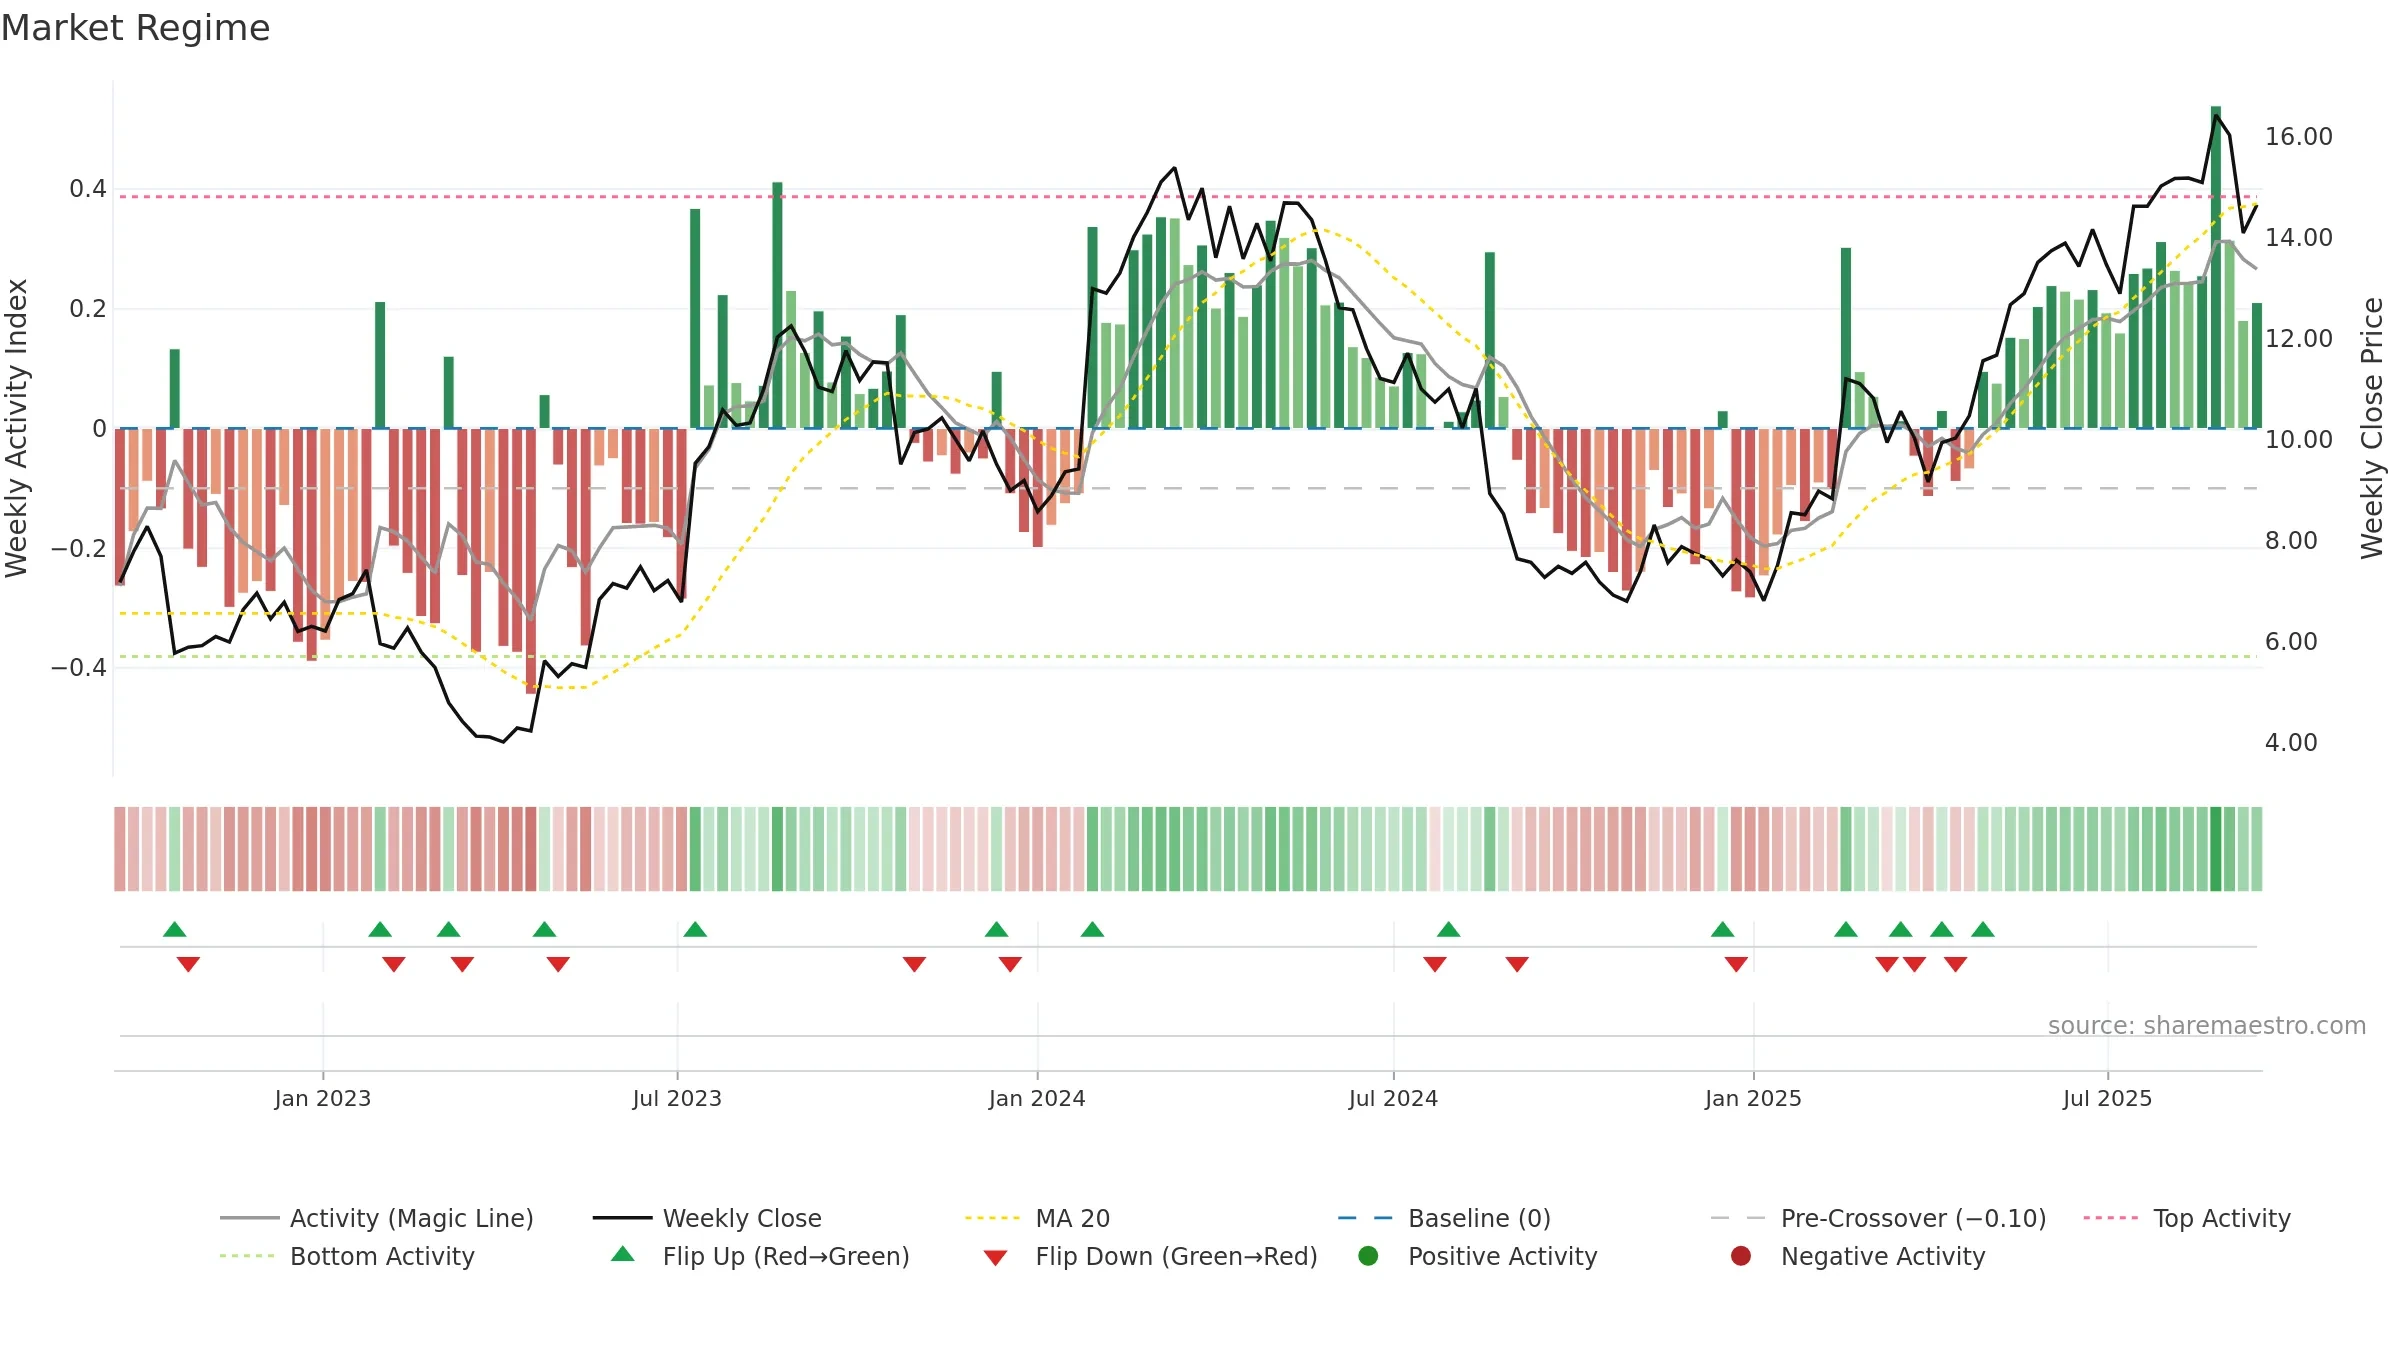
How to read this — Price slope is downward, indicating persistent supply pressure. Elevated weekly volatility increases whipsaw risk. Volume and price are moving in the same direction — a constructive confirmation. Returns are positively correlated with volume — strength tends to arrive on higher activity. Constructive MA stack supports the up-drift; pullbacks may find support at the 8–13 week region.
Down-slope argues for patience; rallies can fade sooner unless participation improves.
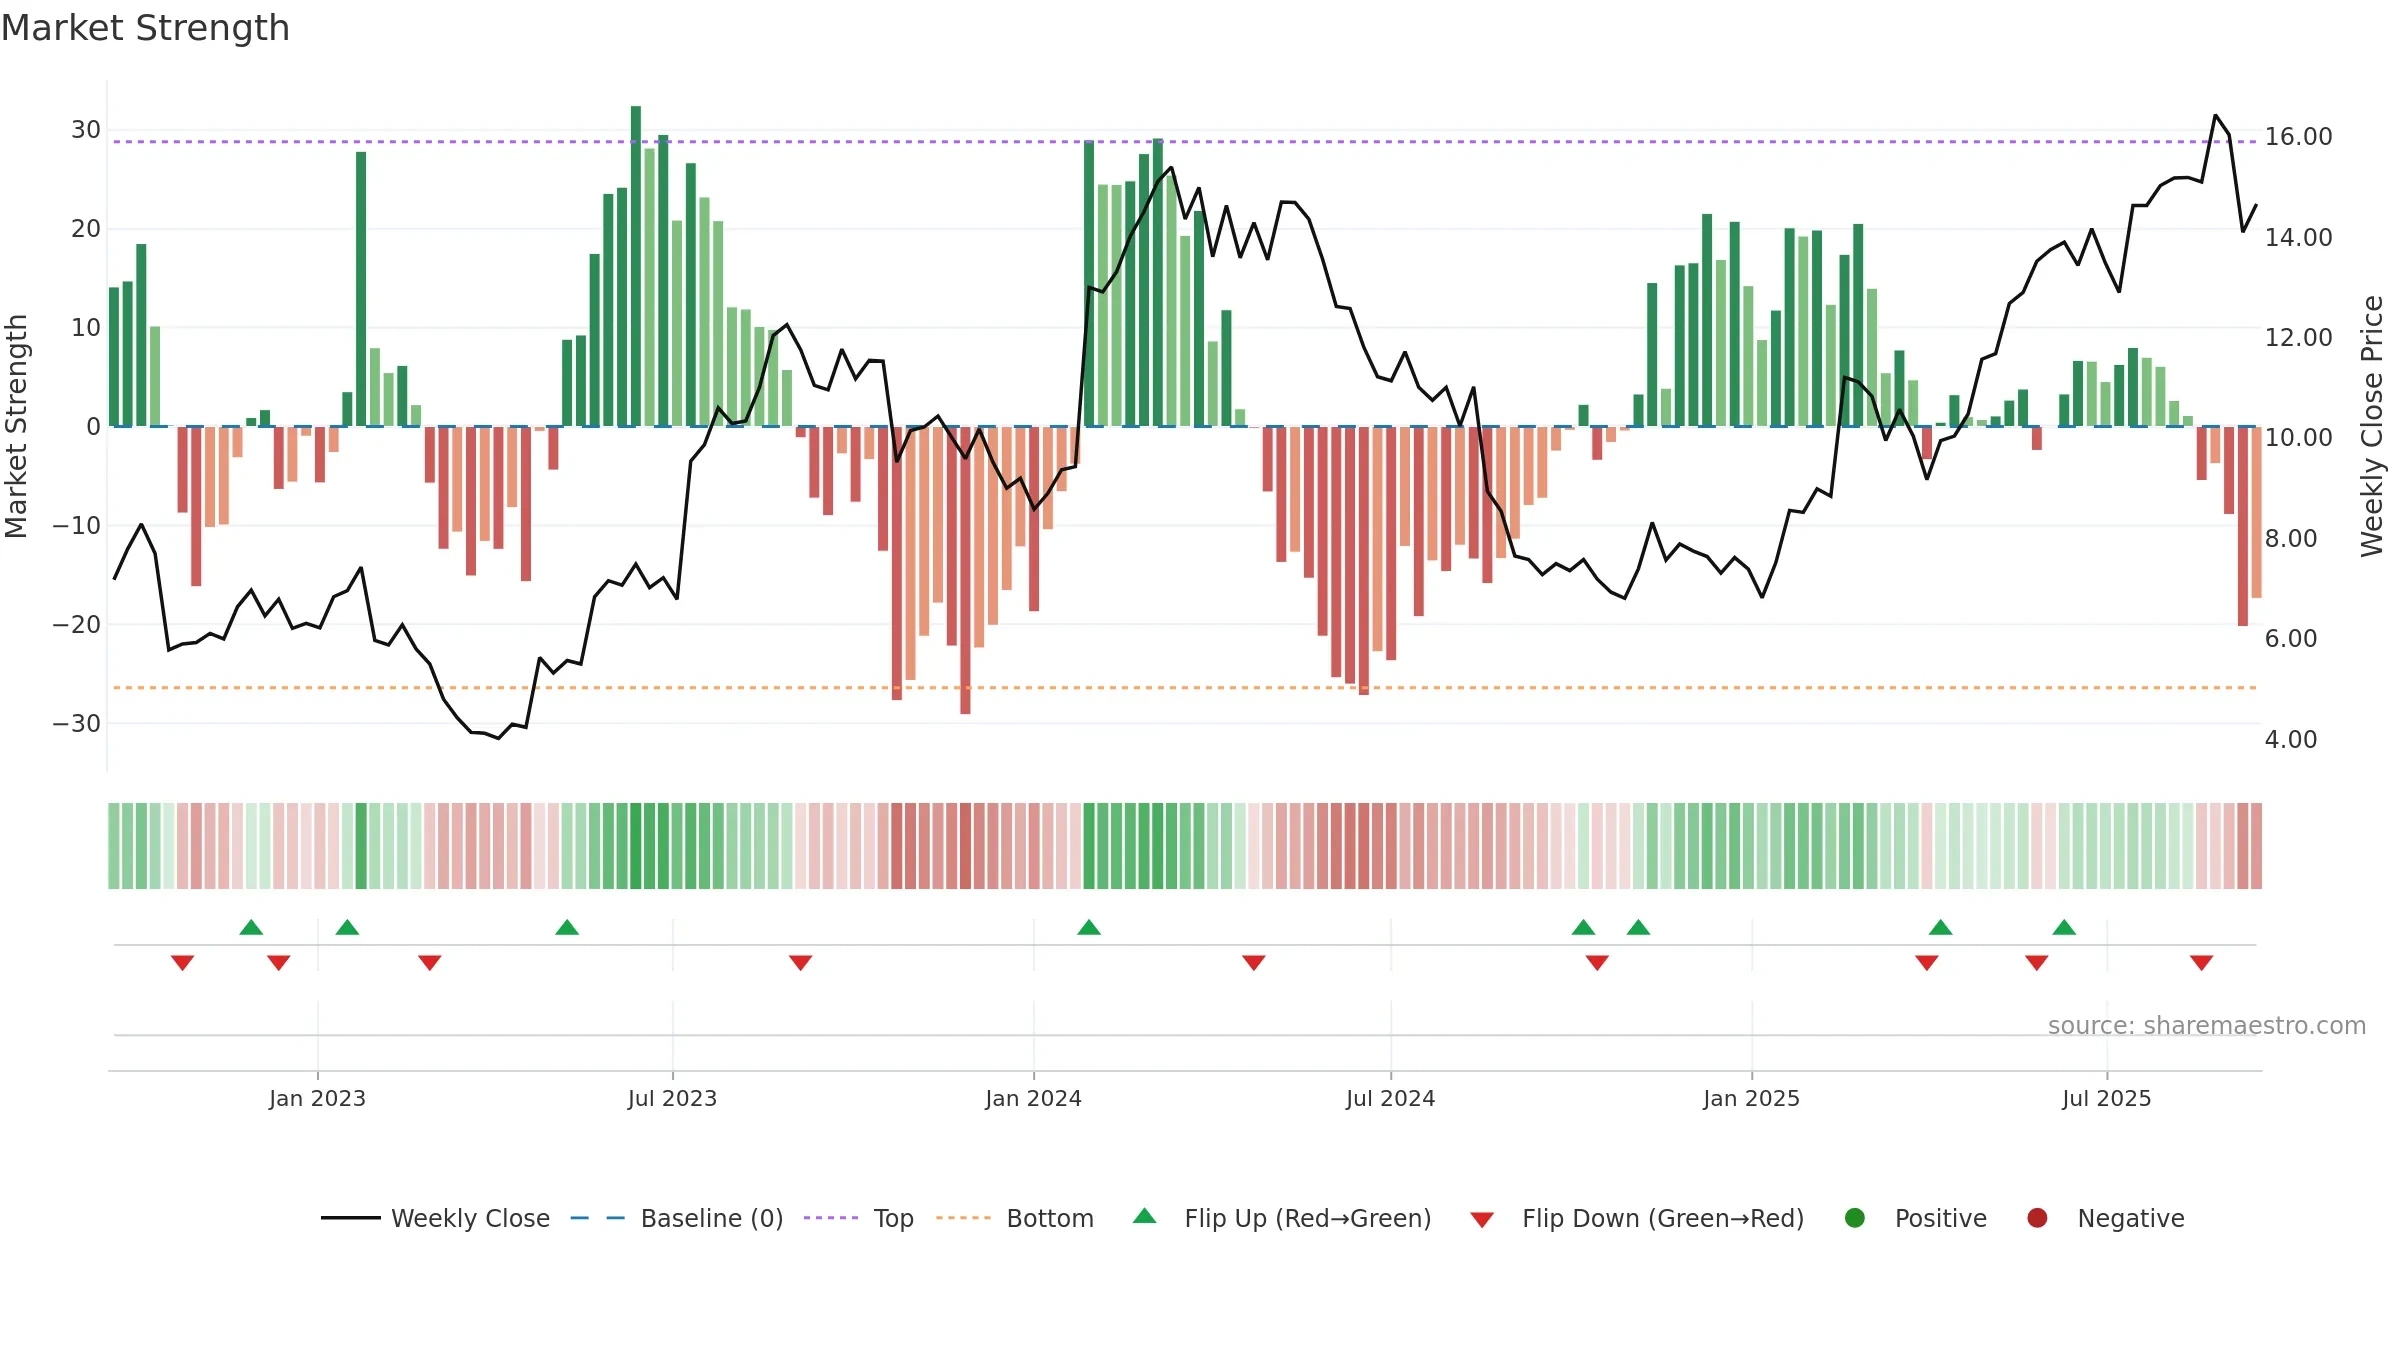
Gauge maps the trend signal to a 0–100 scale.
How to read this — Gauge is elevated but momentum is rolling over; topping risk is rising. Notable breakdown from ≥0.80 weakens trend quality.
Stay alert: protect gains or seek confirmation before adding risk.
Price is above fair value; upside may be capped without catalysts.
Conclusion
Negative setup. ★★☆☆☆ confidence. Price window: -2. Trend: Uptrend at Risk; gauge 79. In combination, liquidity confirms the move.
- Constructive moving-average stack
- Liquidity confirms the price trend
- High-level but rolling over (topping risk)
- Momentum is weak/falling
- Price is not above key averages
- High return volatility raises whipsaw risk
Why: Price window -2.46% over 8w. Close is -10.83% below the prior-window high. Return volatility 4.59%. Volume trend falling. Liquidity convergence with price. Trend state uptrend at risk. High-regime (0.80–1.00) downticks 5/7 (71.0%) • Distributing. MA stack constructive. Momentum neutral and falling. Valuation limited upside without catalysts.
Tip: Most metrics include a hover tooltip where they appear in the report.