No results found.

Invesco High Yield Equity Dividend Achievers ETF

PEY ETF-US
Week Ending
Fri, 19 Sep 2025
Open
21.1800
Close
21.0500
High
21.1900
Low
20.9900
Trend
0.58171
Sharemaestro [Charts]
PEY weekly Smart Money chart, closing 2025-09-19.
PEY weekly Market Snapshot chart, closing 2025-09-19.
PEY weekly Market Cycle chart, closing 2025-09-19.
PEY weekly Market Demand chart, closing 2025-09-19.
PEY weekly Market Strength chart, closing 2025-09-19.
PEY weekly Market Dynamics chart, closing 2025-09-19.
PEY weekly Market Threshold chart, closing 2025-09-19.

Weekly Report

Invesco High Yield Equity Dividend Achievers ETF (PEY) Week Ending: Fri, 19 Sep 2025 ★★★☆☆
Price
Weekly Close

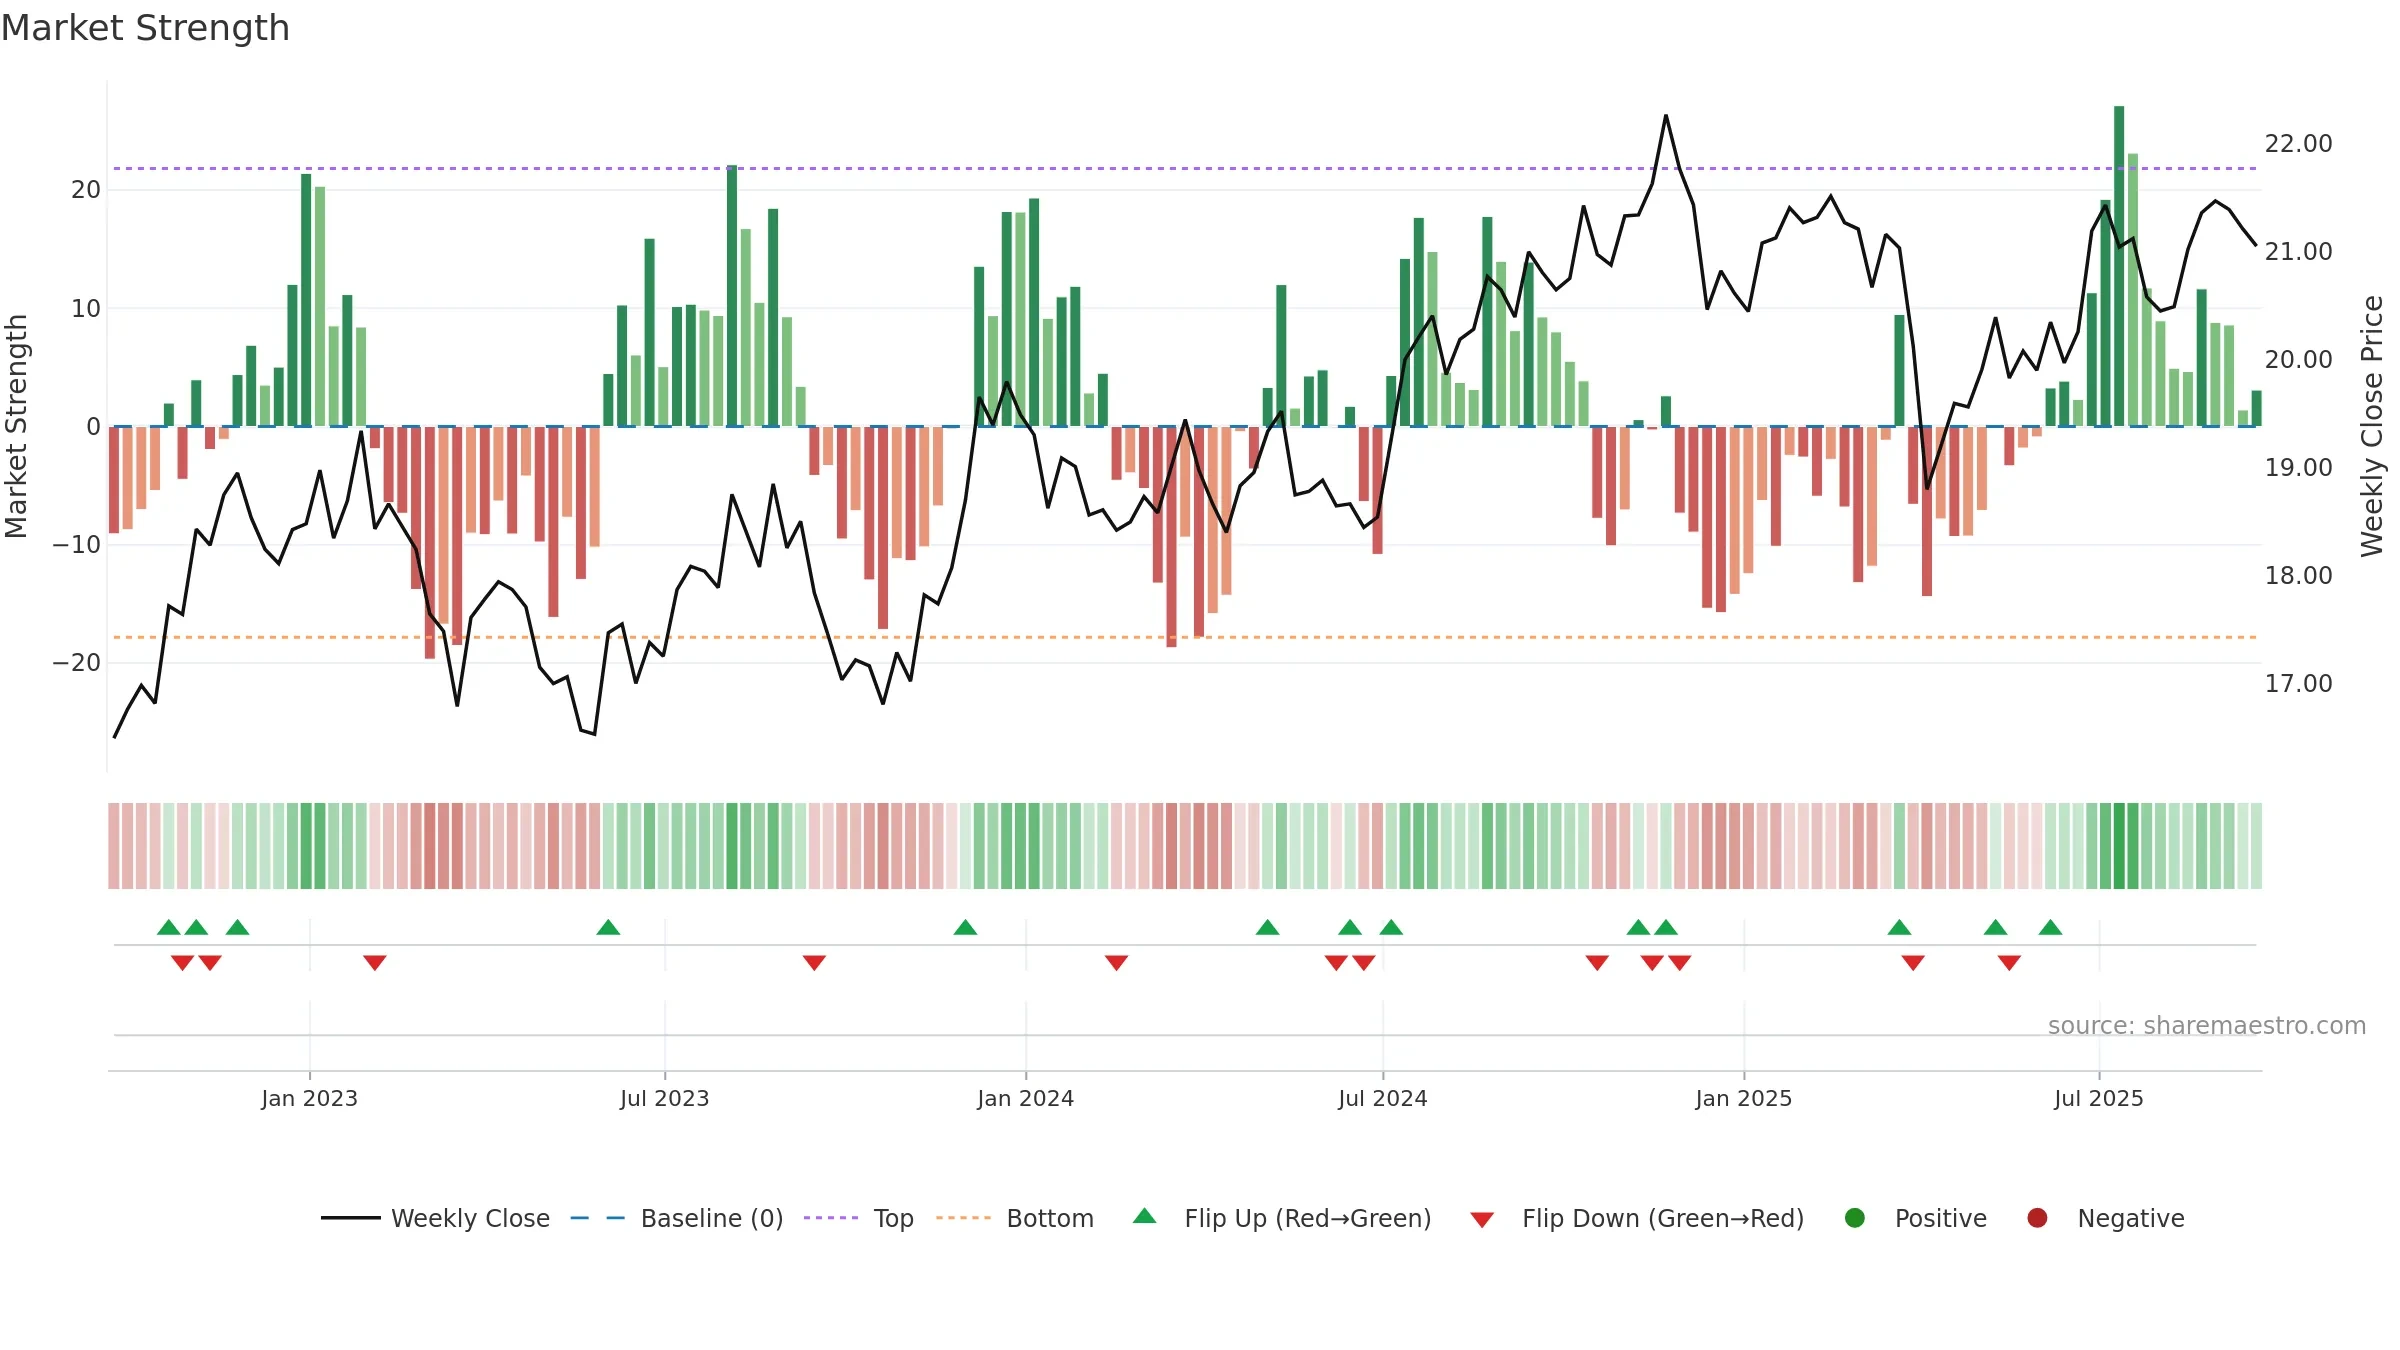
Invesco High Yield Equity Dividend Achievers ETF closed at 21.0500 (-0.61% WoW) . Data window ends Fri, 19 Sep 2025.

Price Window2.93% over 8w
Return Volatility0.56%
Volume TrendFalling
Vs 8w High-1.96%
What stands out

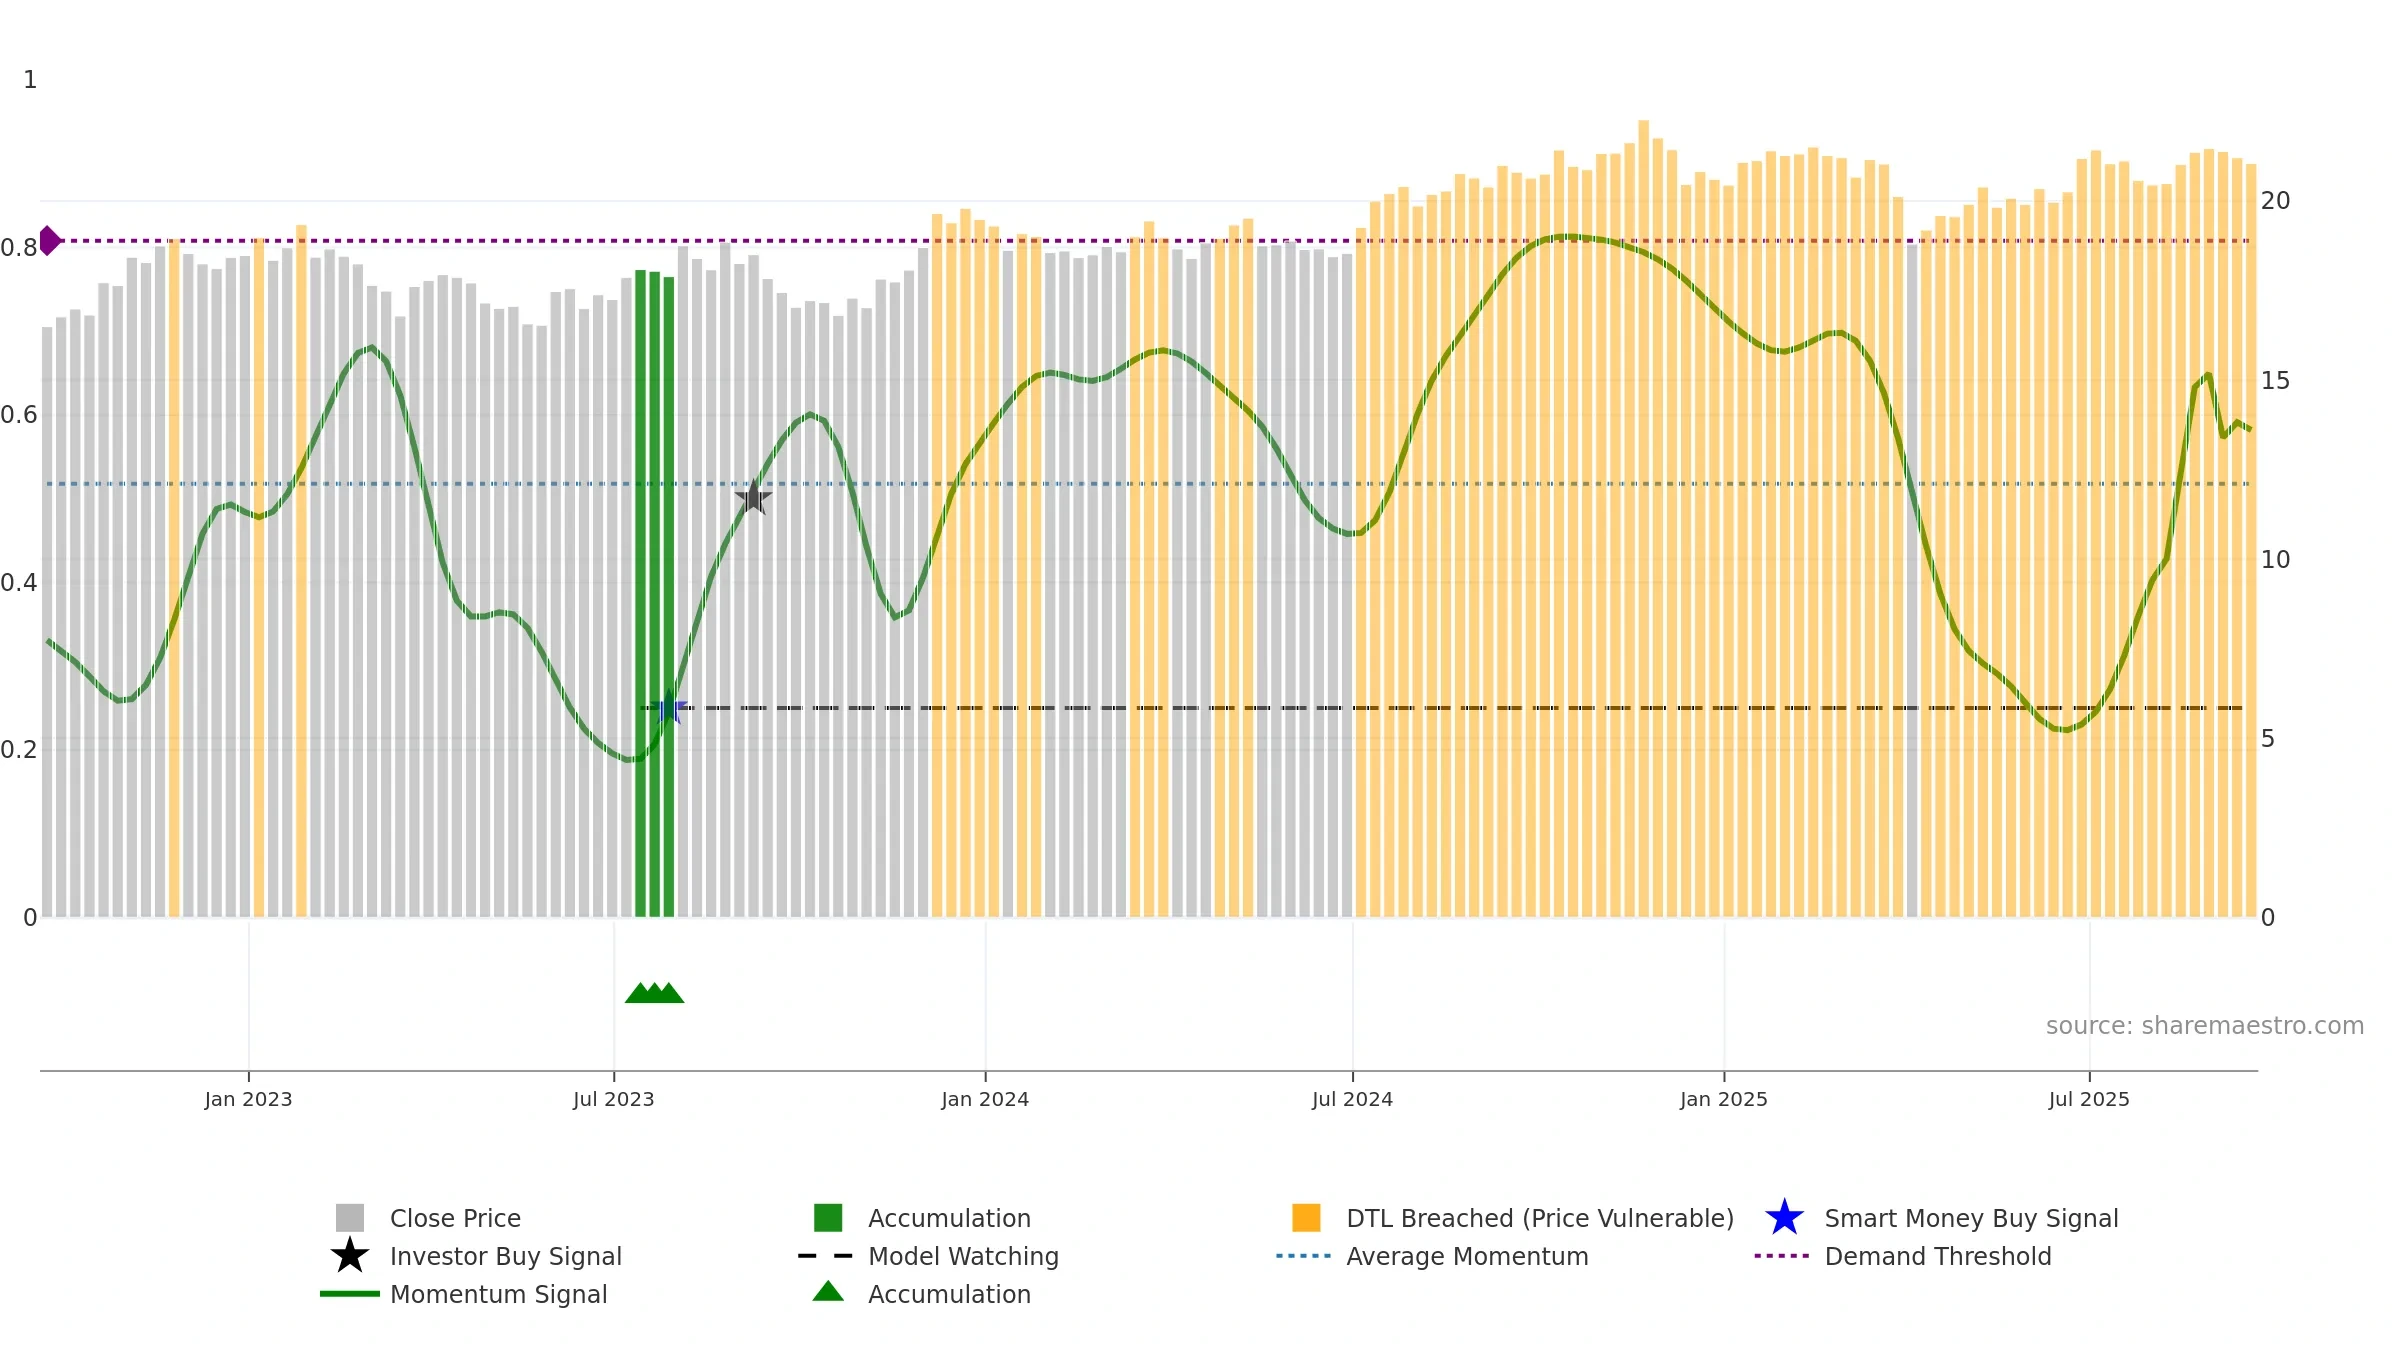
How to read this — Price slope is upward, indicating persistent buying over the window. Low weekly volatility favours steadier follow-through. Volume trend diverges from price — watch for fatigue or rotation. Returns are positively correlated with volume — strength tends to arrive on higher activity. Distance to baseline is narrowing — reverting closer to its fair-value track.

What to watch

Up-slope supports buying interest; pullbacks may be contained if activity stays firm. Because liquidity isn’t confirming, prefer evidence of fresh demand before chasing moves.

Trend
Sharemaestro Trend Line

Gauge maps the trend signal to a 0–100 scale.

Gauge Reading58.2/100
DirectionRising
Accelerationdecelerating
Gauge VolatilityHigh
Trend ClassificationNeutral
What stands out

How to read this — Neutral levels indicate a balance between buyers and sellers.

Conclusion

Neutral ★★★☆☆

Neutral setup. ★★★☆☆ confidence. Price window: 2. Trend: Neutral @ 58. In combination, liquidity diverges from price.

Strengths
  • Low return volatility supports durability
Watch-outs
  • Price is not above key averages
  • Liquidity diverges from price

Why: Price window 2.93% over 8w. Close is -1.96% below the prior-window high. Return volatility 0.56%. Volume trend falling. Liquidity divergence with price. Momentum neutral and rising .

Price Window Endpoint return over the last N weeks using weekly closes: (Closelast − Closefirst)/Closefirst × 100.
Return Volatility Std-dev of weekly returns (%). Higher = choppier.
Volume Trend Slope of weekly volume across the window (rising / falling / flat).
Vs N-week High % distance of latest close from the highest close in the window.
Accumulation Weeks Weeks price rose on higher volume than the prior week.
Distribution Weeks Weeks price fell on higher volume than the prior week.
MA Stack Relative order of short / intermediate / long MAs. Short > long is constructive.
4–8 Crossover Latest cross of 4-week vs 8-week MA (bullish / bearish / none).
Price vs MAs Whether the close is above/below key averages (8w & 26w).
Baseline Deviation % distance from the market-cycle baseline (fair-value track).
Gauge Reading Smoothed trend signal mapped to 0–100.
Direction Slope sign of the gauge across the window (rising / falling).
Acceleration Change in the slope of the gauge (accelerating / decelerating).
Gauge Volatility Variability of the gauge (low / normal / high).
Zone Label Classification by level (Bullish / Neutral / Bearish).
Target Price (Flag) If flagged: Positive/Negative stance. Otherwise: numeric fair value.
Composite Score Overall model score (0–10).
Hybrid Efficiency Efficiency of growth × quality (0–10).
Rating Model’s verdict for the snapshot.
Weekly Close Sparkline of the last 52 weekly closing prices.
Trend Line Sparkline of the smoothed trend signal over the last 52 weeks.

Tip: Most metrics also include a hover tooltip where they appear in the report.

Download JSON Download CSV JSON-LD Snapshots: 2025-09-19