Arrow Electronics, Inc.
ARW NYSE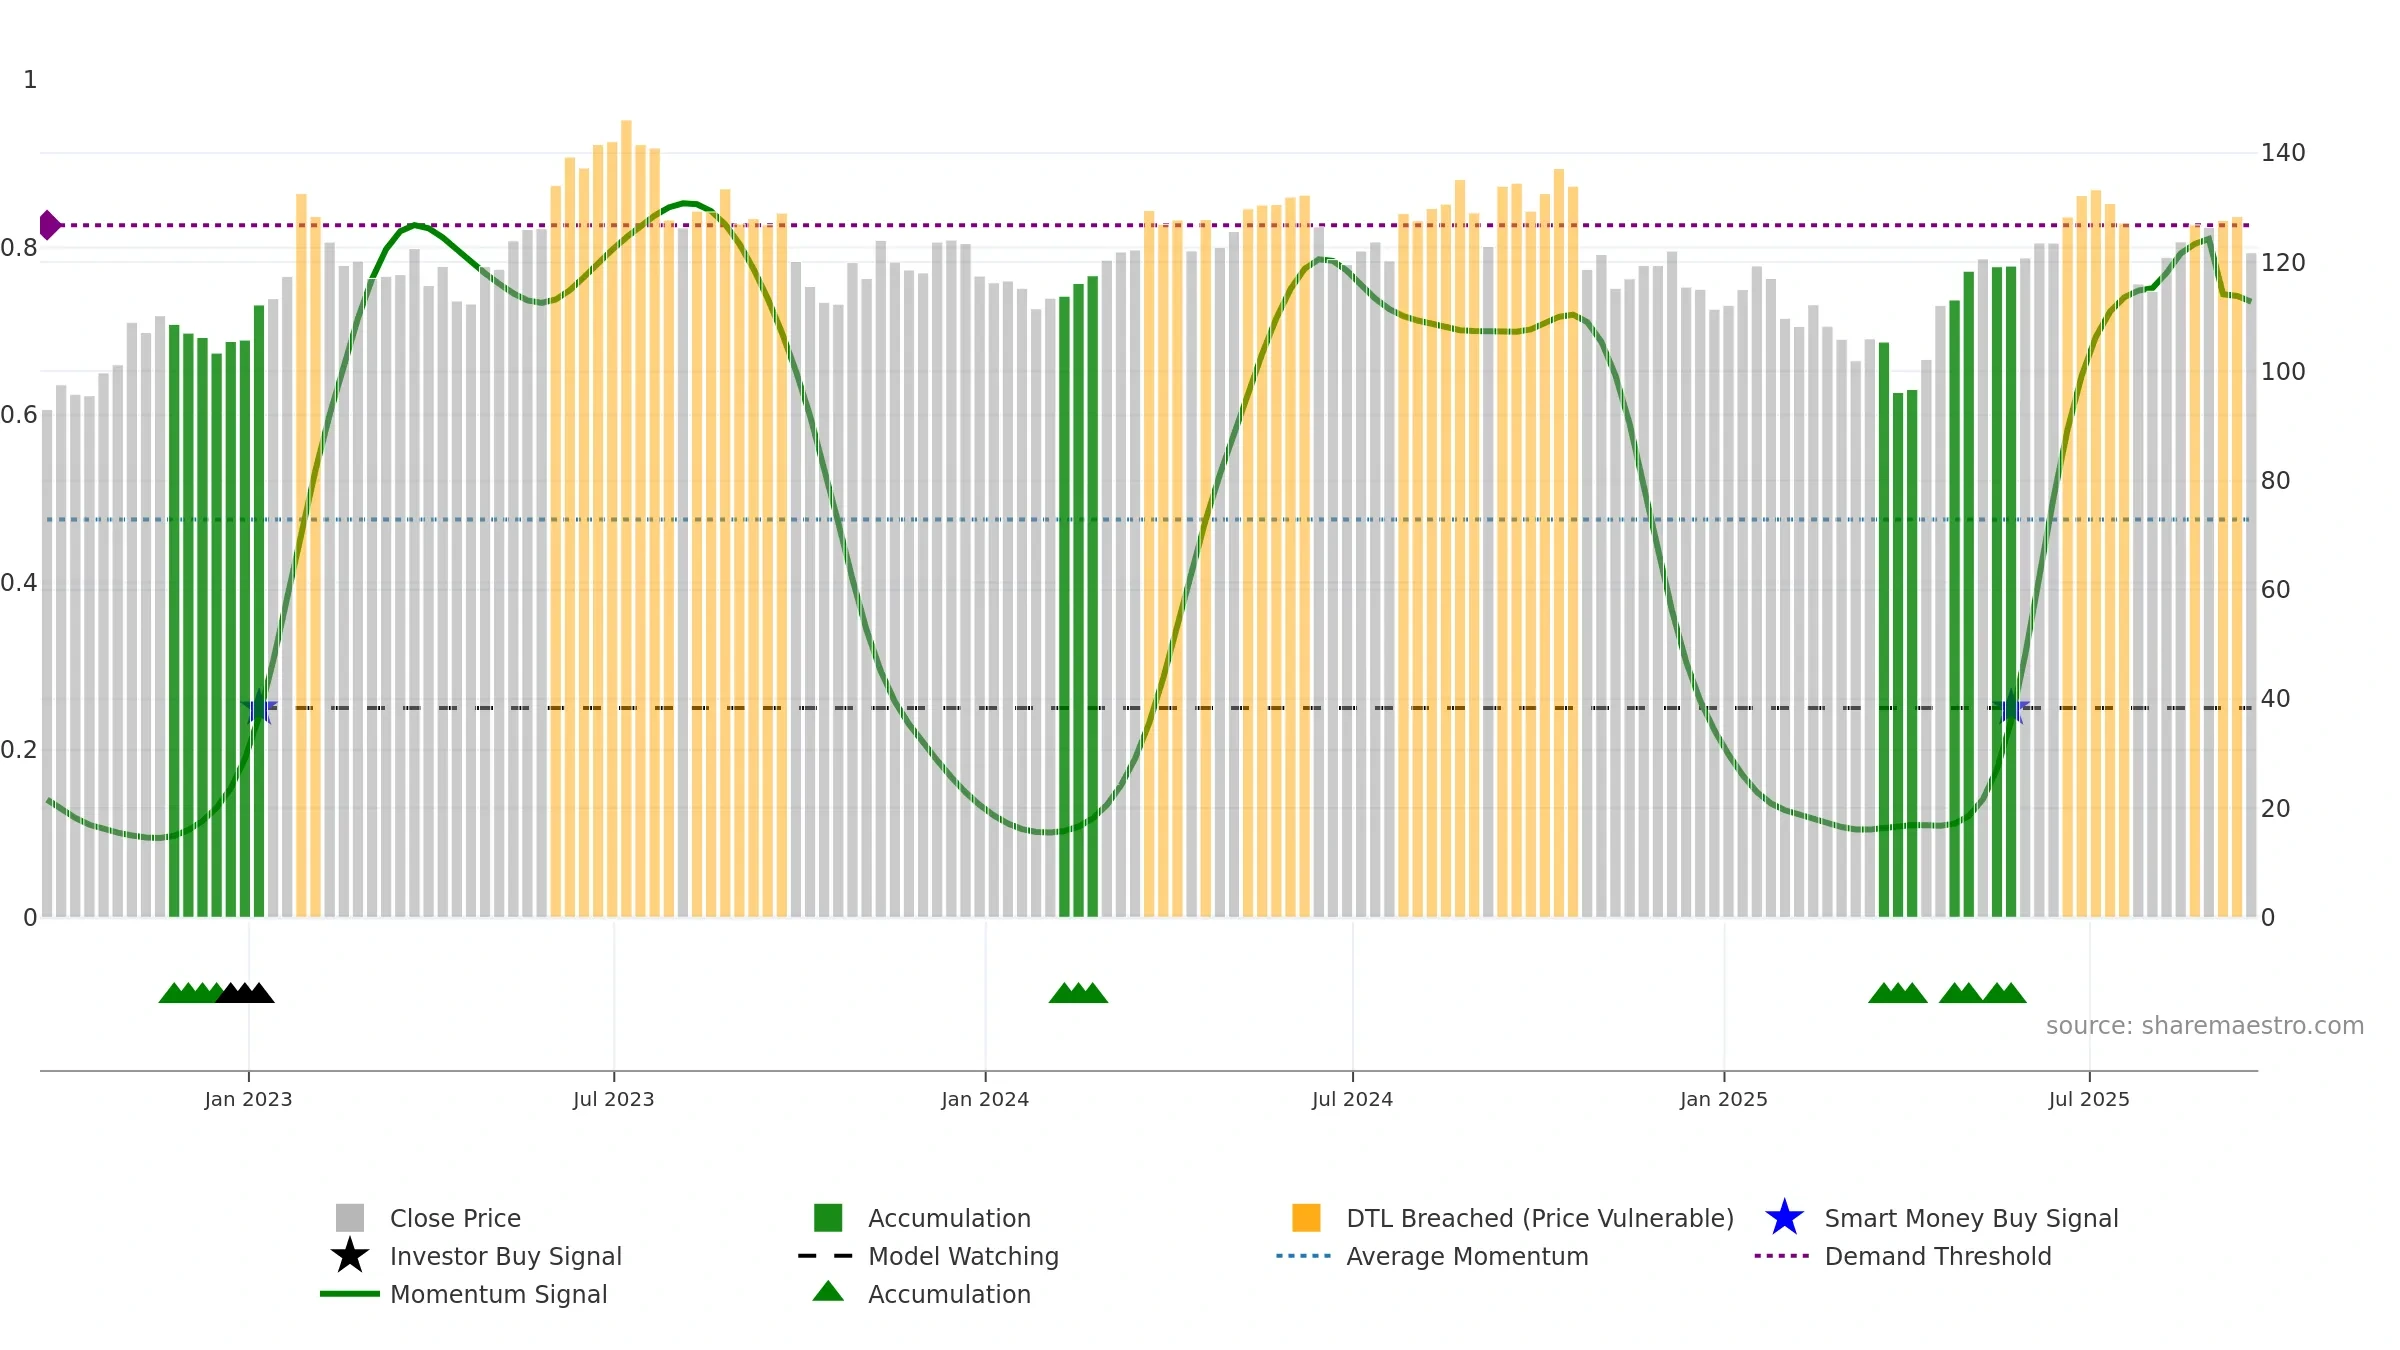
Weekly Summary
Arrow Electronics, Inc. closed at 121.7200 (-1.00% WoW) . Data window ends Fri, 19 Sep 2025.
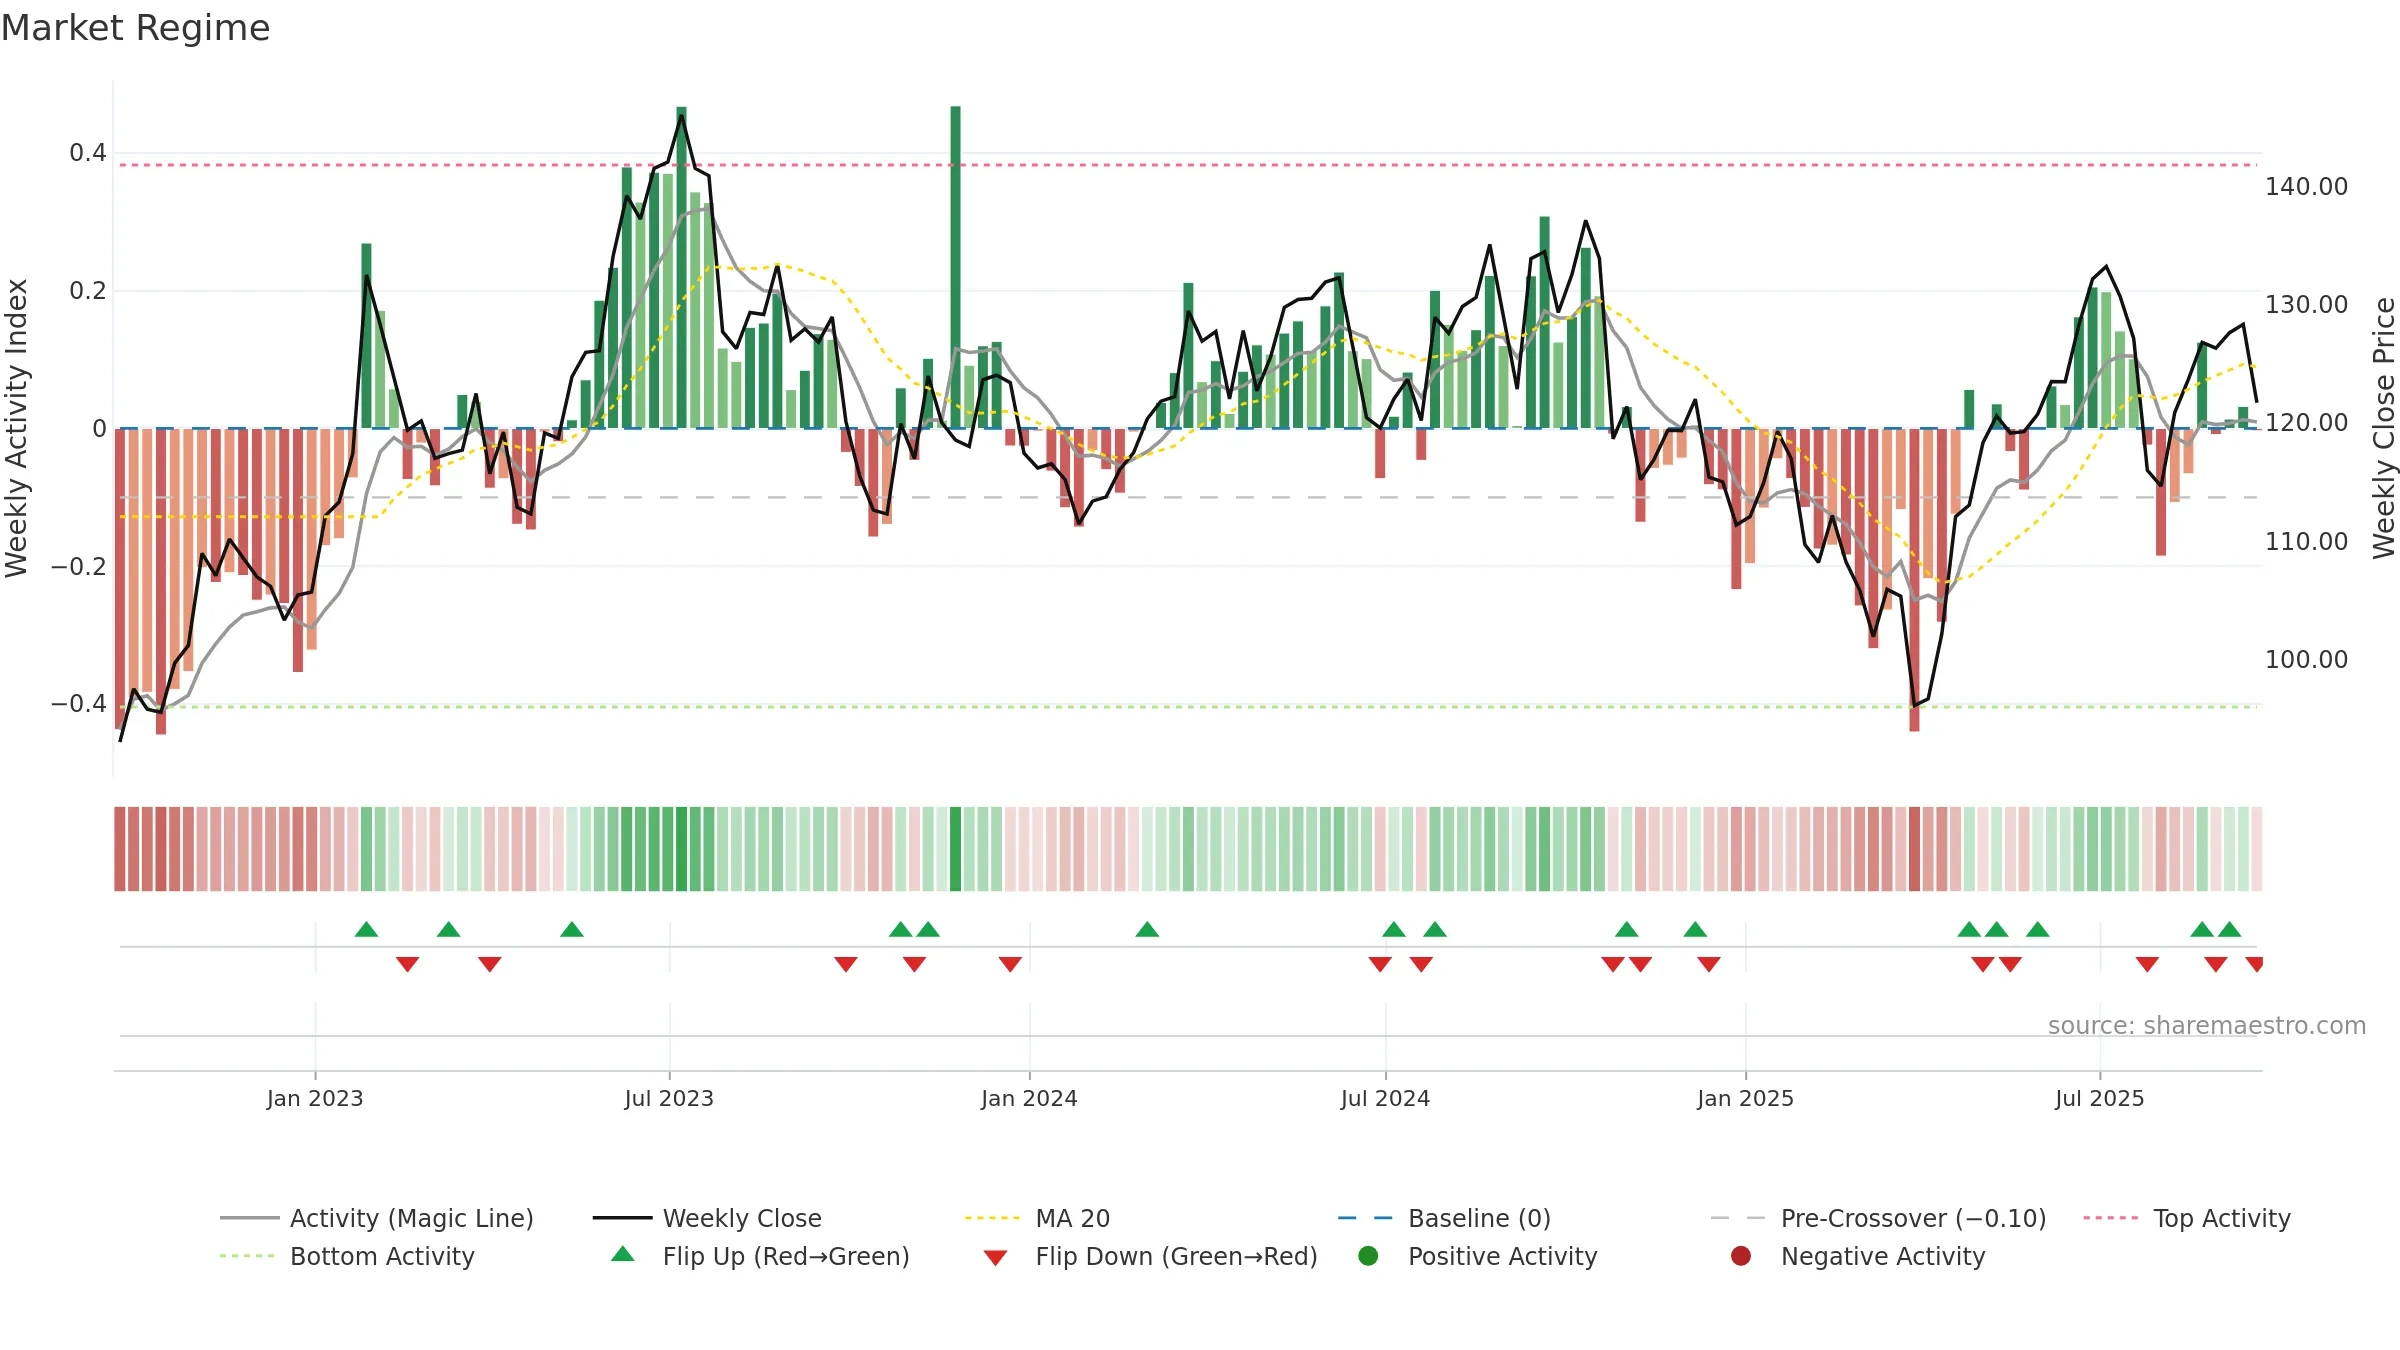
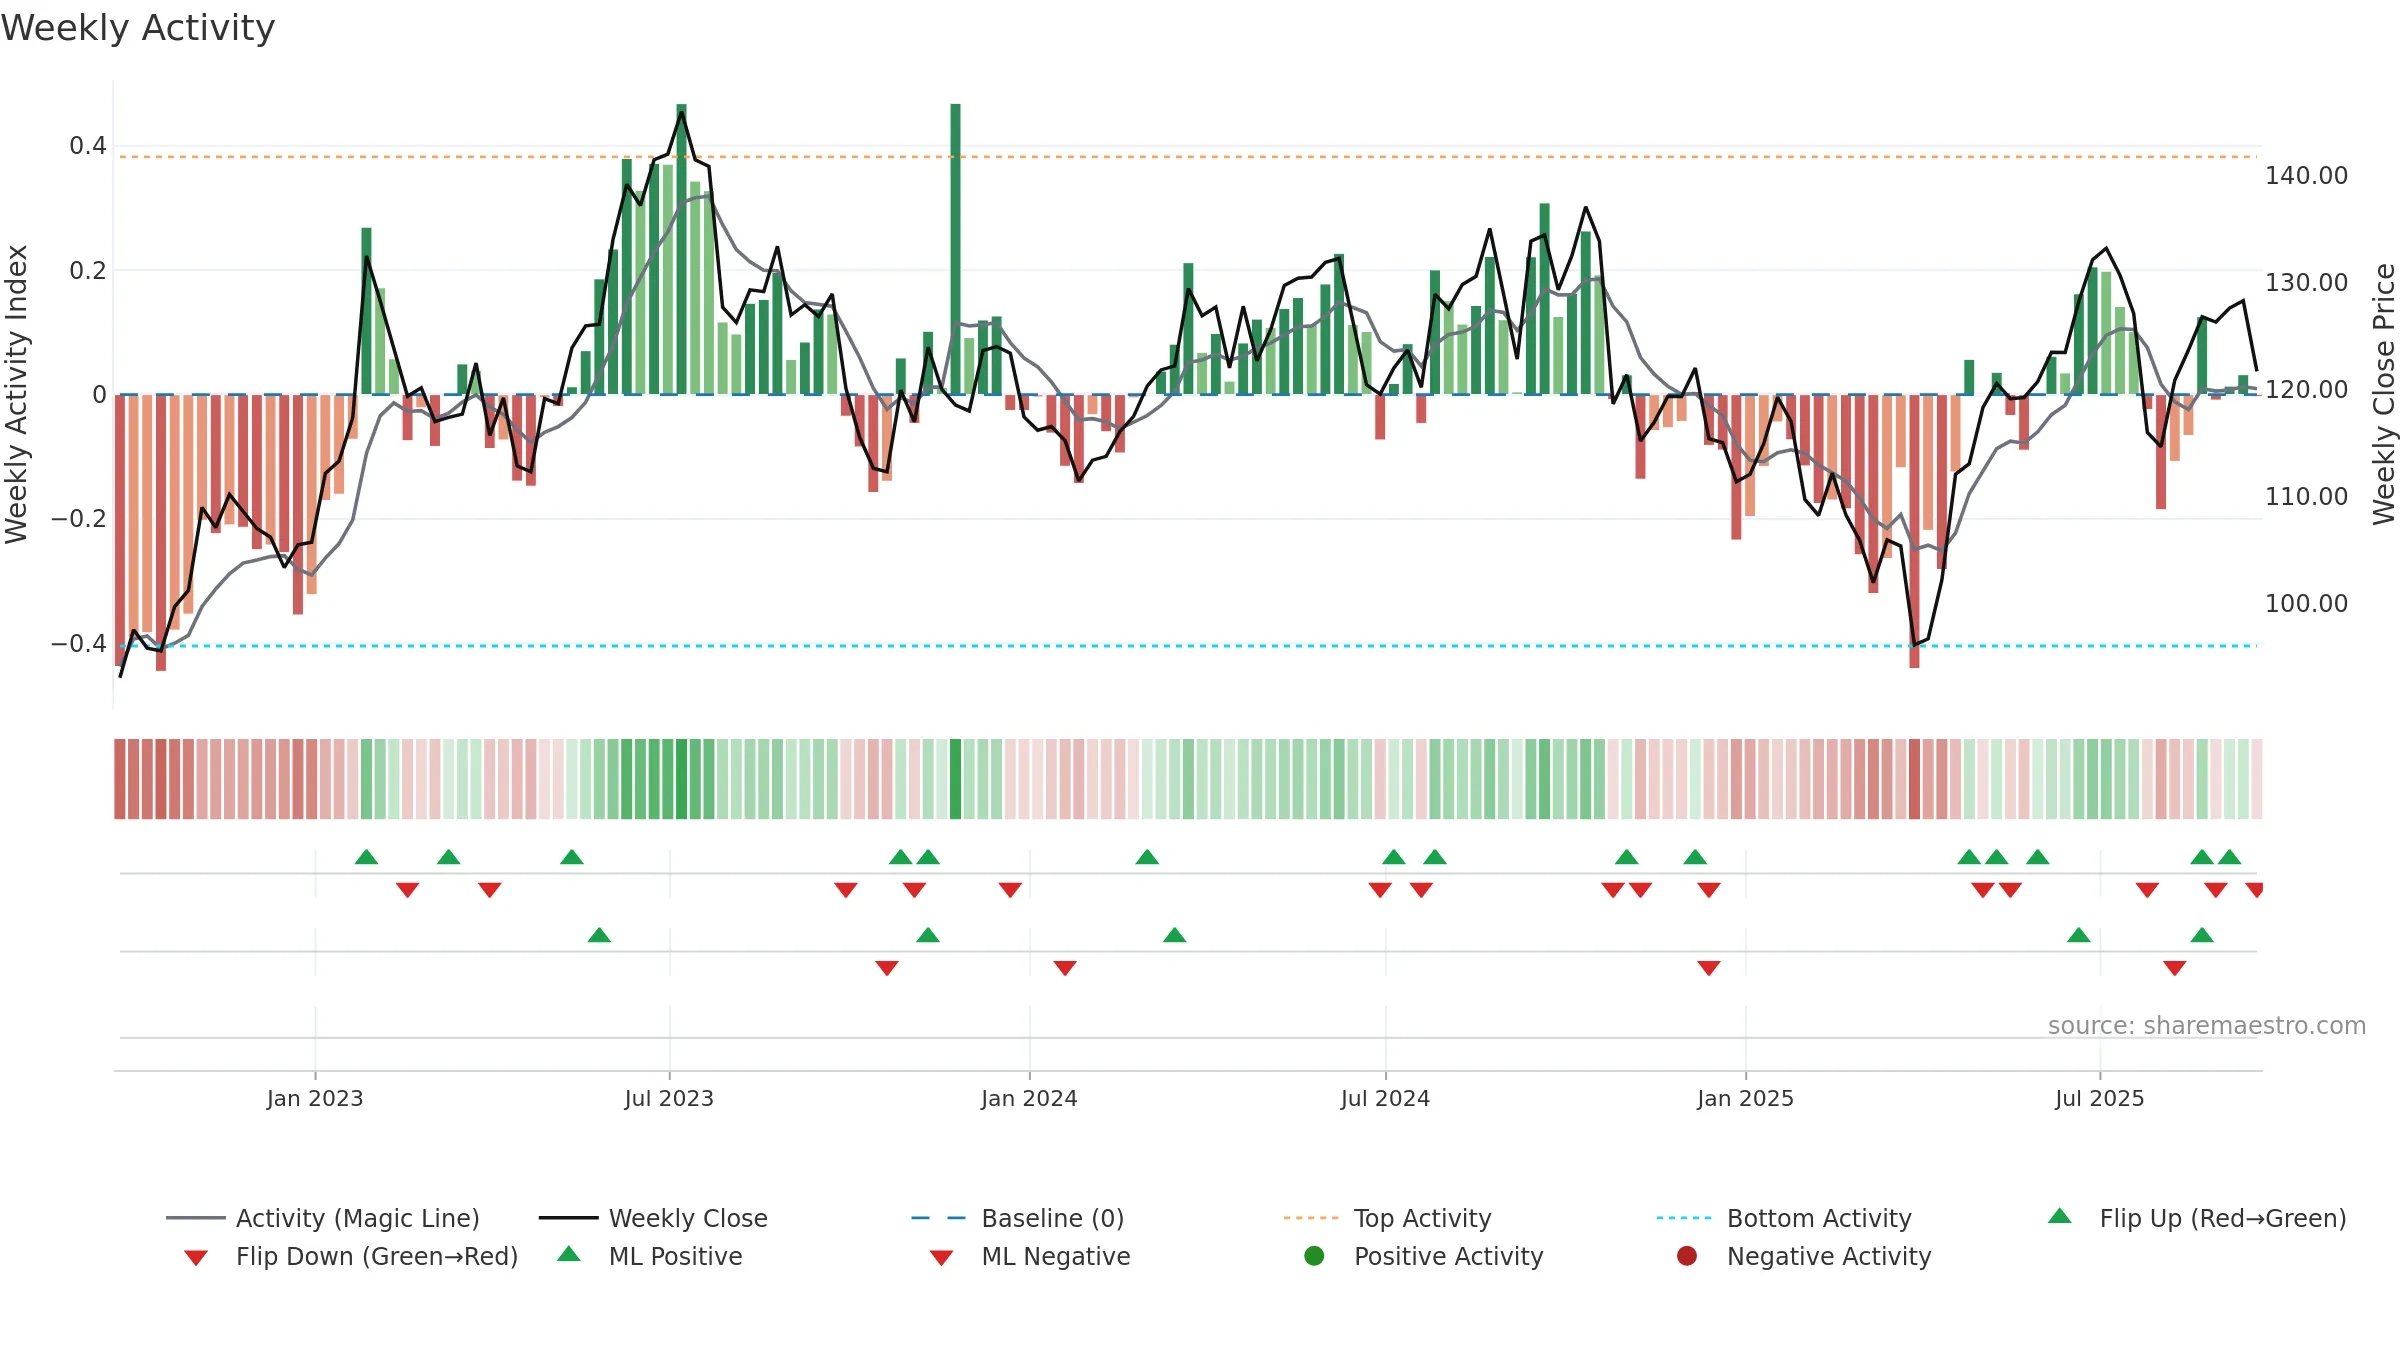
How to read this — Price slope is upward, indicating persistent buying over the window. Low weekly volatility favours steadier follow-through. Volume and price are moving in the same direction — a constructive confirmation.
Up-slope supports buying interest; pullbacks may be contained if activity stays firm.
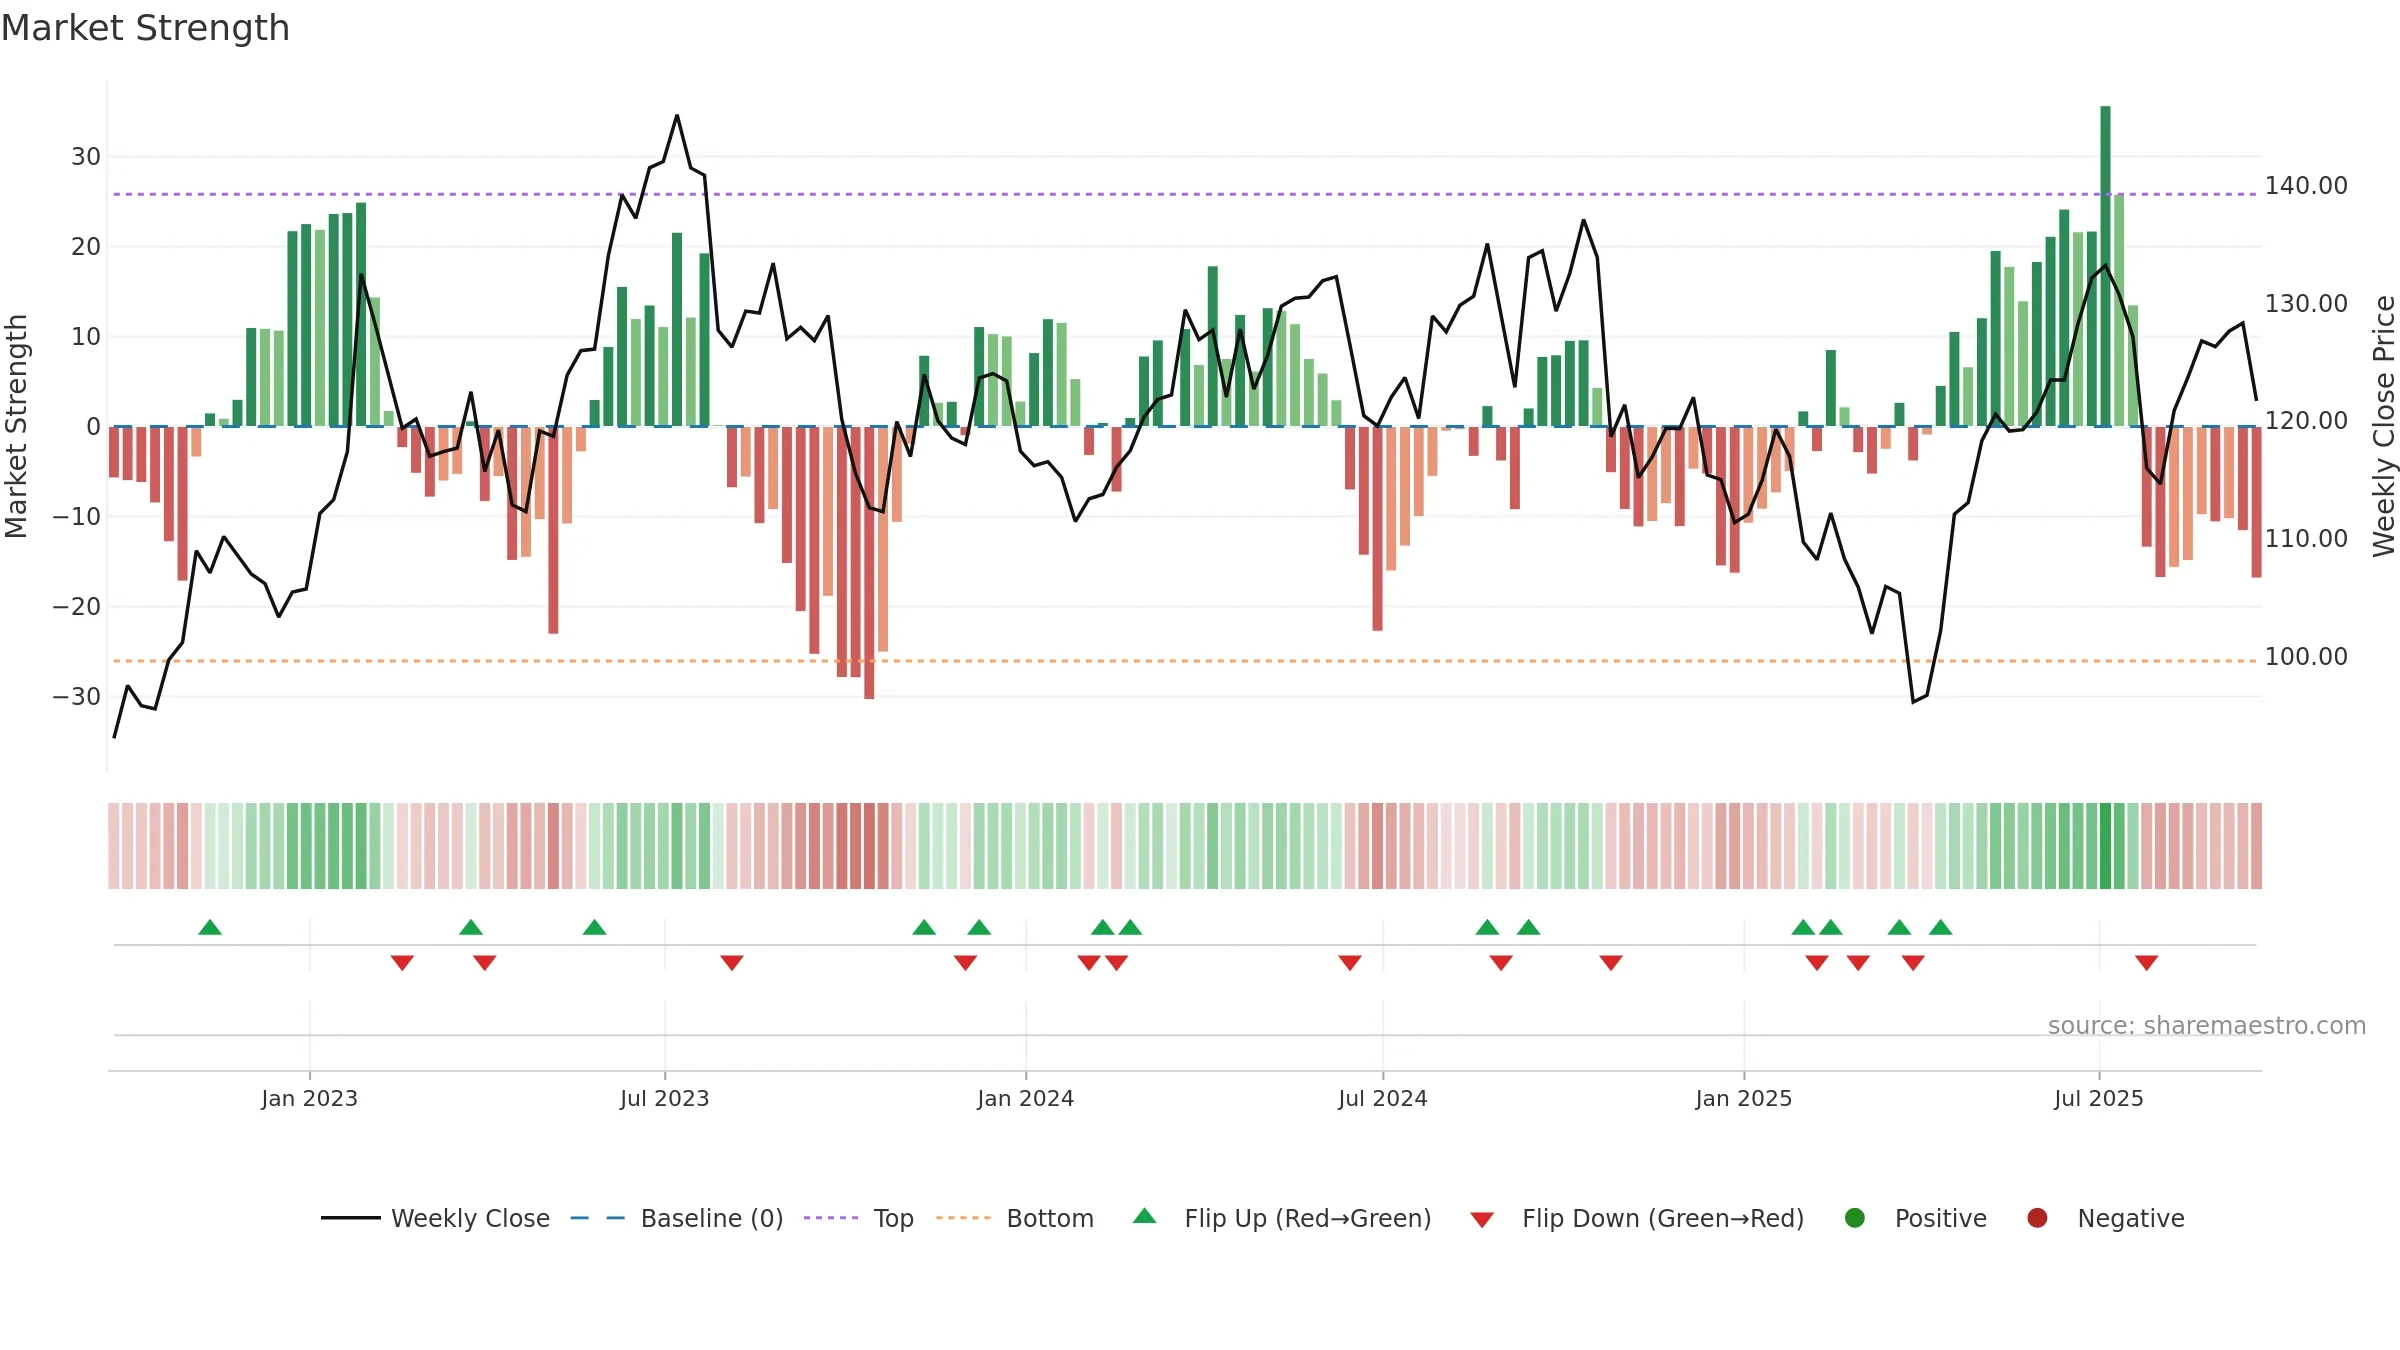
Gauge maps the trend signal to a 0–100 scale.
How to read this — Gauge is elevated but momentum is rolling over; topping risk is rising. Notable breakdown from ≥0.80 weakens trend quality.
Stay alert: protect gains or seek confirmation before adding risk.

Relative strength is Negative
(< 0%, underperforming).
Latest MRS: -3.93% (week ending Fri, 19 Sep 2025).
Slope: Rising over 8w.
Notes:
- Below zero line indicates relative weakness vs benchmark.
- MRS slope rising over ~8 weeks.
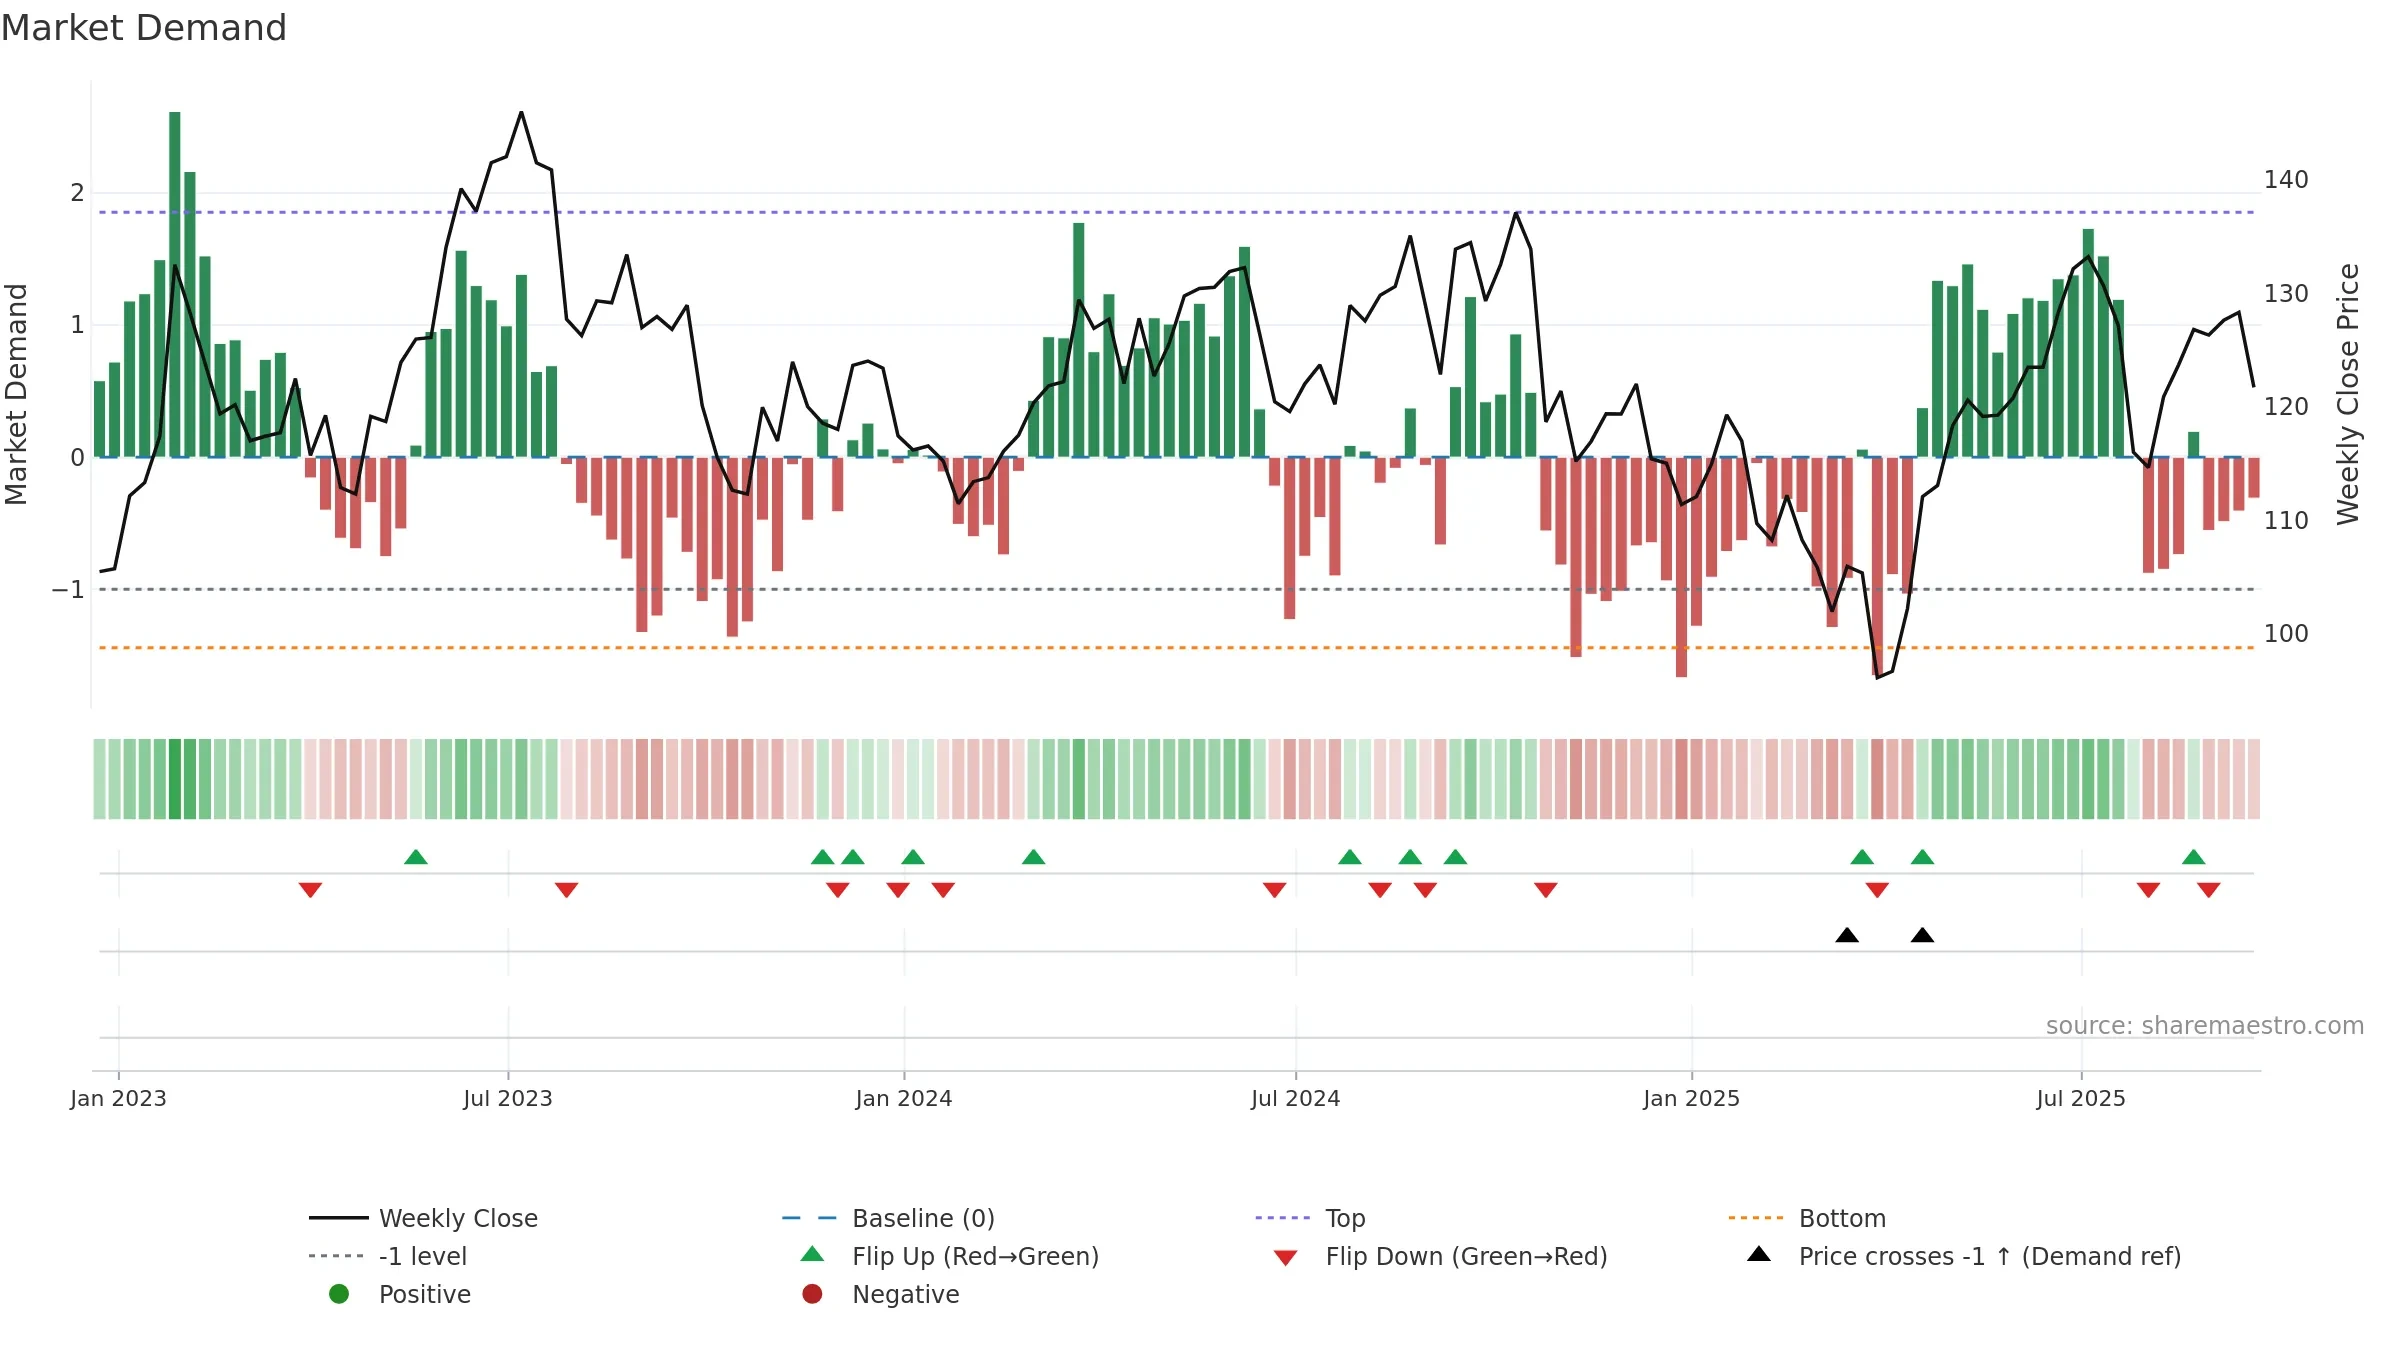
Price is below fair value; potential upside if momentum constructive.
Conclusion
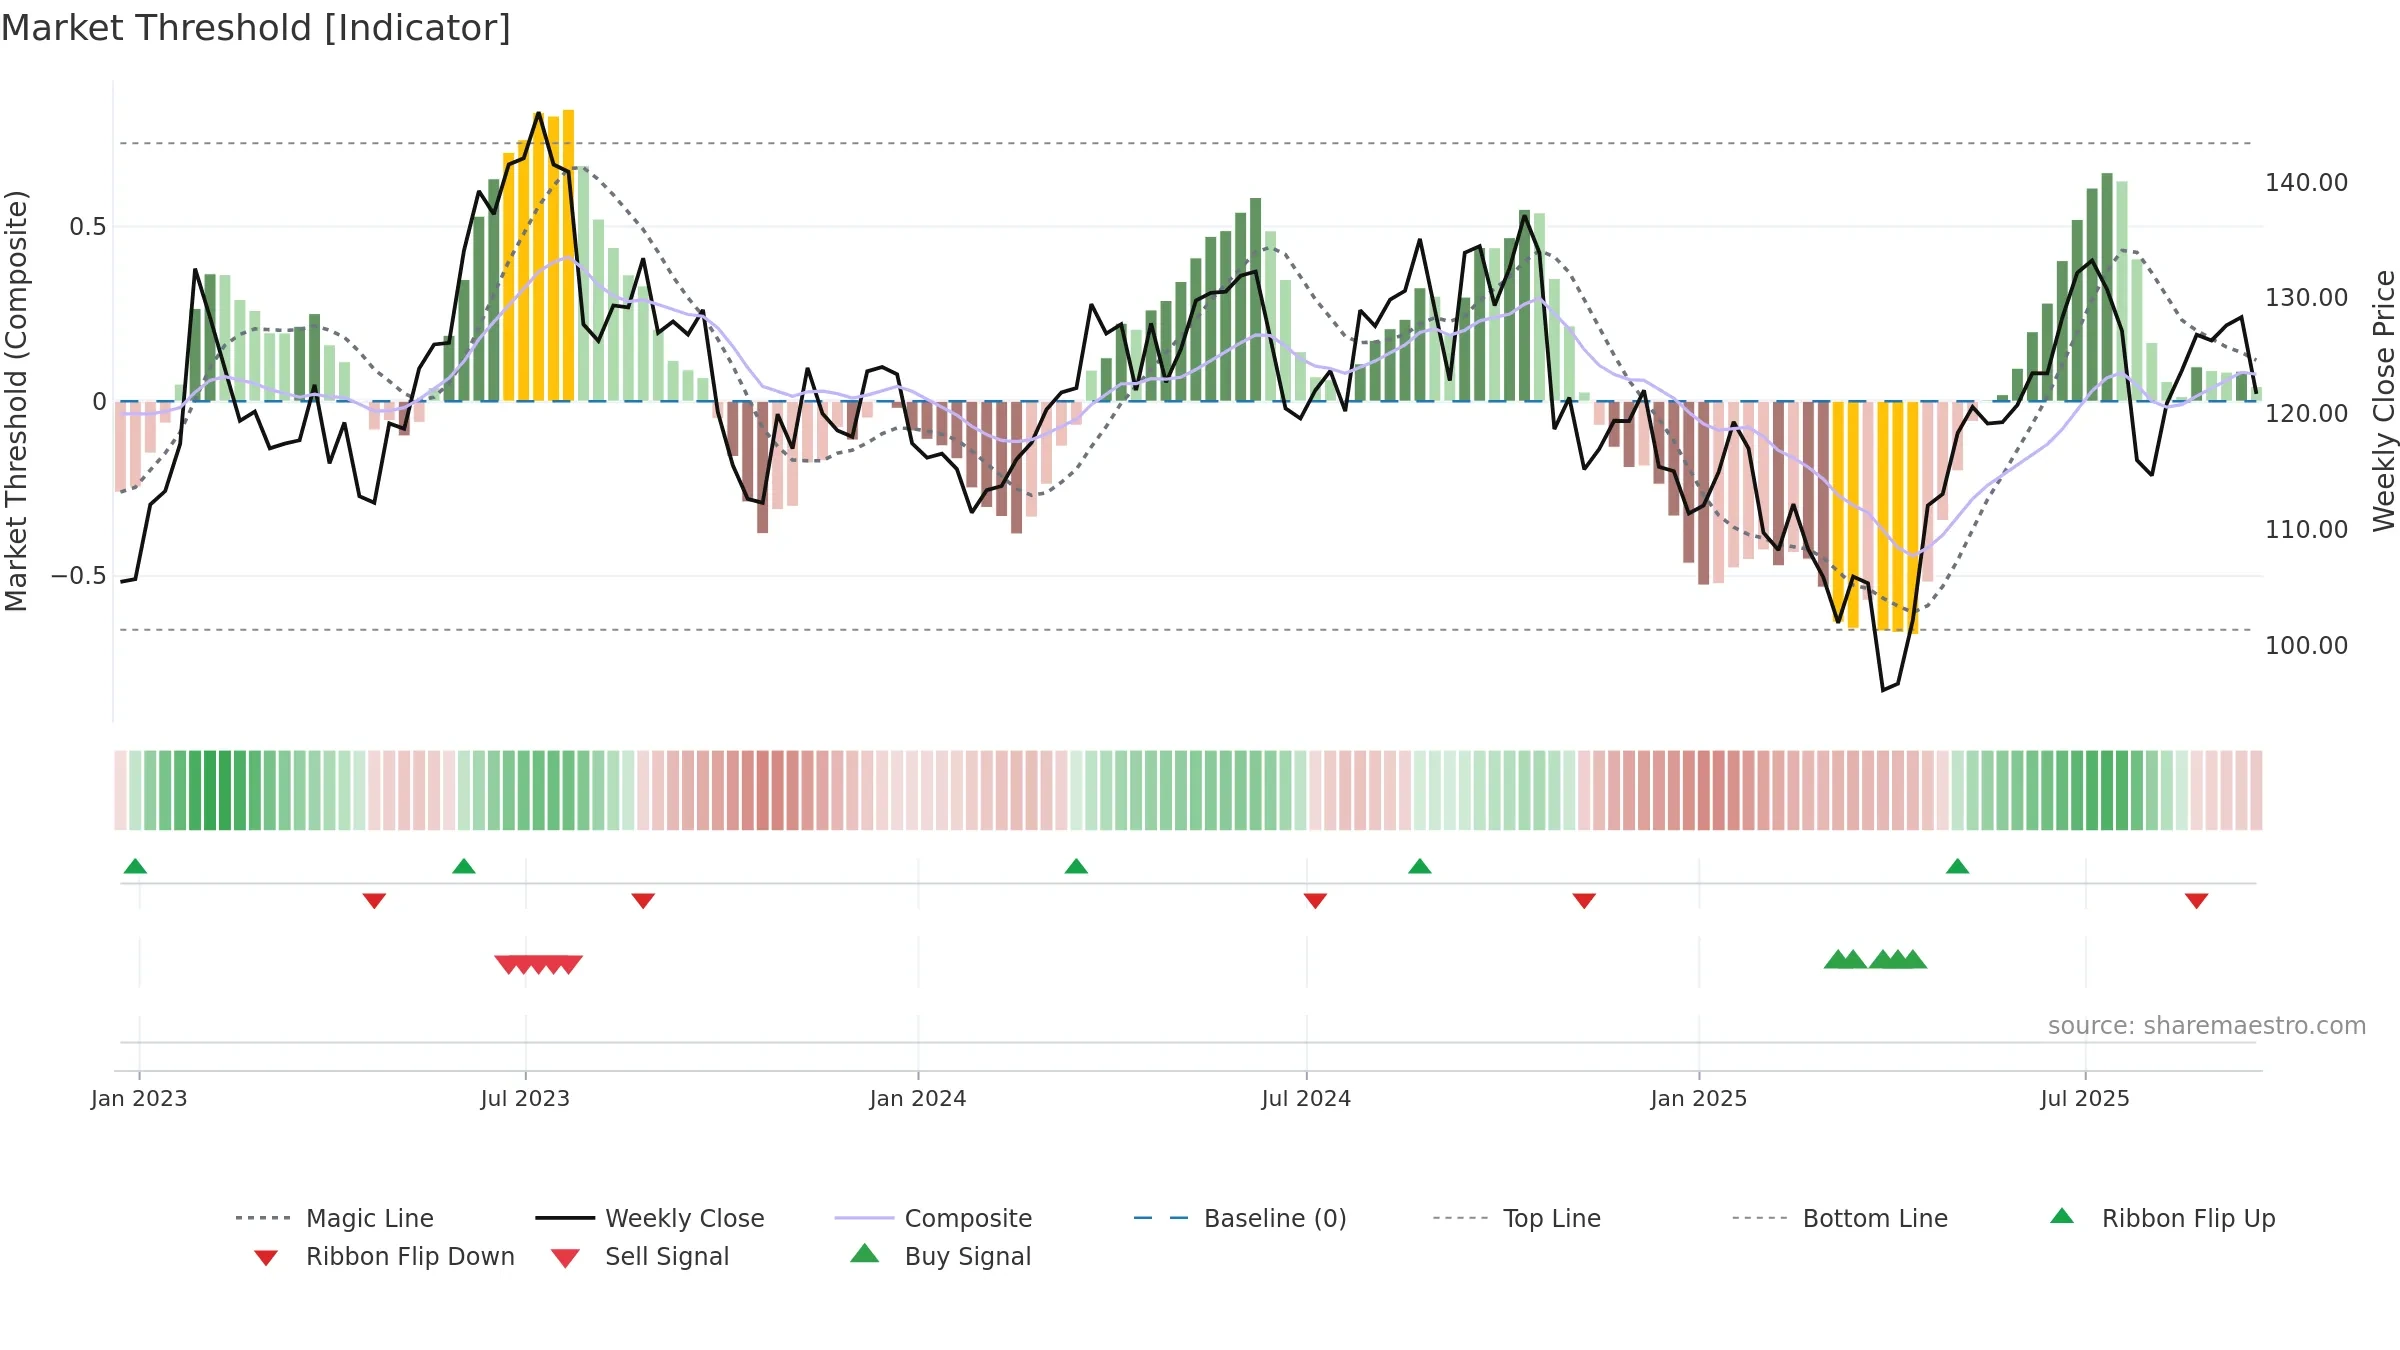
Negative setup. ★★⯪☆☆ confidence. Trend: Uptrend at Risk · 6.16% over window · vol 1.15% · liquidity convergence · posture mixed · leaning negative
- Liquidity confirms the price trend
- Low return volatility supports durability
- High level but momentum rolling over (topping risk)
- Momentum is weak/falling
- Price is not above key averages
- Recent breakdown from ≥0.80 weakens trend quality
Why: Price window 6.16% over w. Close is -5.16% below the prior-window high. Return volatility 1.15%. Volume trend rising. Liquidity convergence with price. Trend state uptrend at risk. Momentum neutral and falling. Valuation supportive skew.
Tip: Most metrics include a hover tooltip where they appear in the report.