Woodside Energy Group Ltd
WDS ASX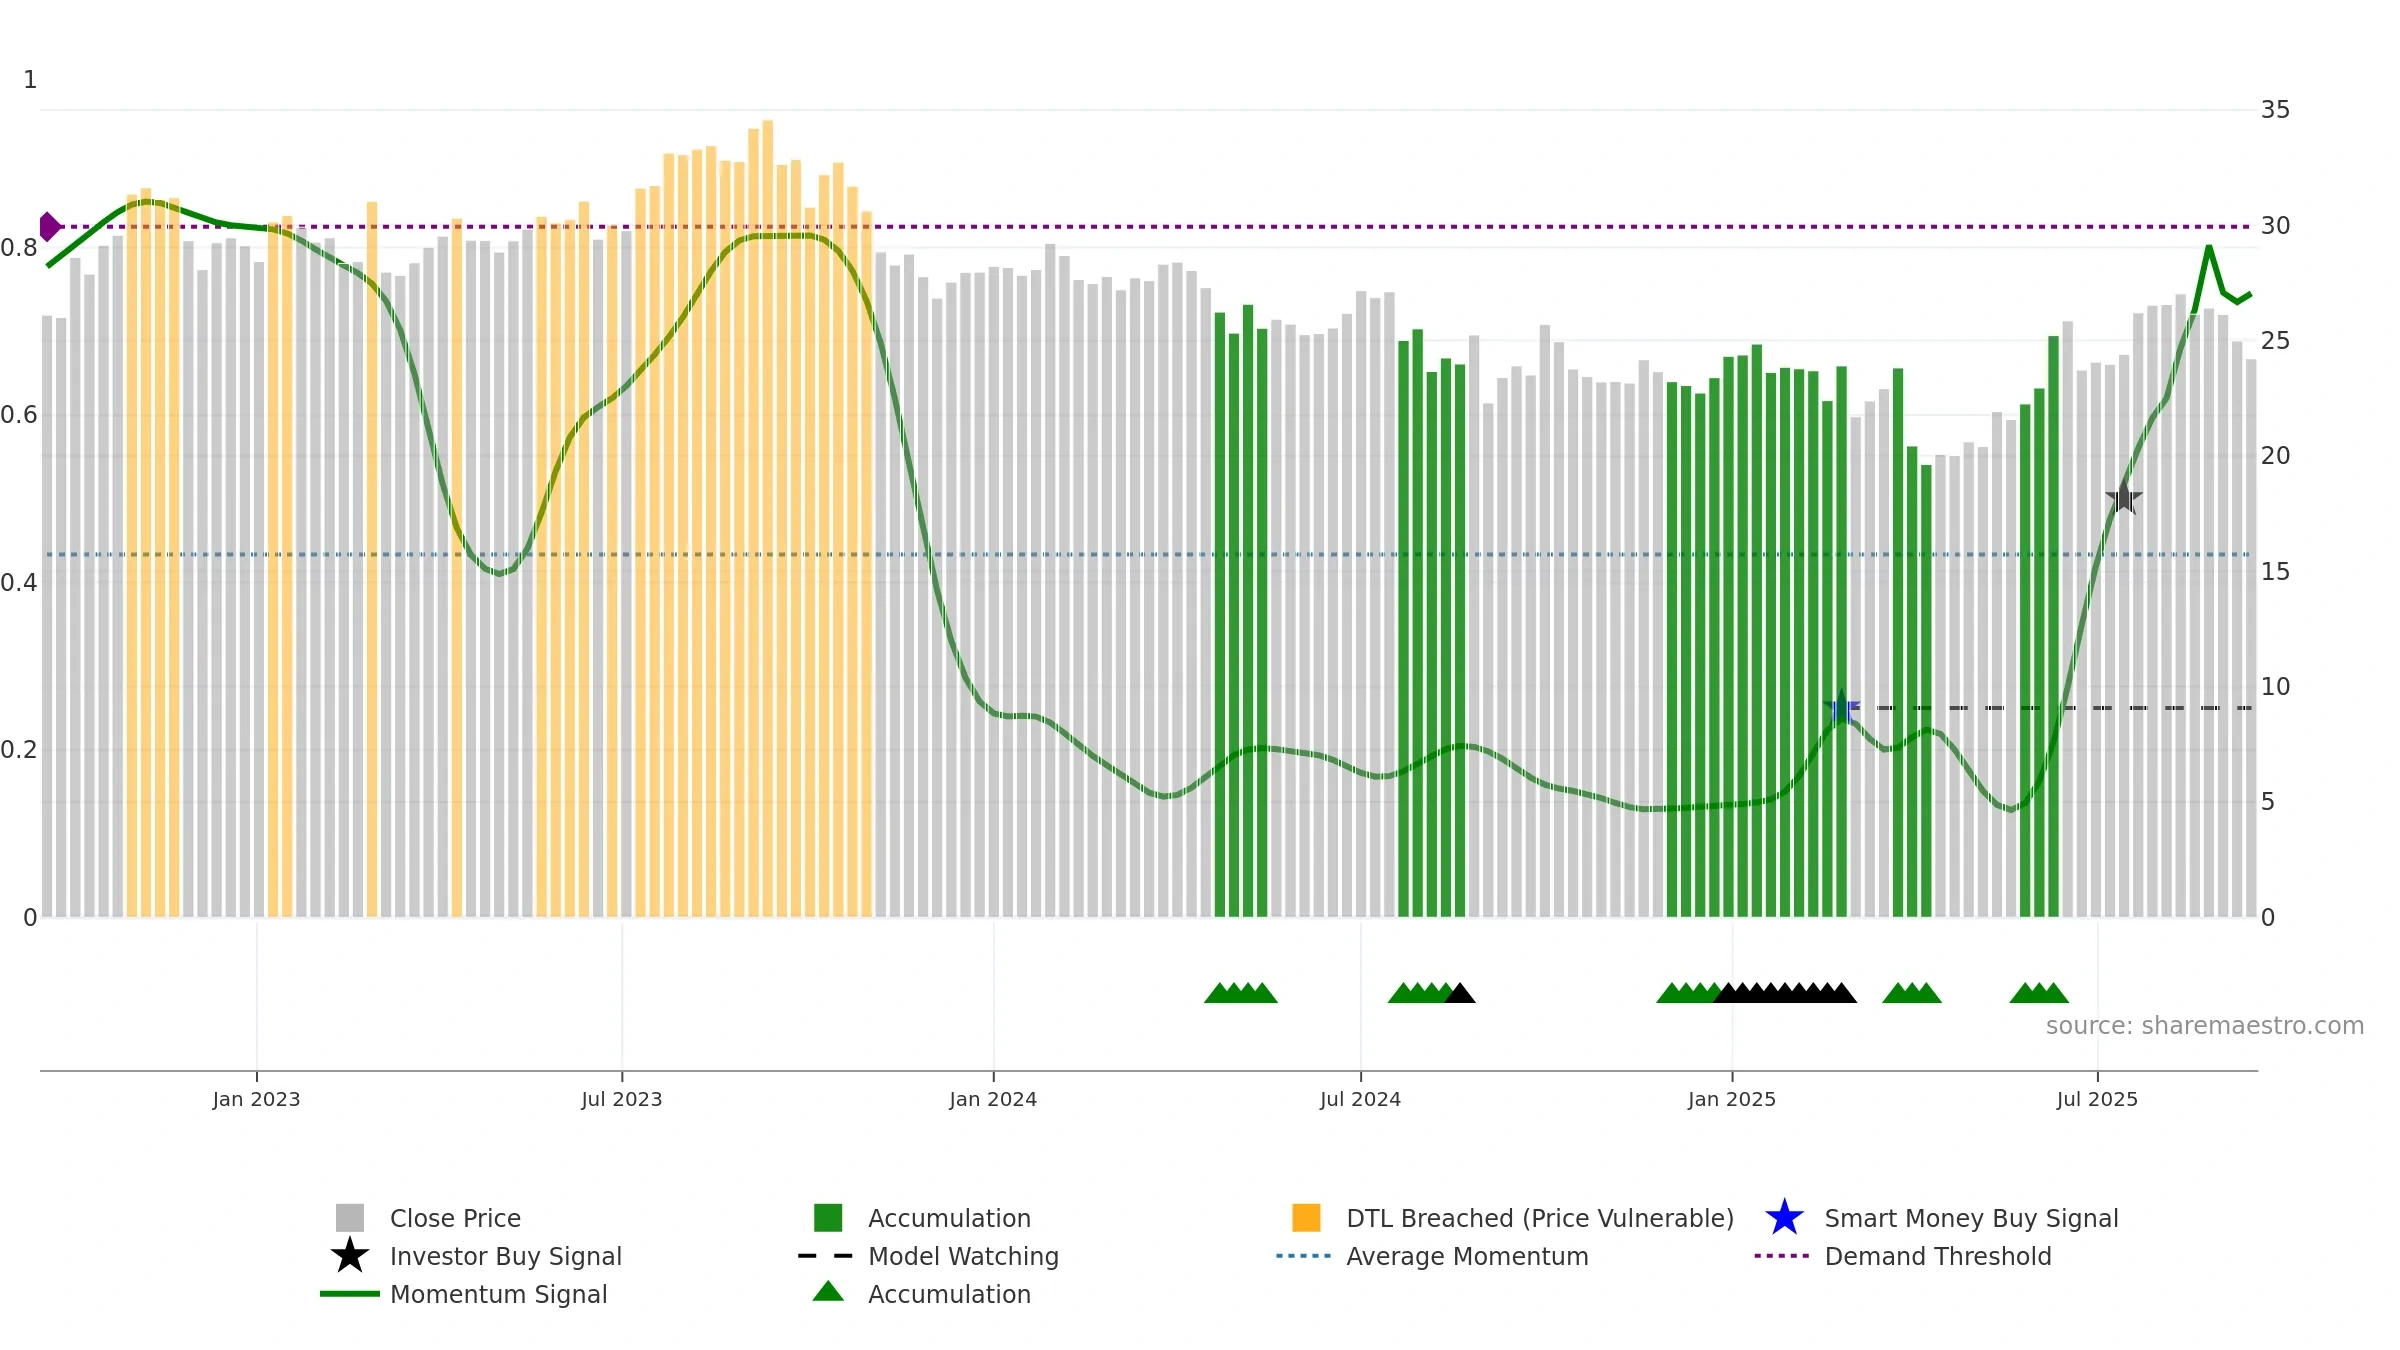
Weekly Report
Woodside Energy Group Ltd closed at 24.2100 (-0.16% WoW) . Data window ends Mon, 15 Sep 2025.
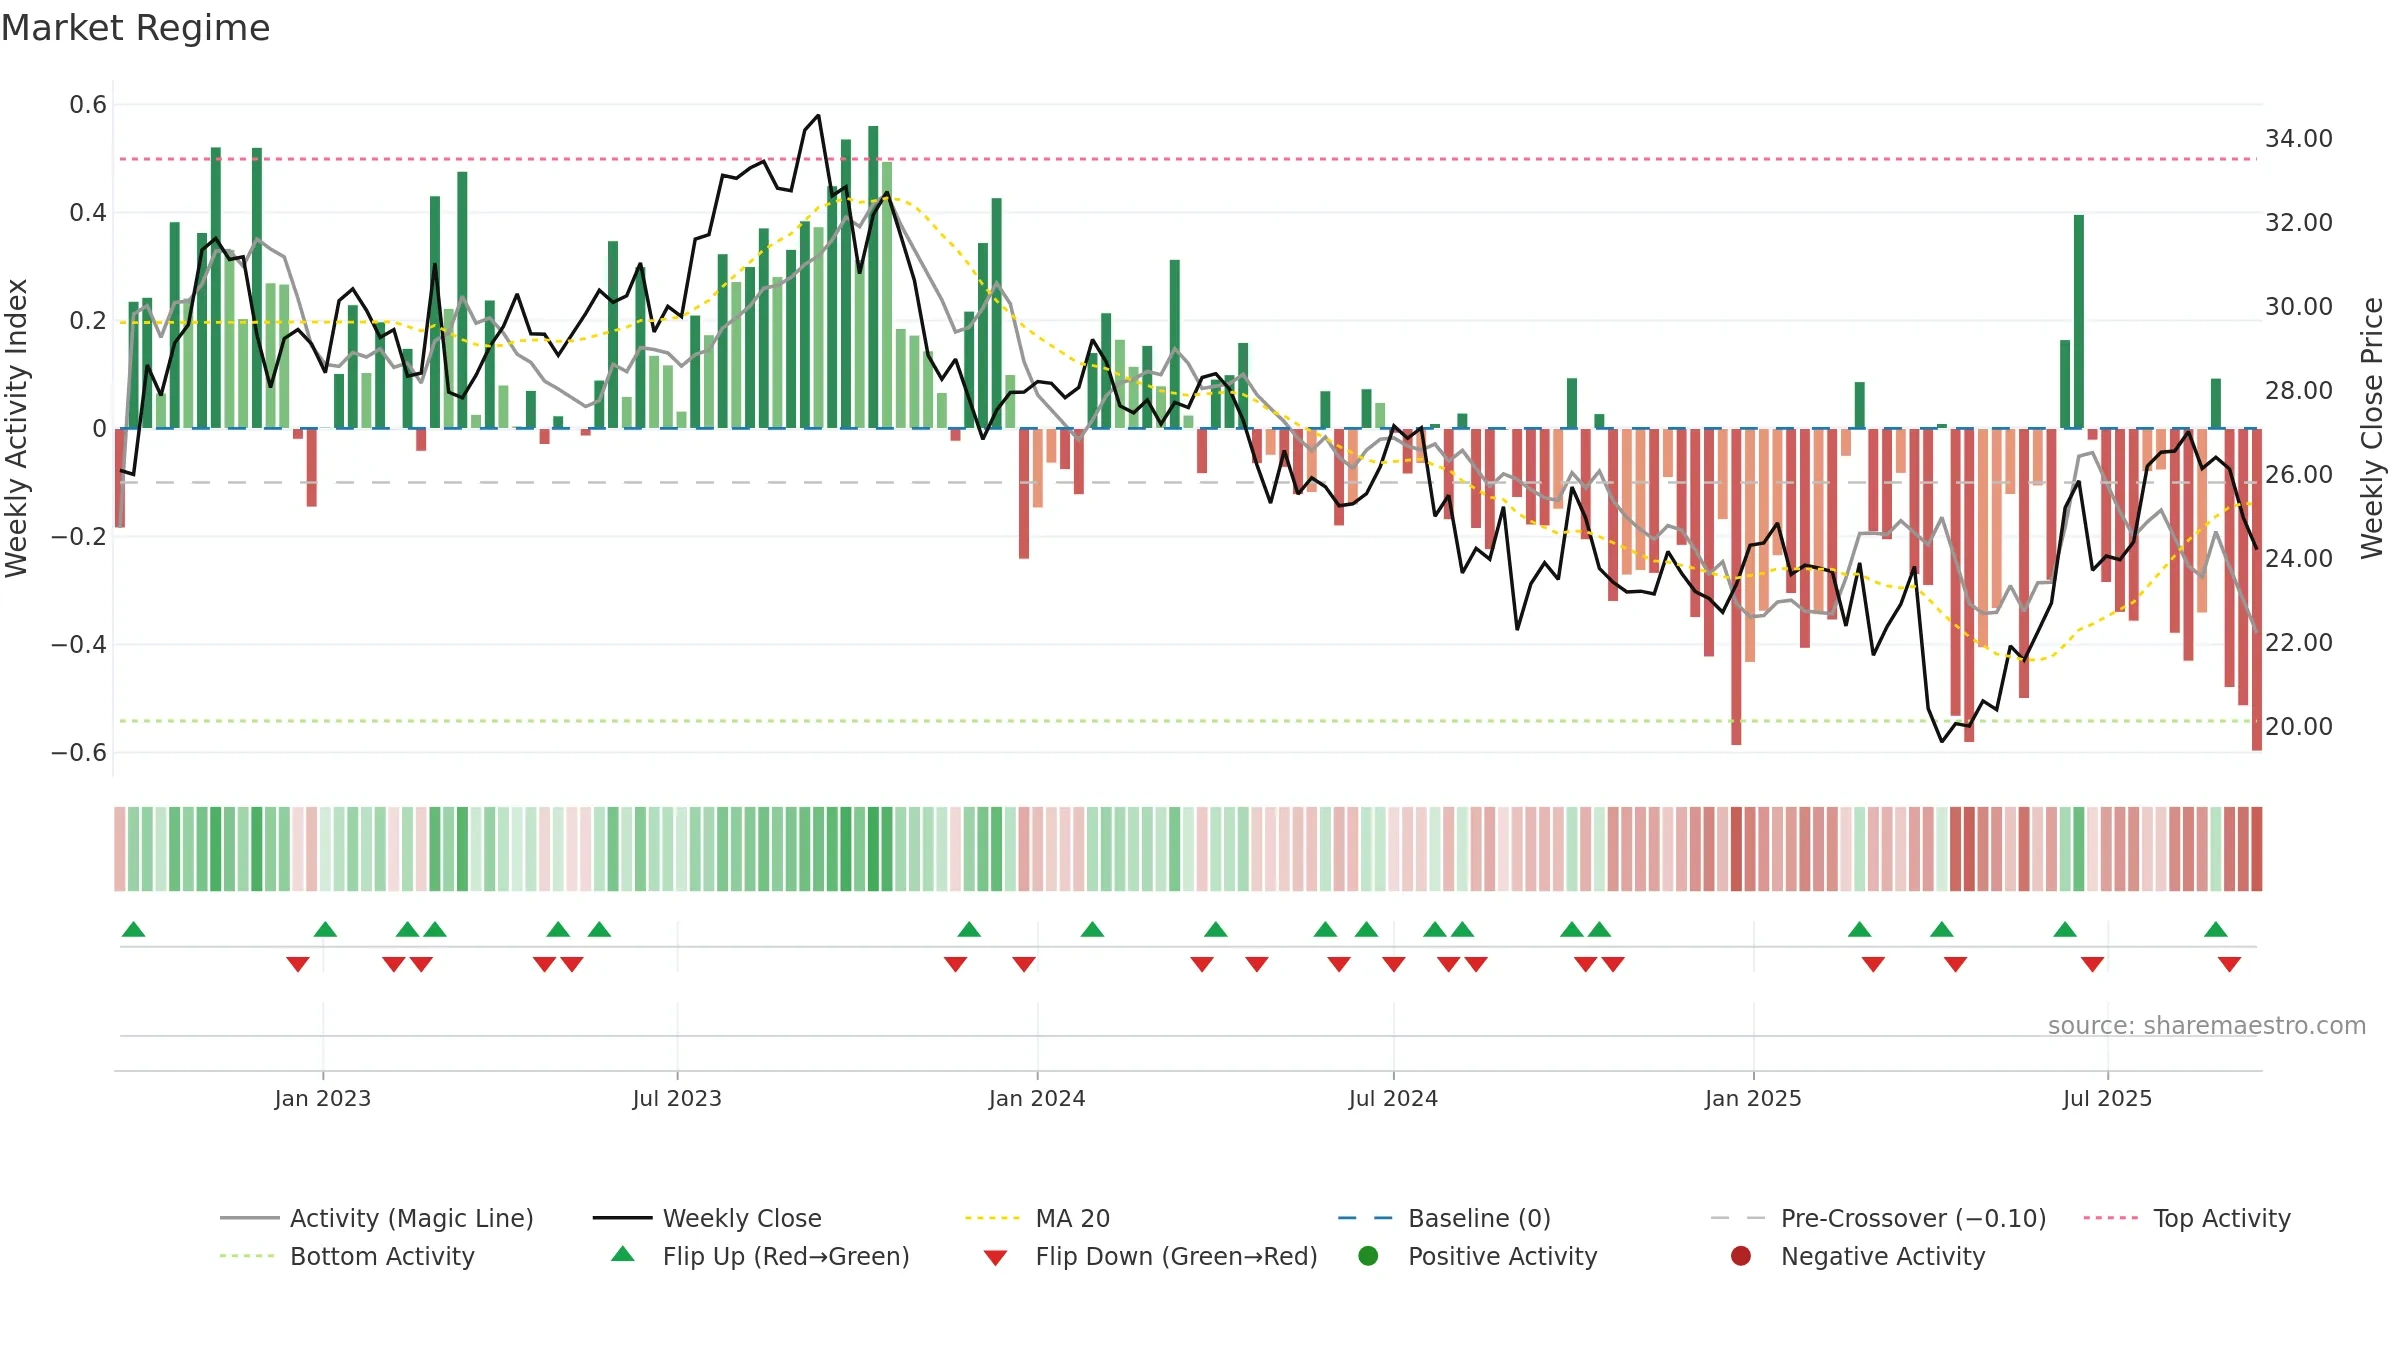
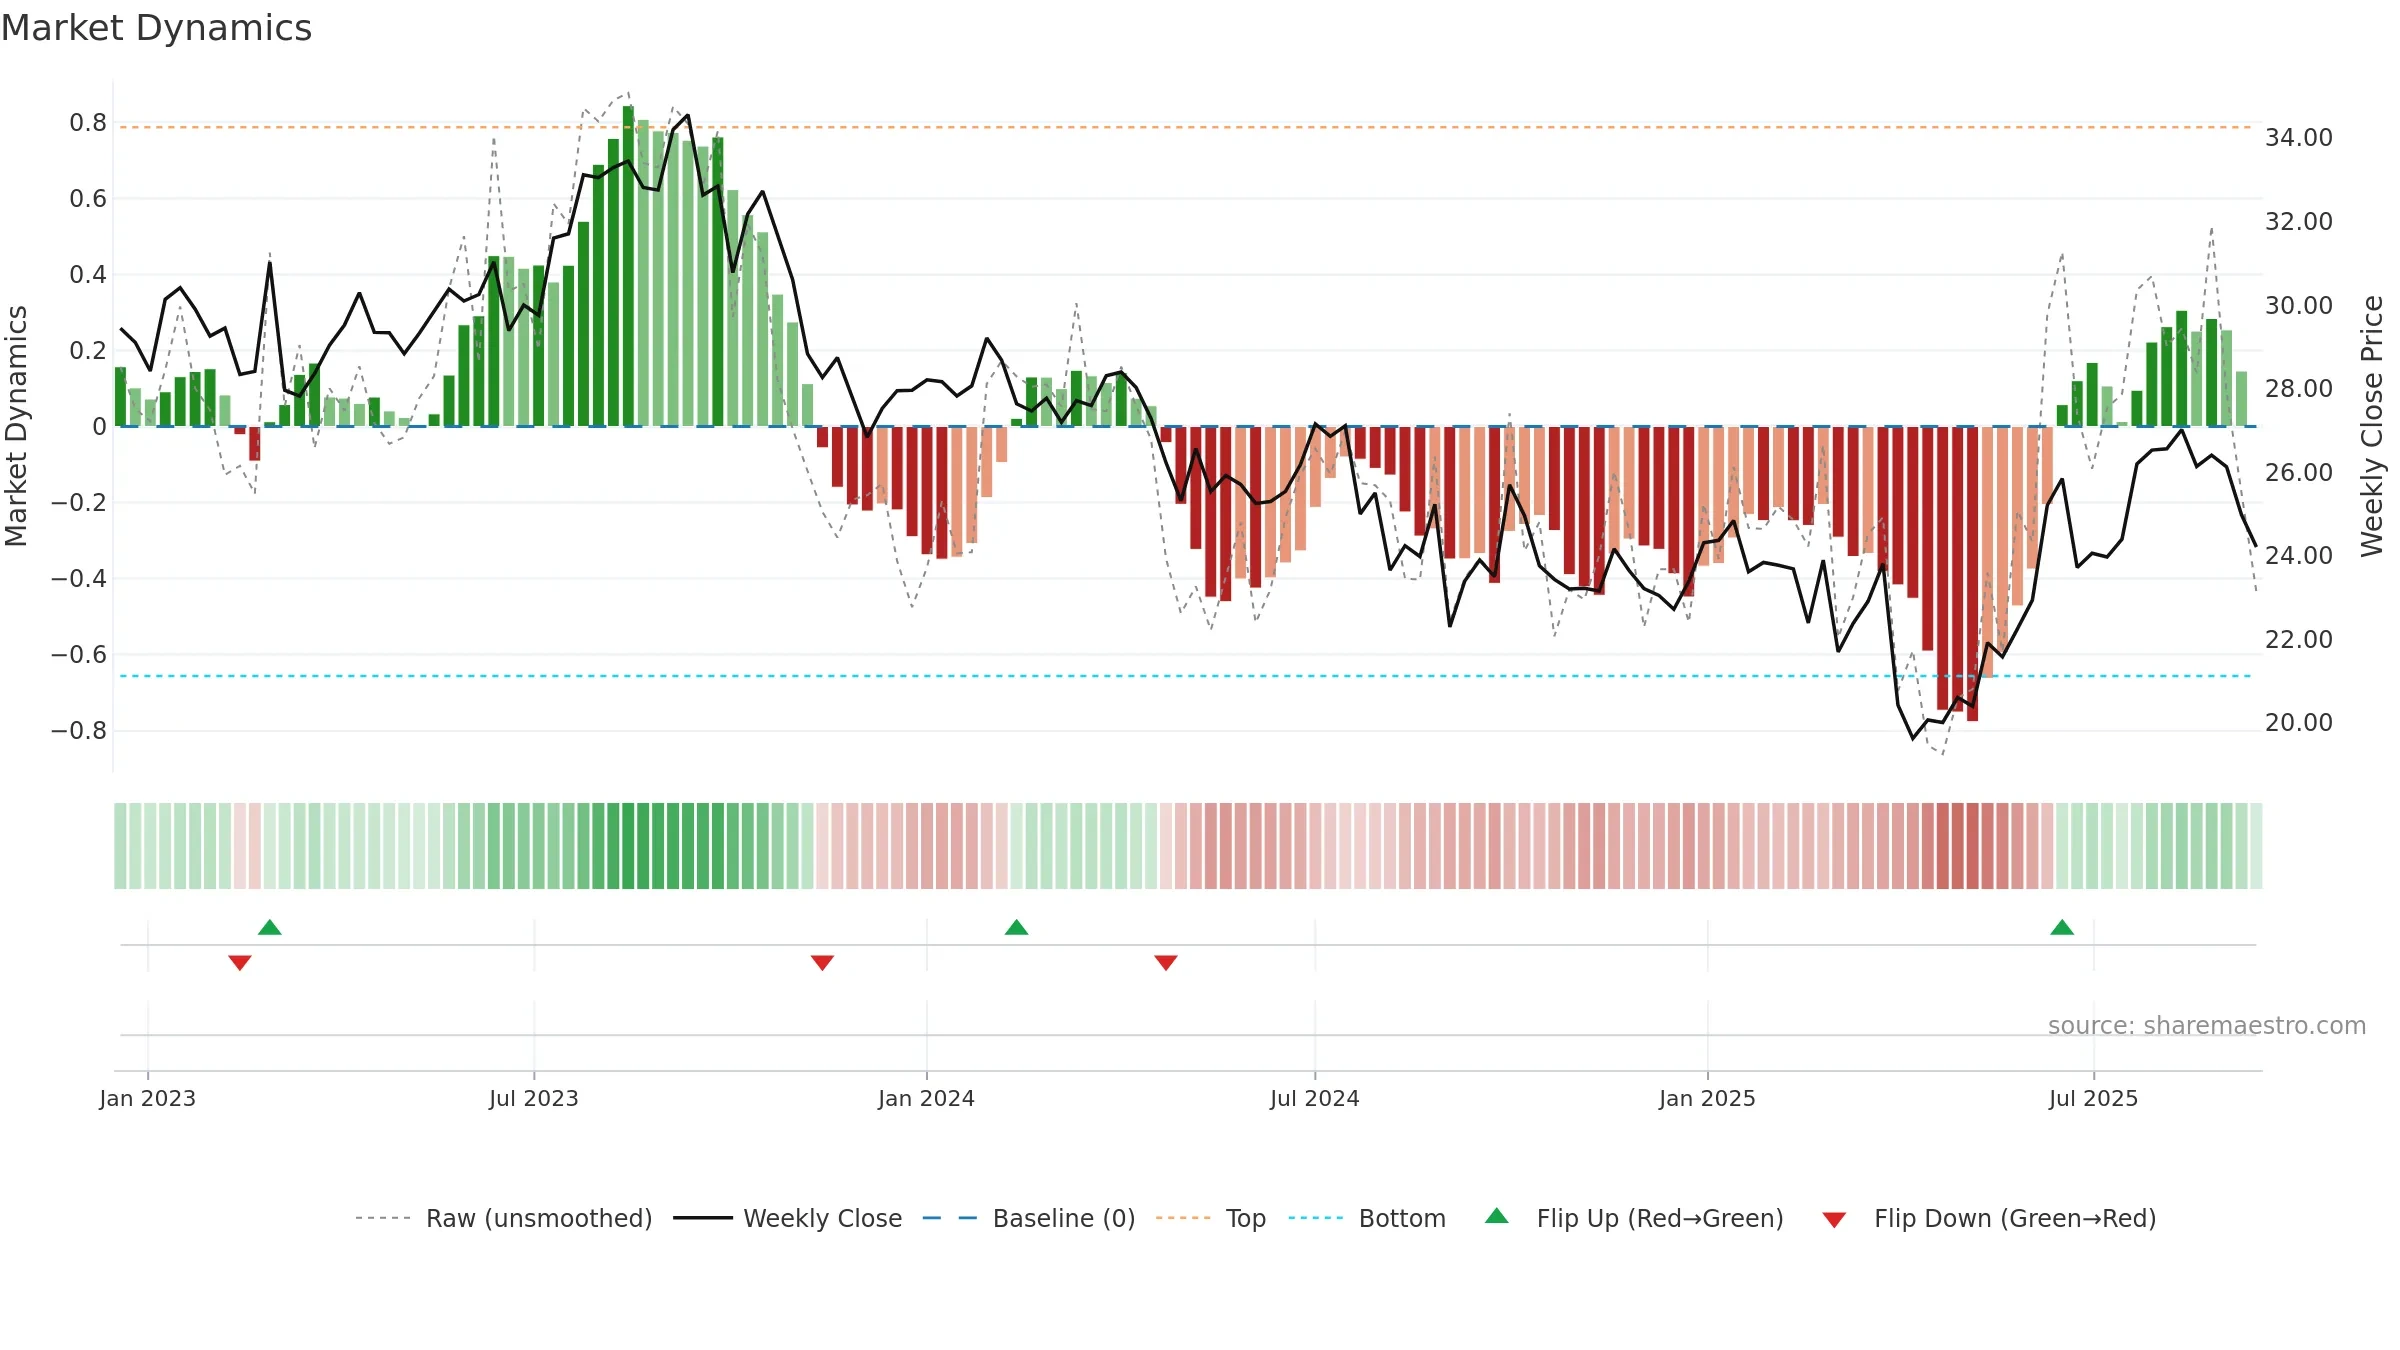
How to read this — Price slope is downward, indicating persistent supply pressure. Low weekly volatility favours steadier follow-through. Volume and price are moving in the same direction — a constructive confirmation. Distance to baseline is narrowing — reverting closer to its fair-value track.
Down-slope argues for patience; rallies can fade sooner unless participation improves.
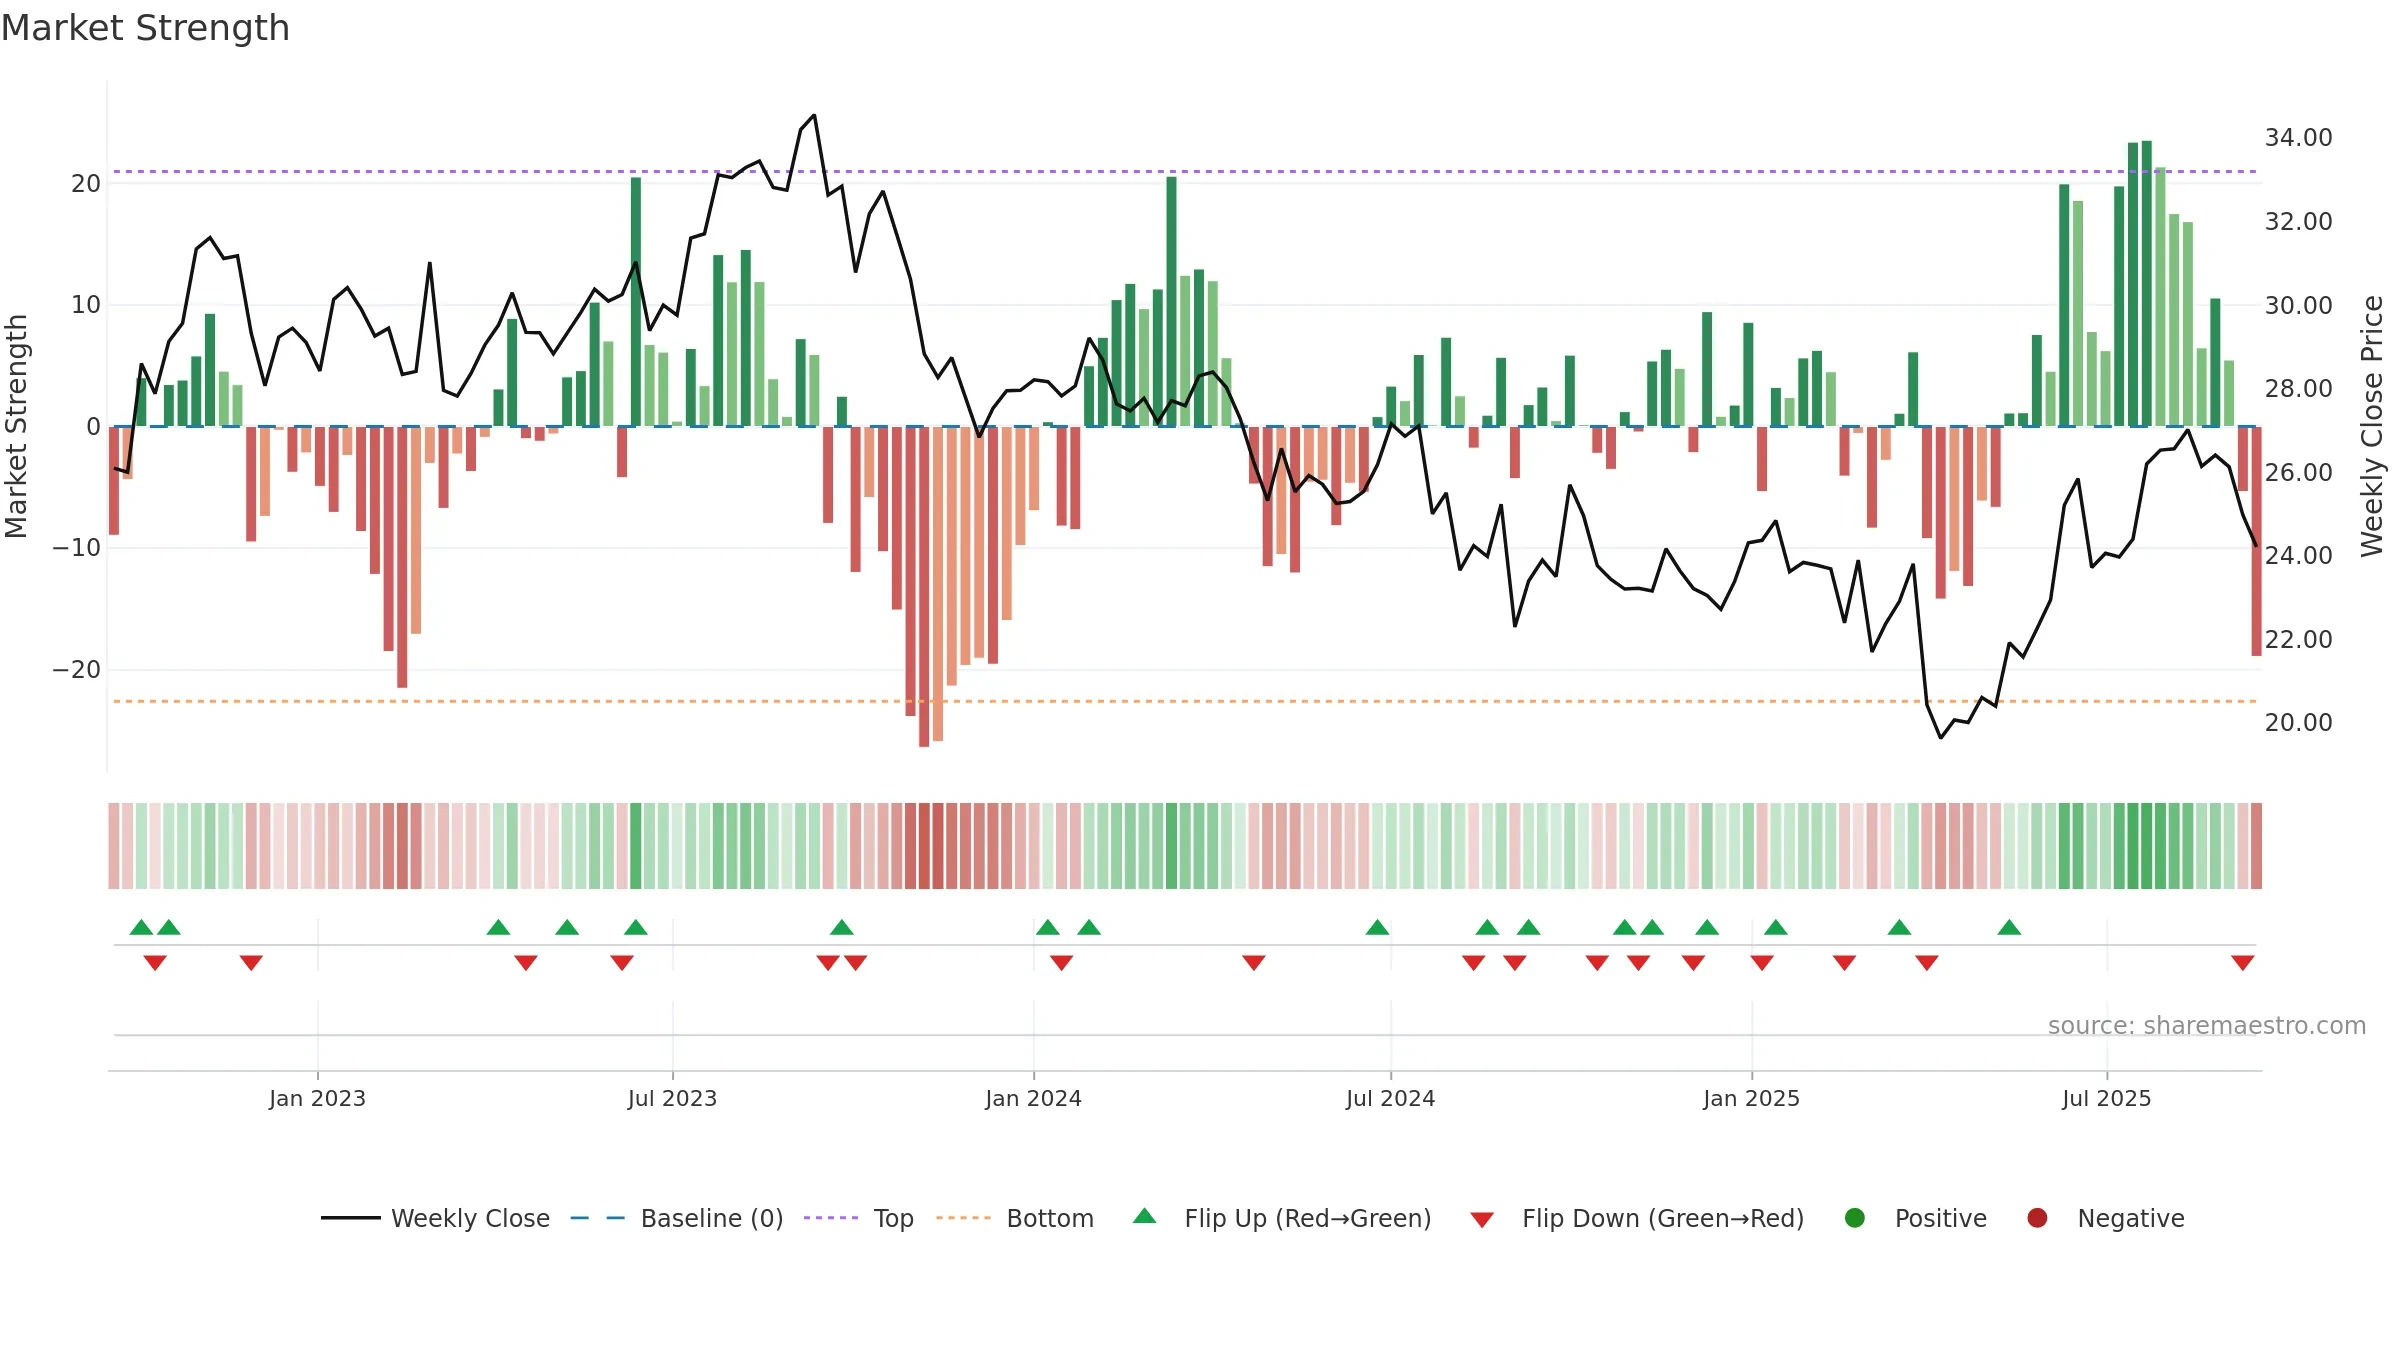
Gauge maps the trend signal to a 0–100 scale.
How to read this — Gauge is elevated but momentum is rolling over; topping risk is rising. Notable breakdown from ≥0.80 weakens trend quality.
Stay alert: protect gains or seek confirmation before adding risk.
The flag is positive: favourable upside skew with supportive conditions.
Conclusion
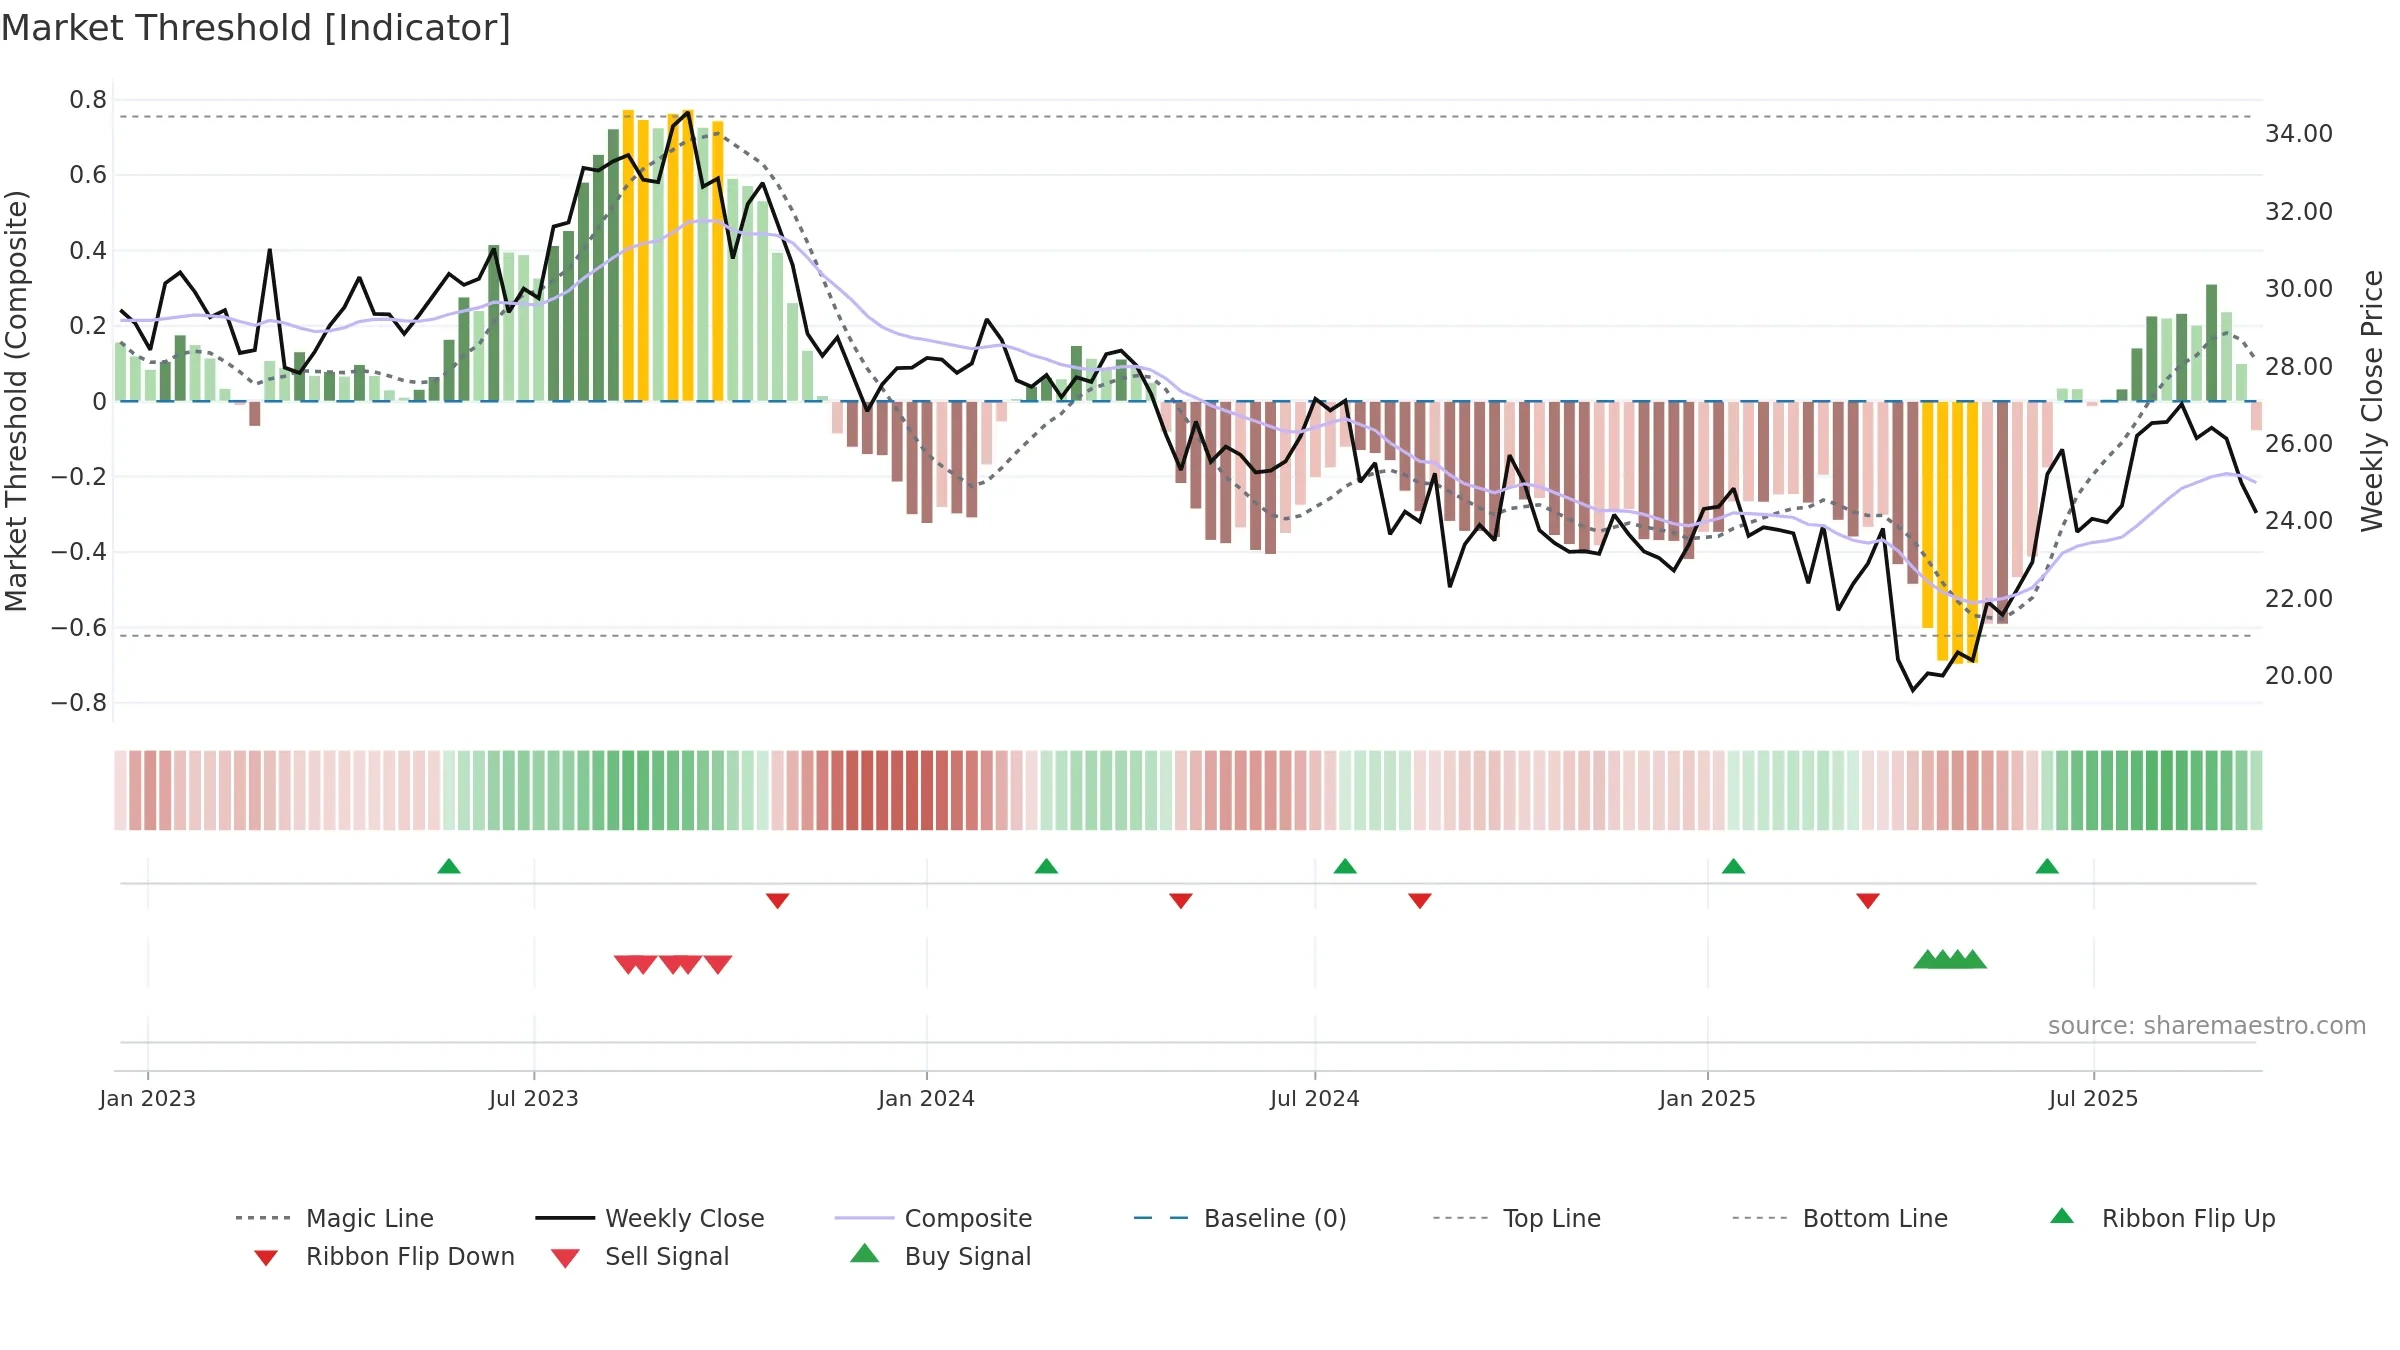
Neutral setup. ★★★☆☆ confidence. Price window: -8. Trend: Uptrend at Risk; gauge 74. In combination, liquidity confirms the move.
- Momentum is bullish and rising
- Liquidity confirms the price trend
- Low return volatility supports durability
- High-level but rolling over (topping risk)
- Price is not above key averages
- Negative multi-week performance
- Recent breakdown from ≥0.80 weakens trend quality
Why: Price window -8.74% over 8w. Close is -10.40% below the prior-window high. Return volatility 1.40%. Volume trend falling. Liquidity convergence with price. Trend state uptrend at risk. Momentum bullish and rising. Valuation stance positive.
Tip: Most metrics include a hover tooltip where they appear in the report.