Iris Clothings Limited
IRISDOREME NSE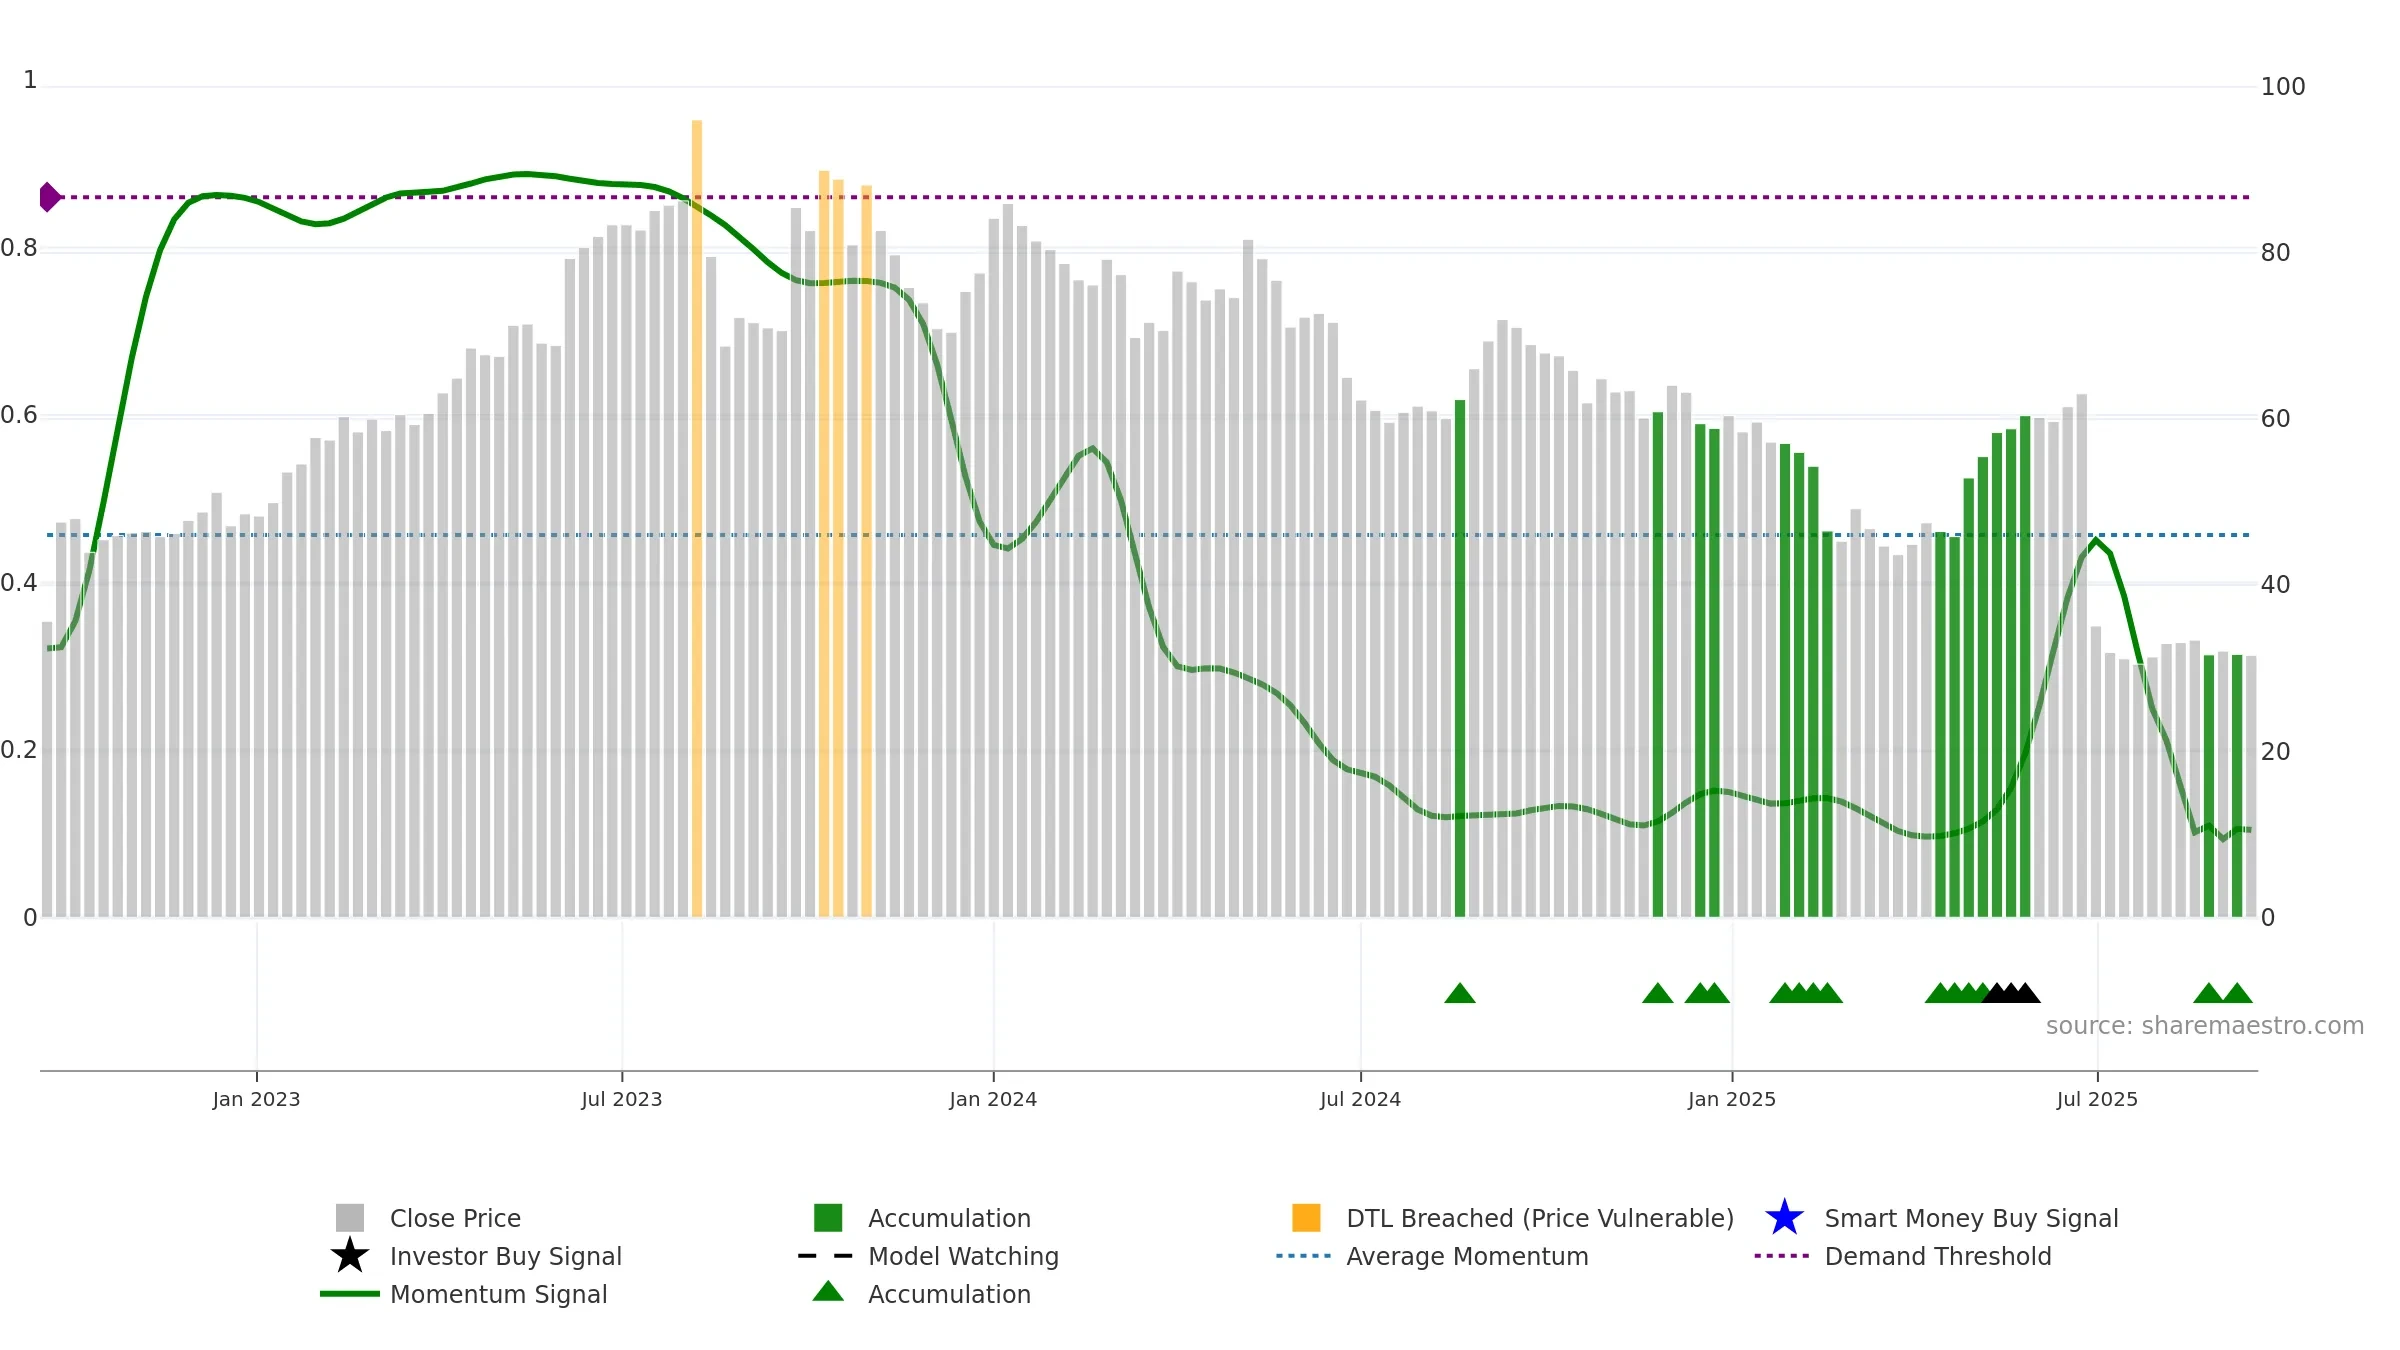
Weekly Report
Iris Clothings Limited closed at 31.5500 (1.77% WoW) . Data window ends Mon, 15 Sep 2025.
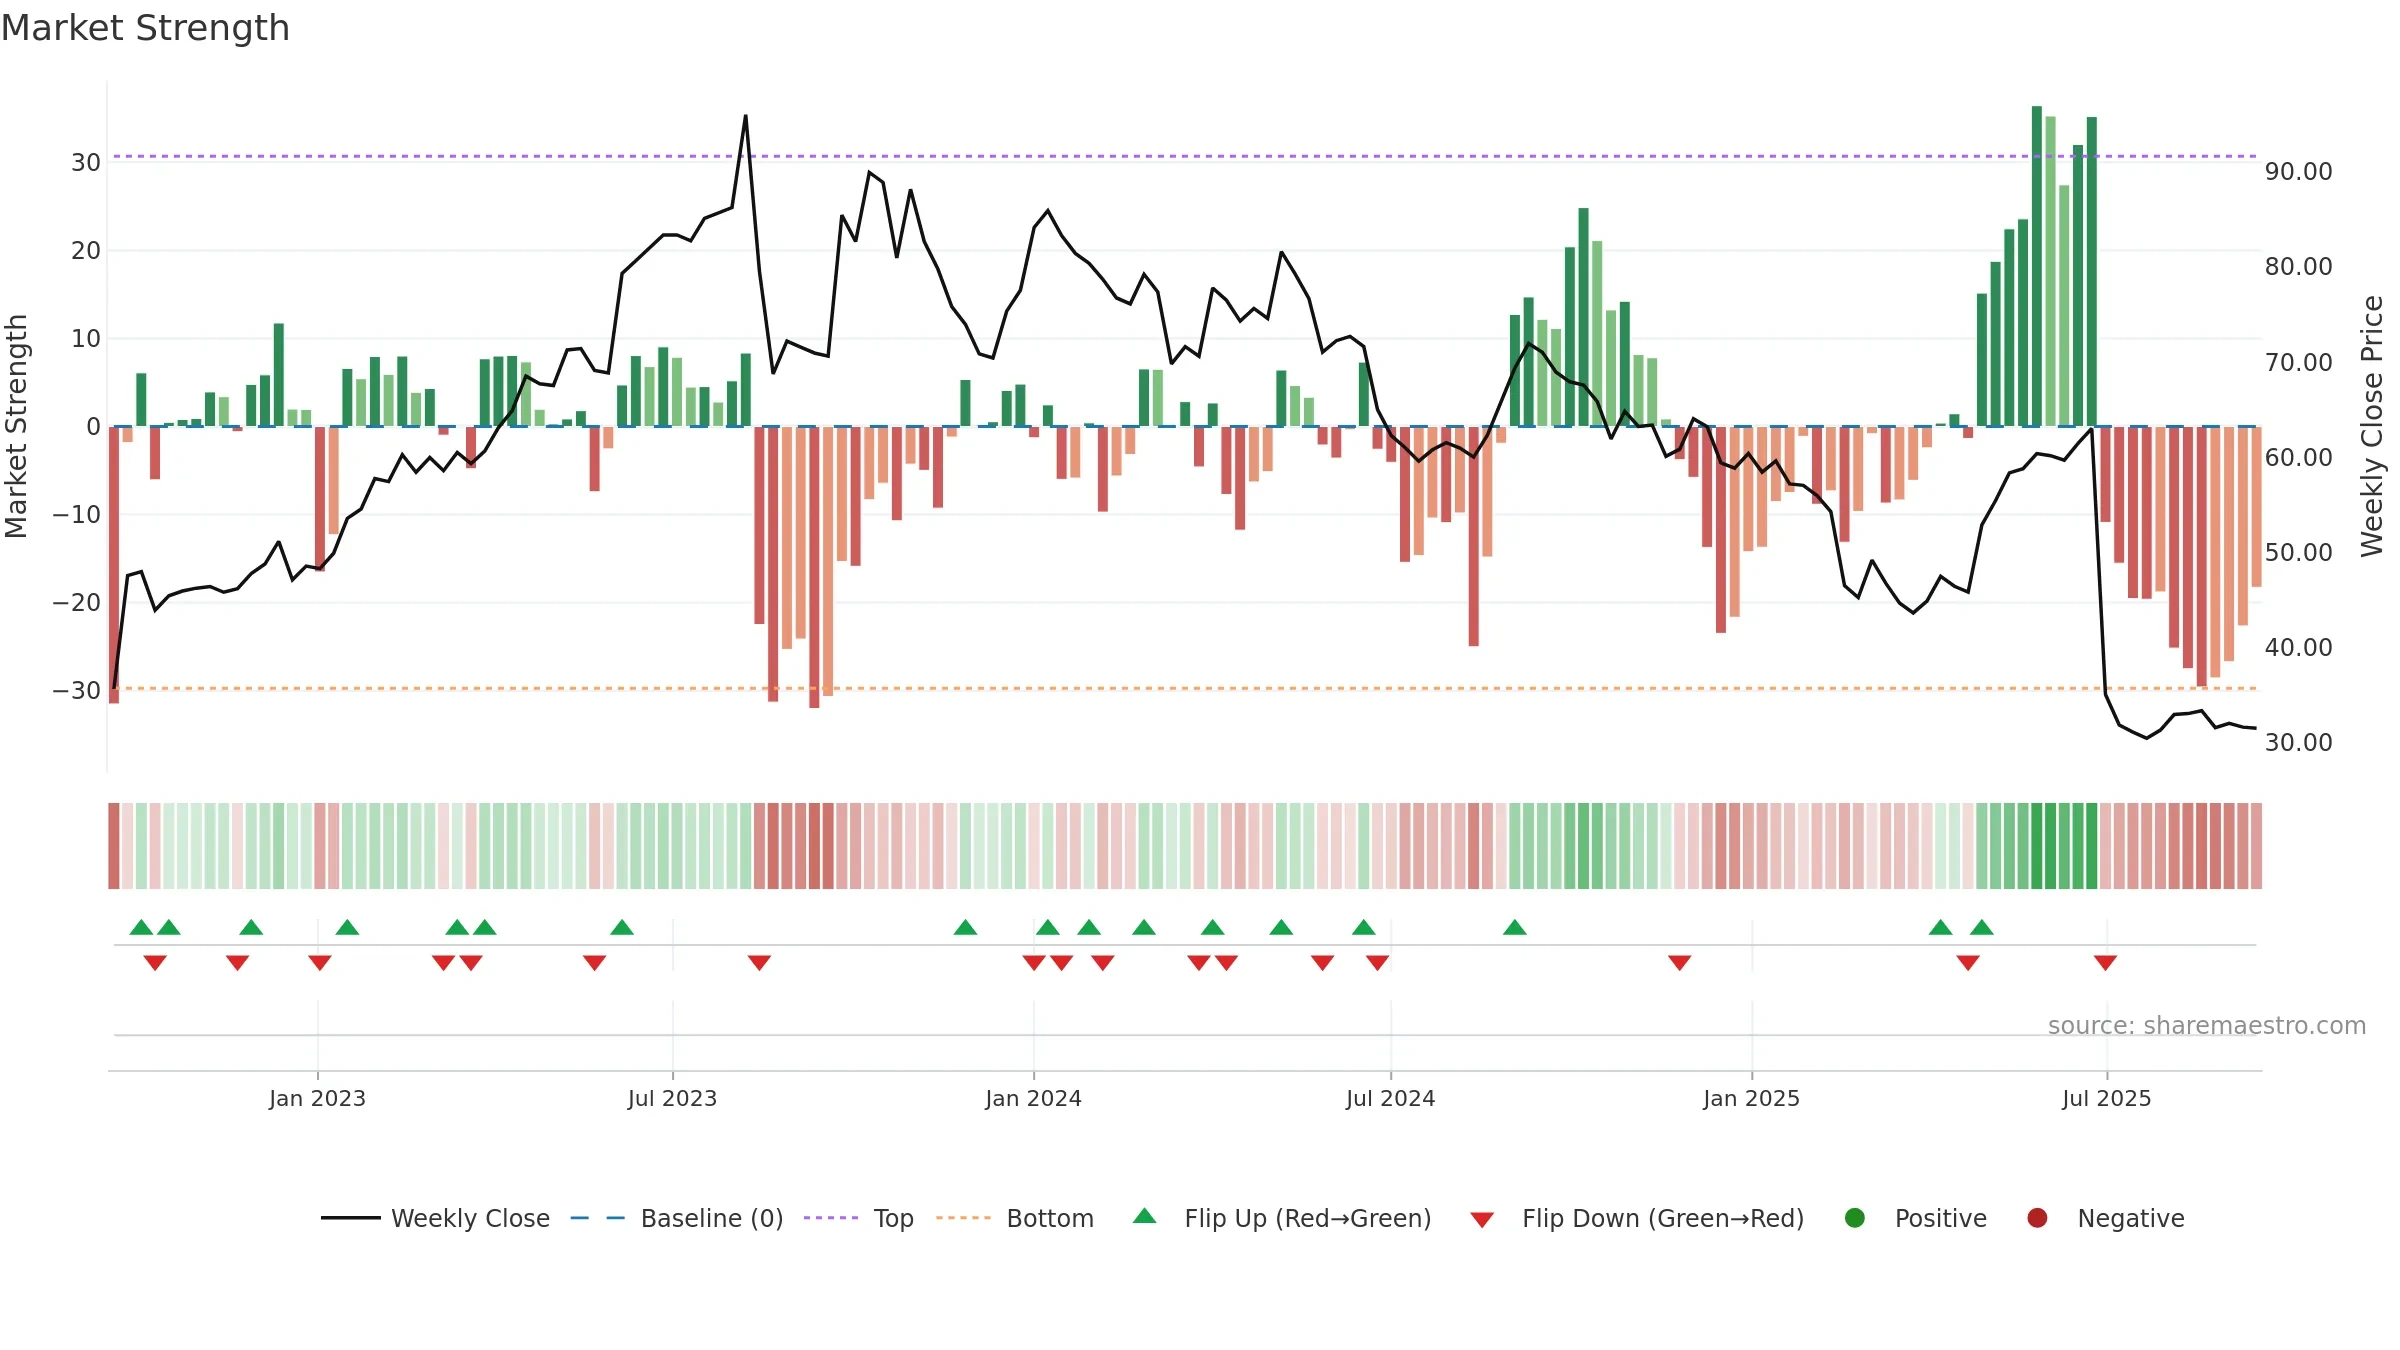
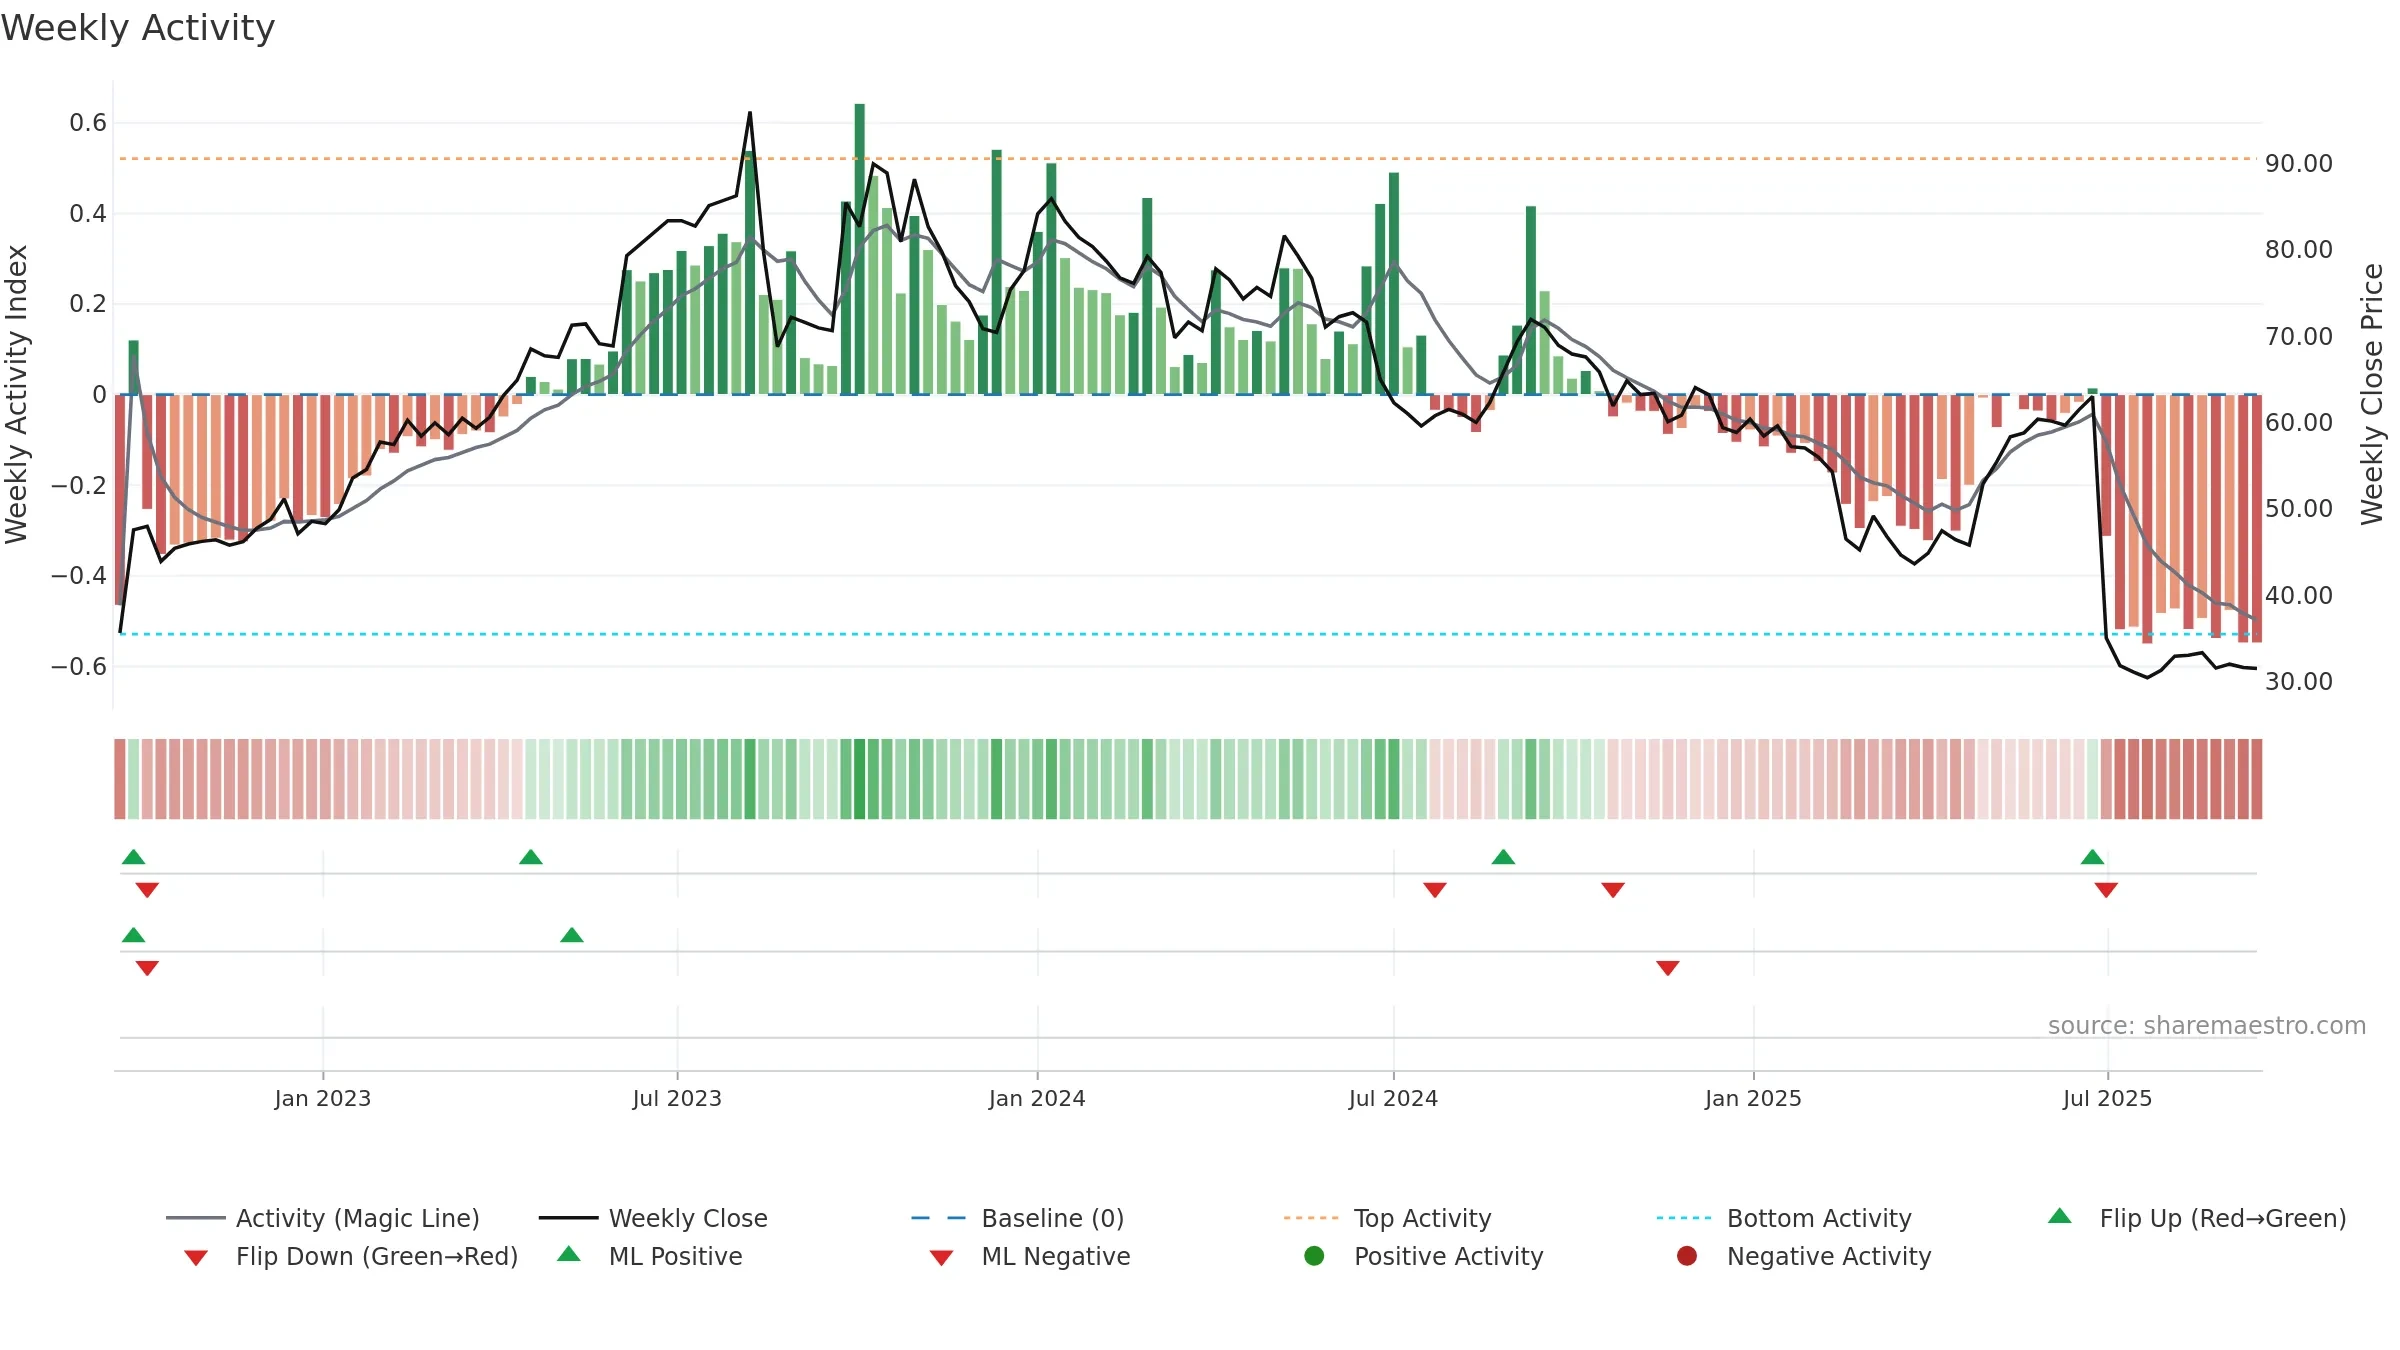
How to read this — Price slope is downward, indicating persistent supply pressure. Volume and price are moving in the same direction — a constructive confirmation. Returns are positively correlated with volume — strength tends to arrive on higher activity. Distance to baseline is narrowing — reverting closer to its fair-value track. Weak MA stack argues for caution; rallies can fail near the 8–13 week region. Fresh short-term downside crossover weakens near-term tone. Price sits below key averages, keeping pressure on the tape.
Down-slope argues for patience; rallies can fade sooner unless participation improves.
Gauge maps the trend signal to a 0–100 scale.
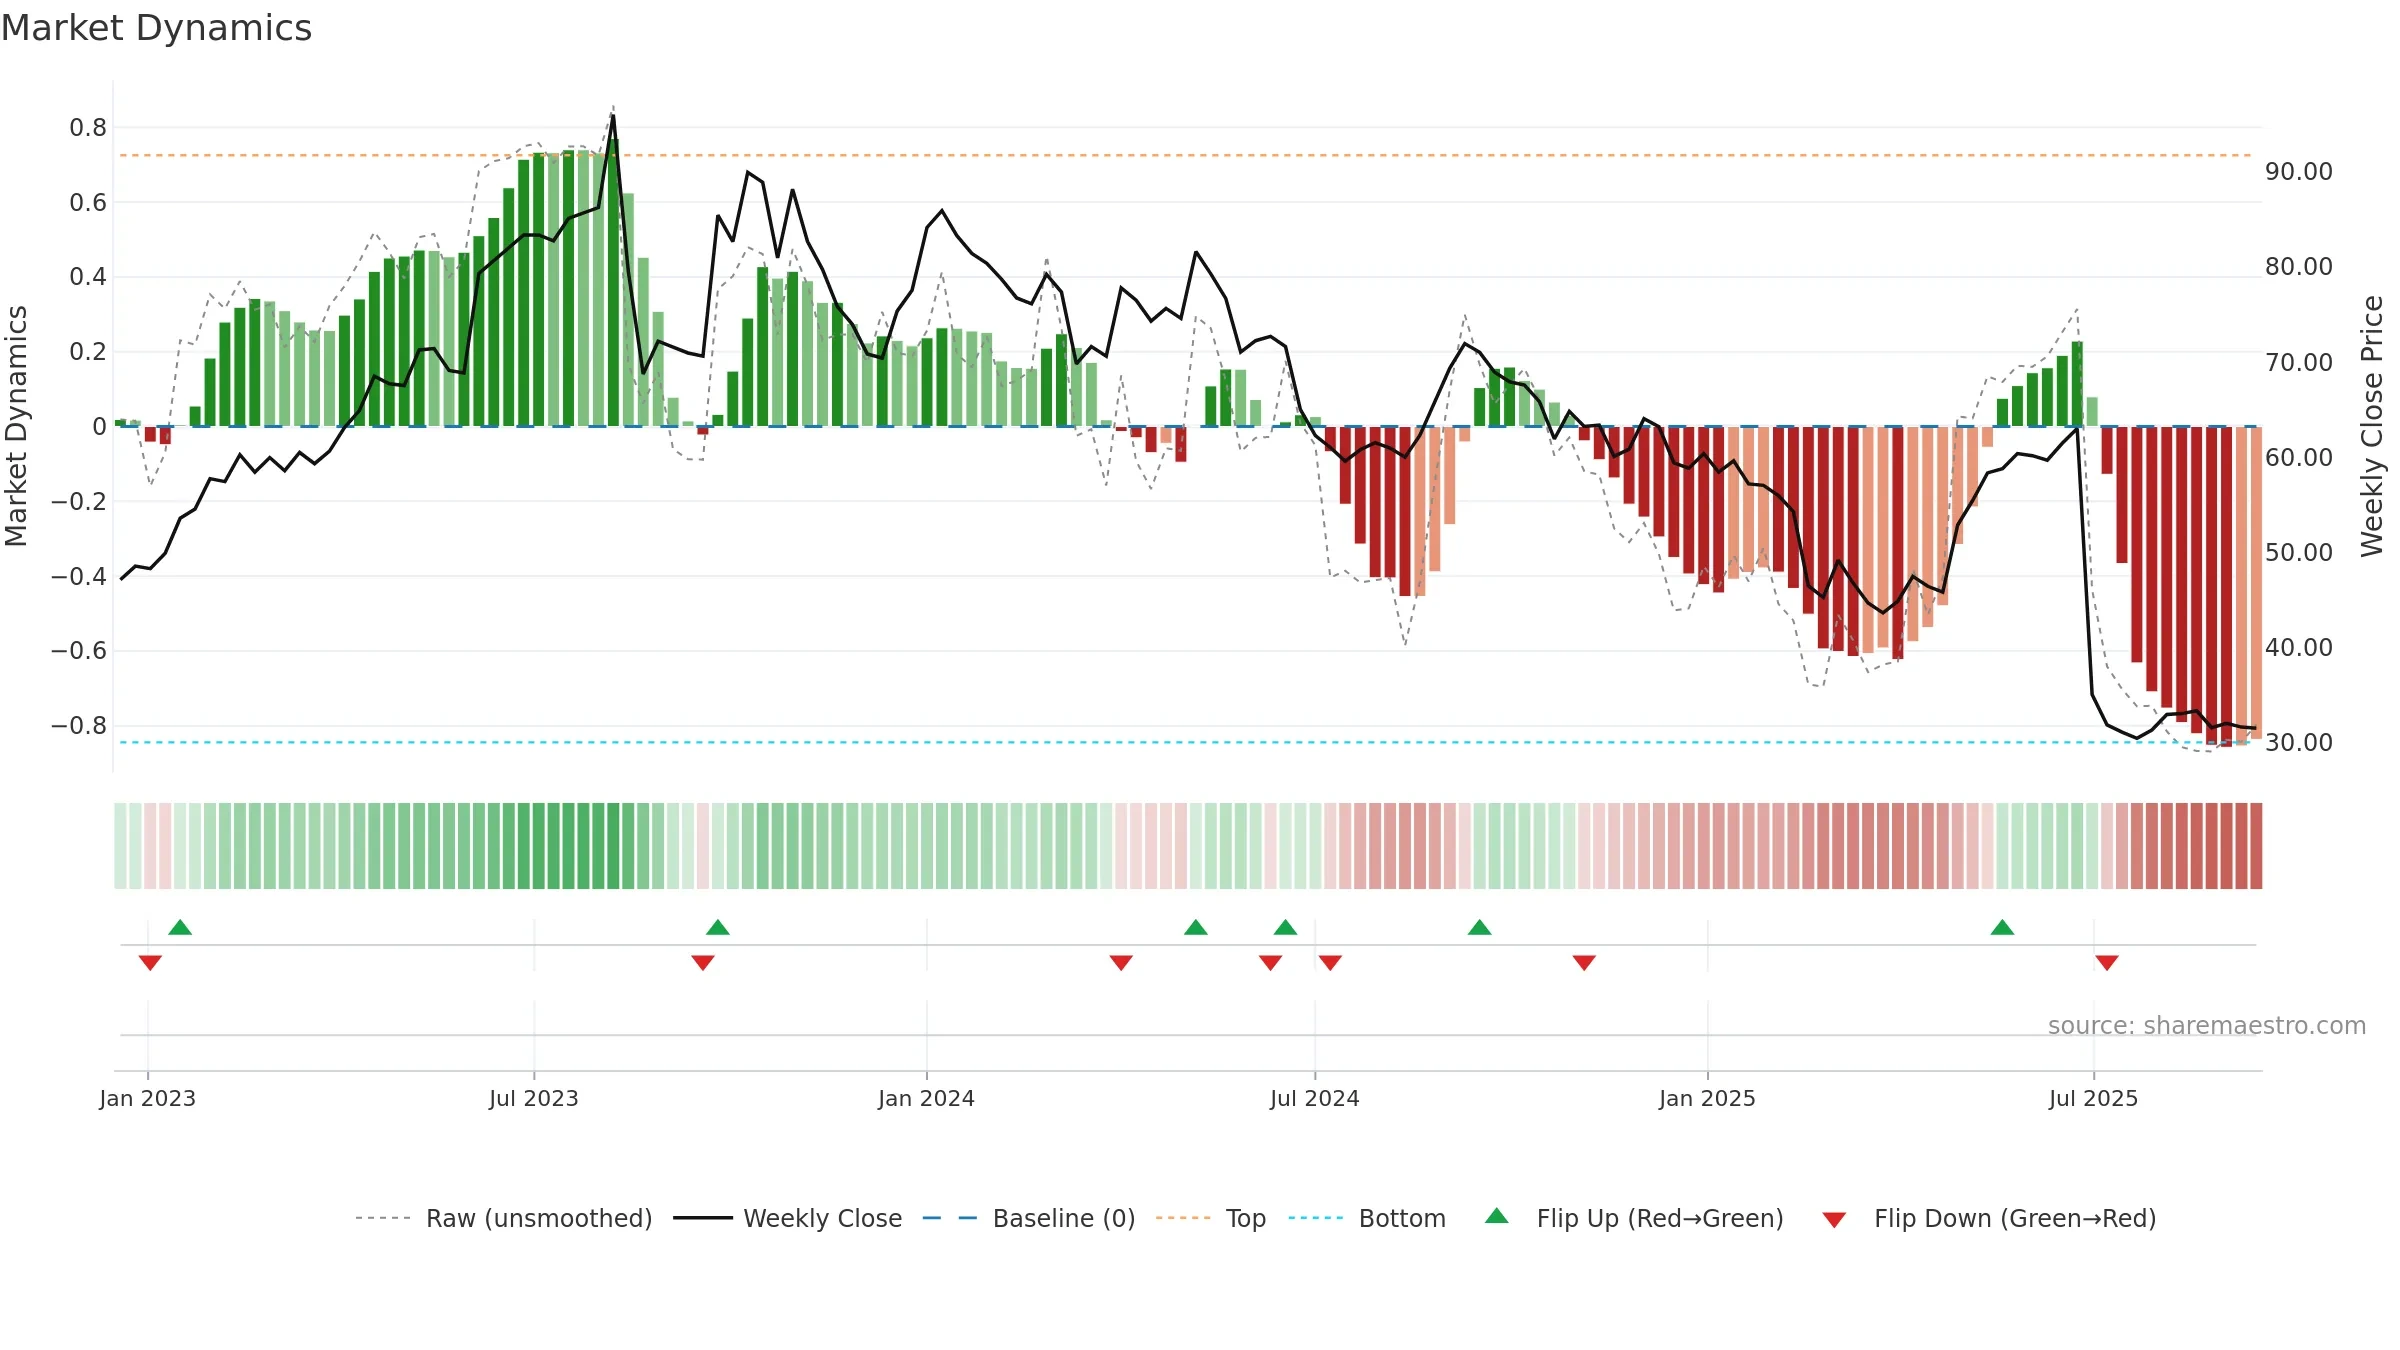
How to read this — Bearish zone with falling momentum — sellers in control.
Bias remains lower; rallies are suspect unless gauge reclaims 0.50/0.60.
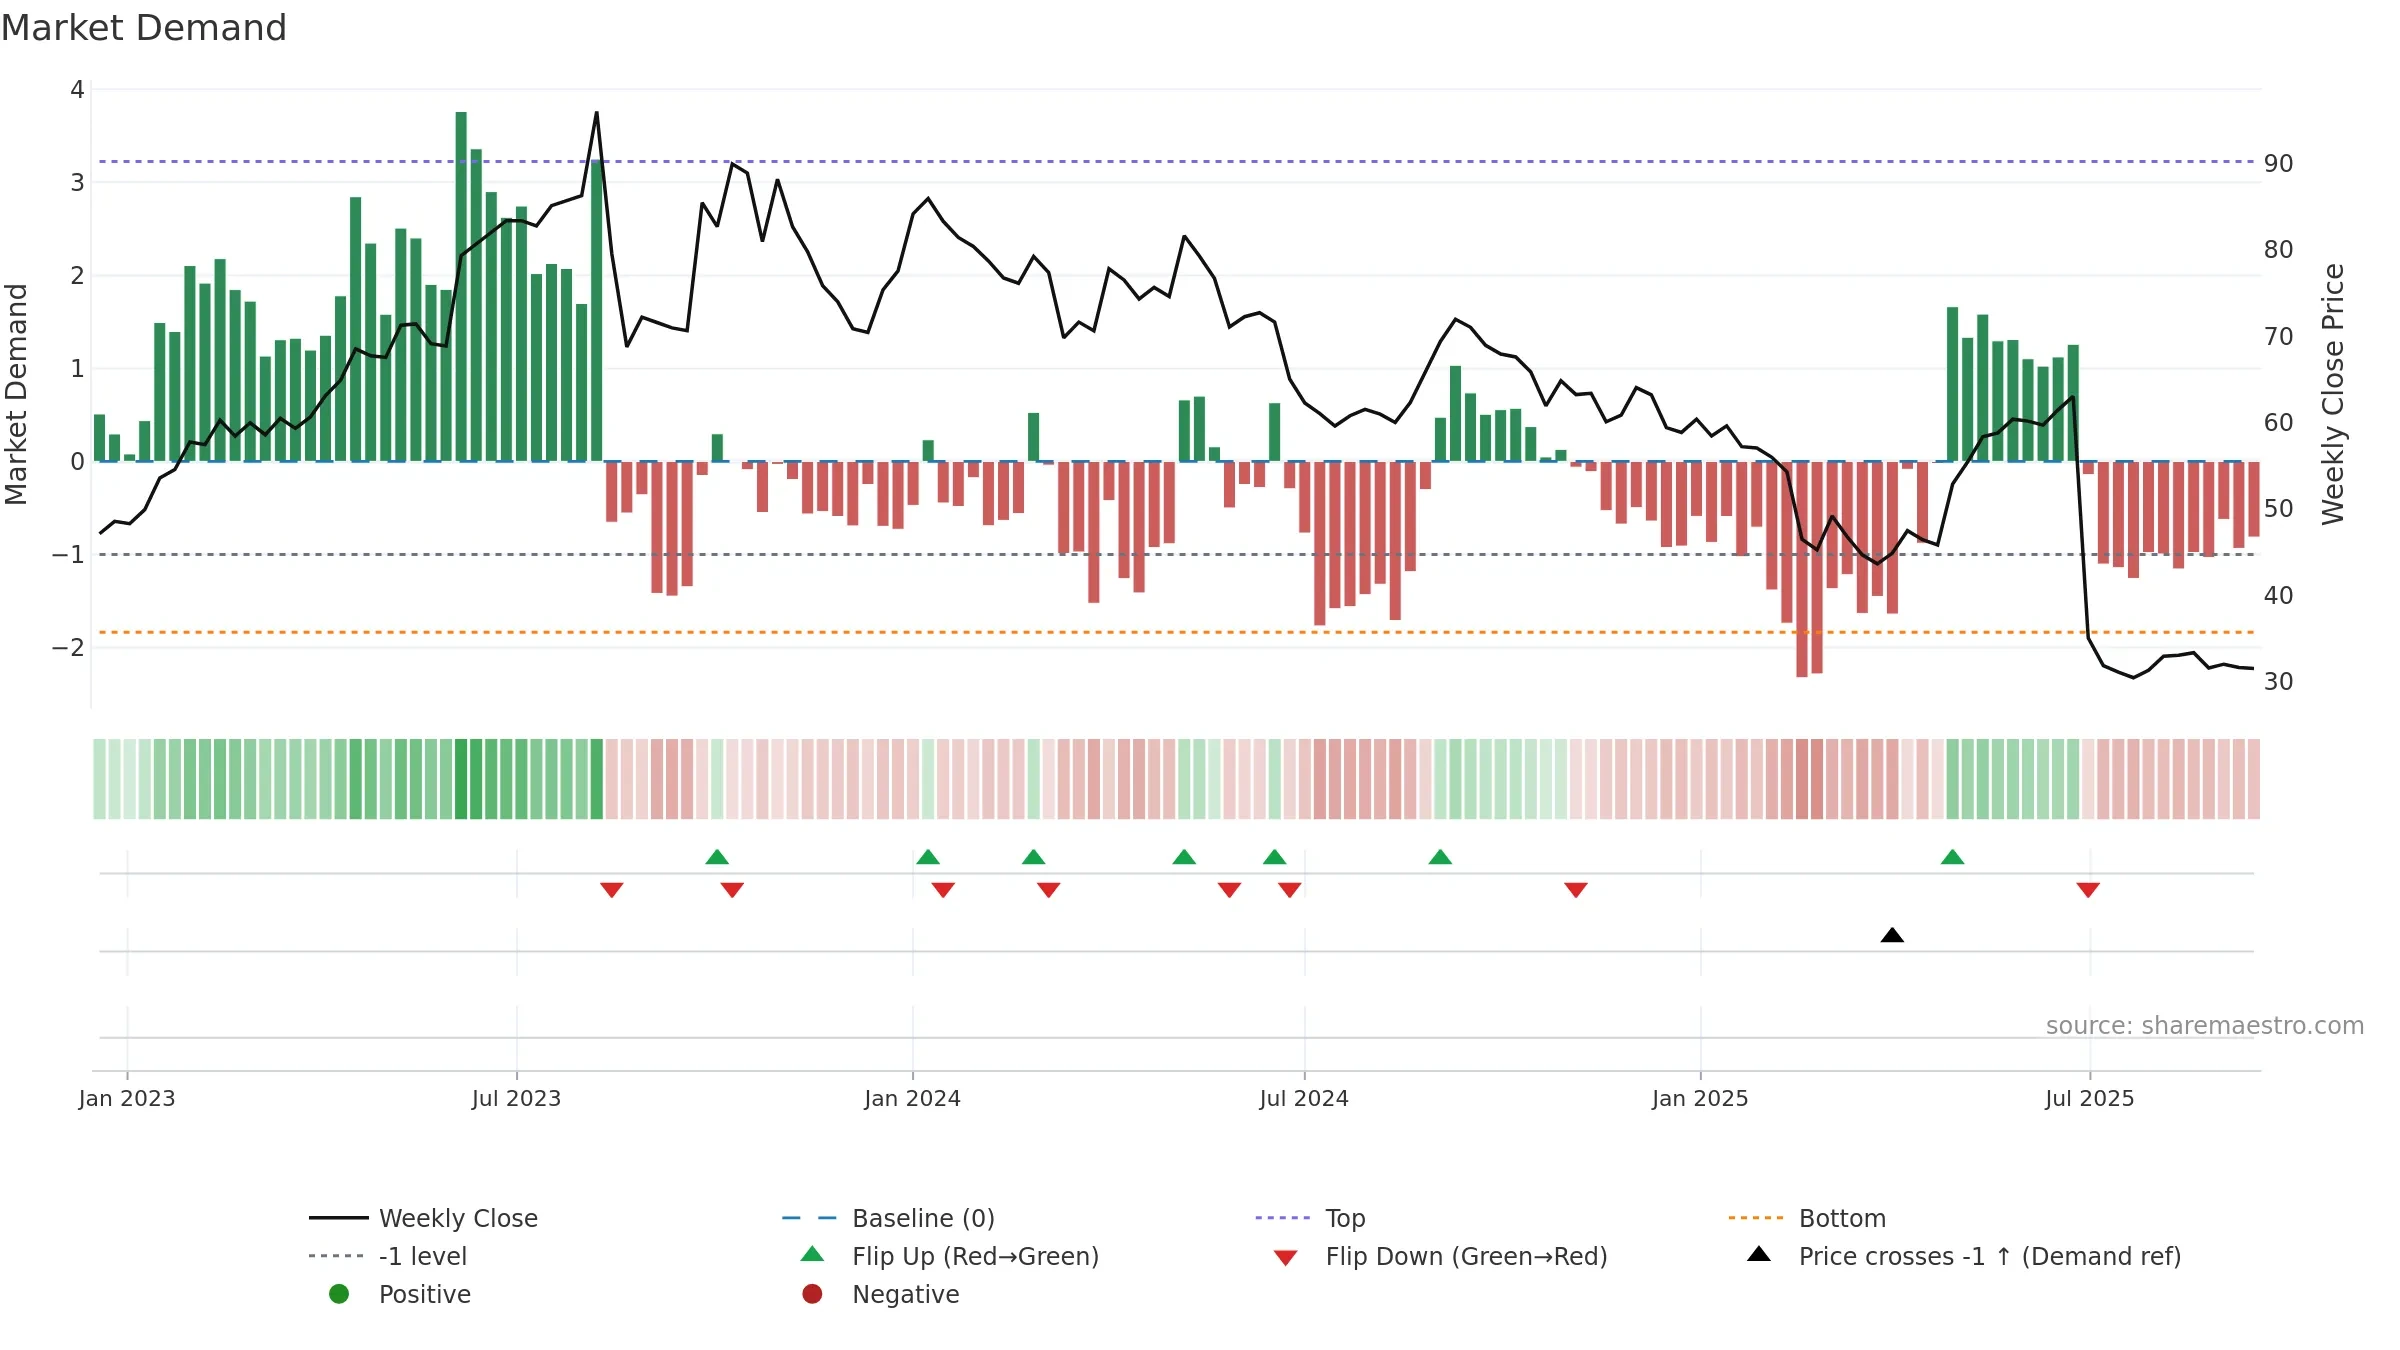
Price is above fair value; upside may be capped without catalysts.
Conclusion
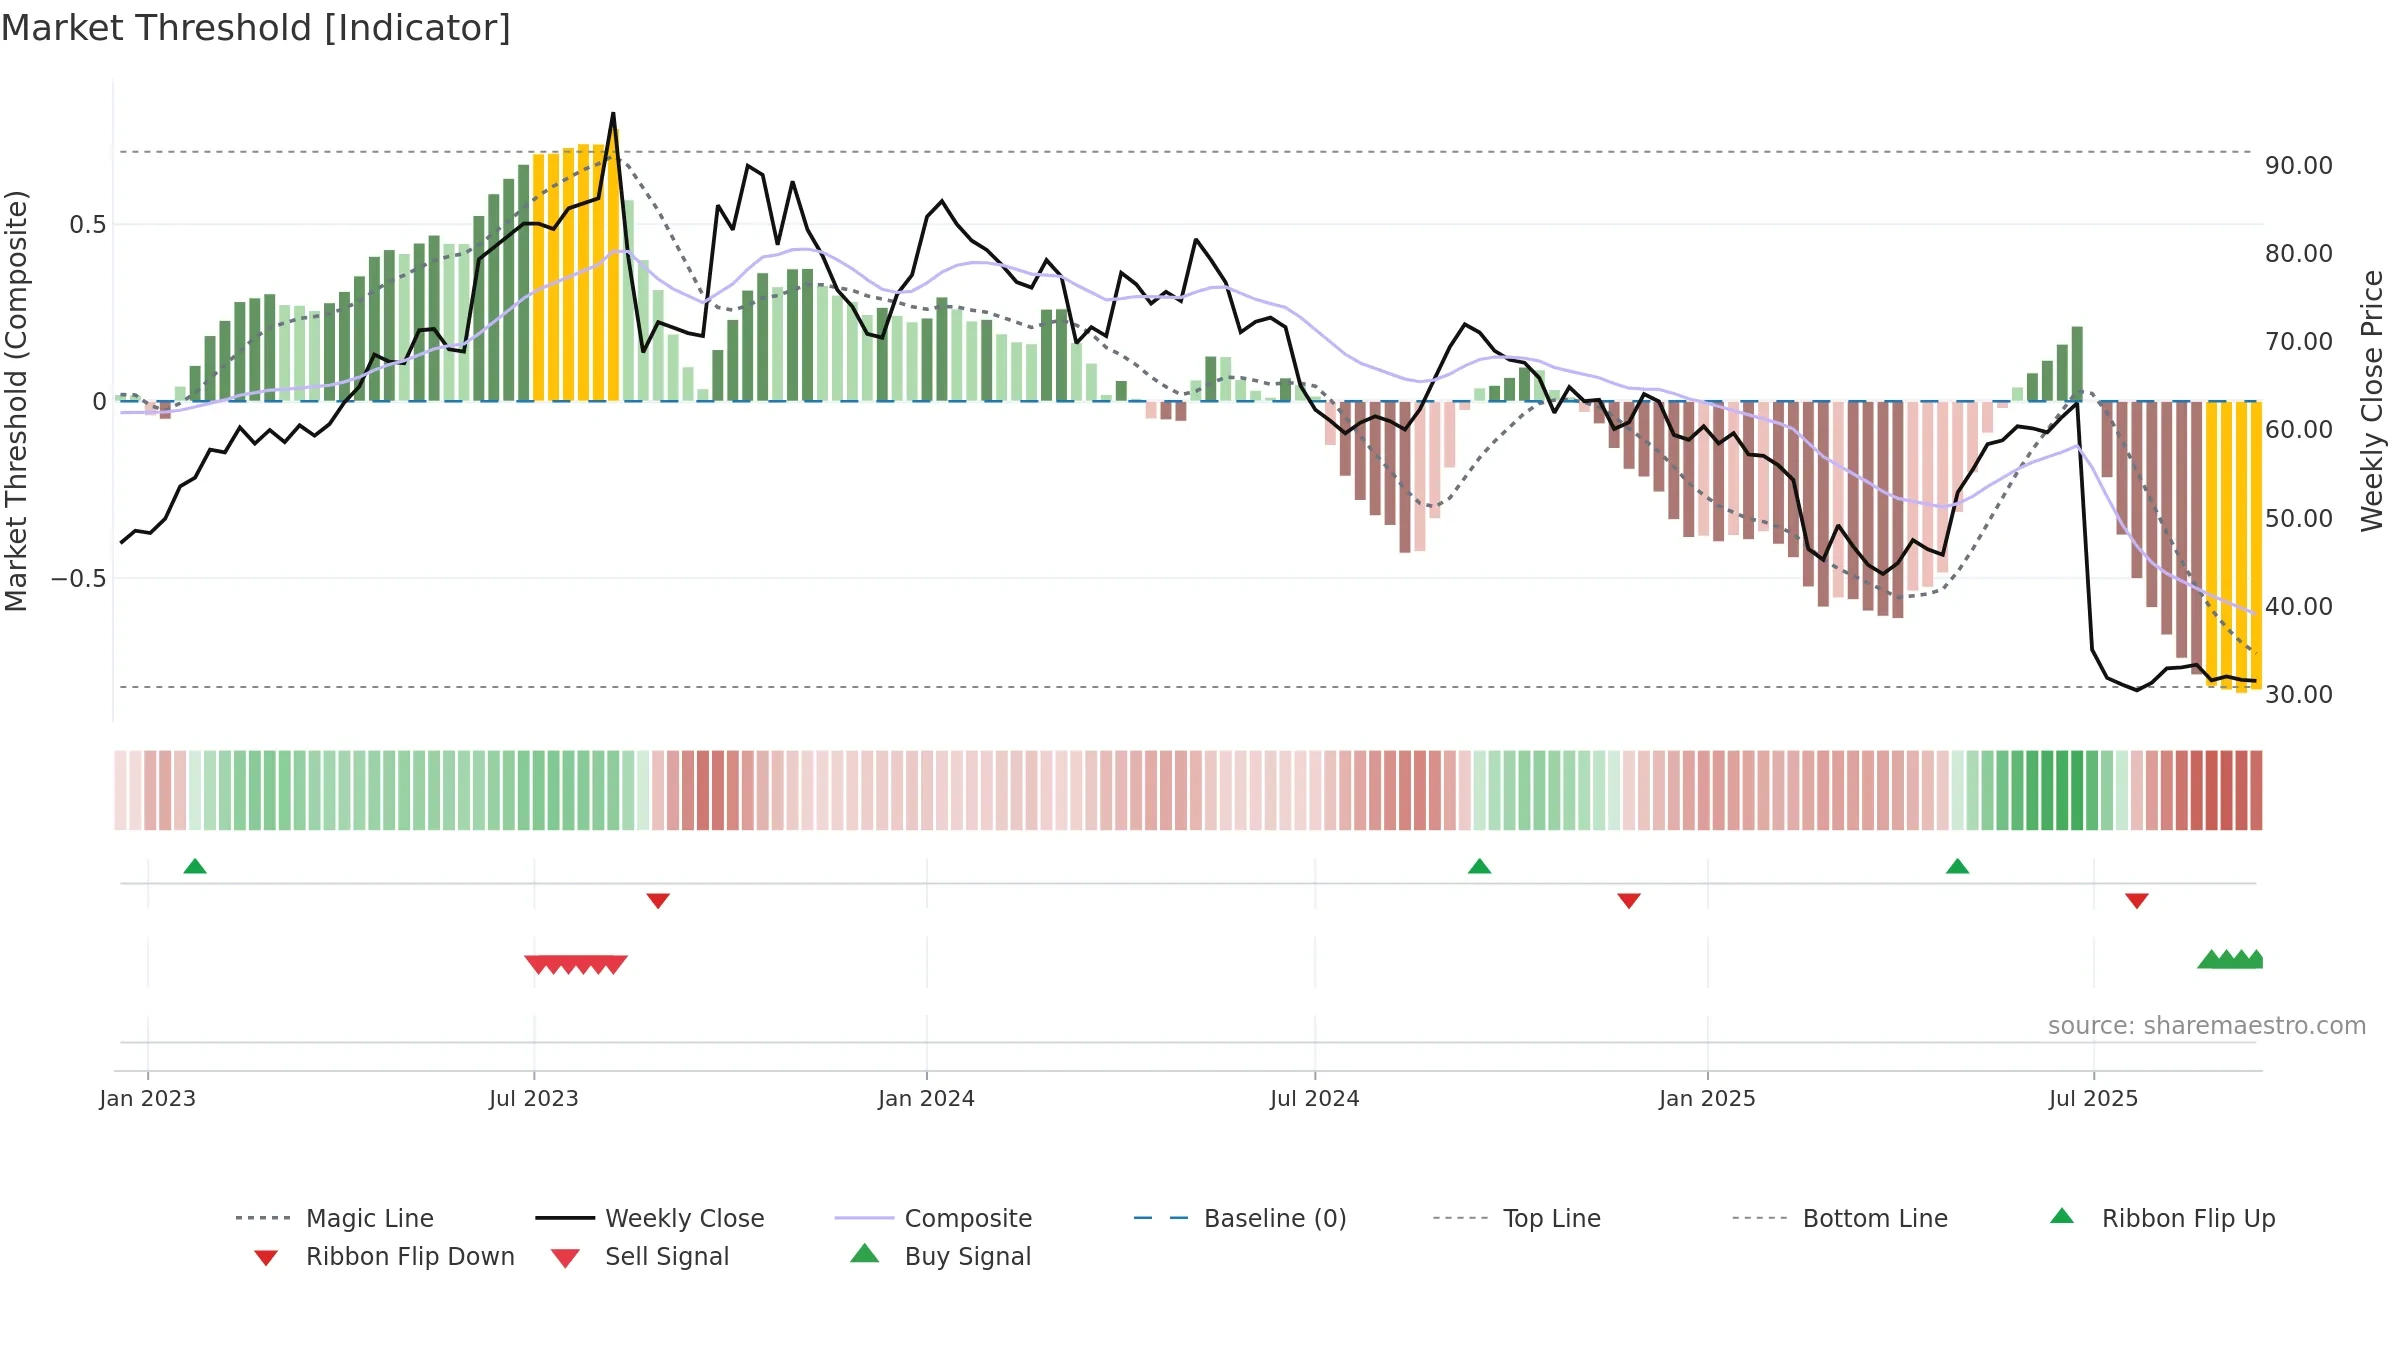
Negative setup. ★☆☆☆☆ confidence. Price window: 0. Trend: Downtrend Confirmed; gauge 10. In combination, liquidity confirms the move.
- Liquidity confirms the price trend
- Bearish control with falling momentum
- Momentum is weak/falling
- Price is not above key averages
- Weak moving-average stack
Why: Price window 0.64% over 8w. Close is -5.48% below the prior-window high. Volume trend falling. Liquidity convergence with price. Trend state downtrend confirmed. Low-regime (≤0.25) upticks 2/7 (29.0%) • Distributing. MA stack weak. 4–8w crossover bearish. Momentum bearish and falling. Valuation limited upside without catalysts.
Tip: Most metrics include a hover tooltip where they appear in the report.