Faron Pharmaceuticals Oy
FARON HEL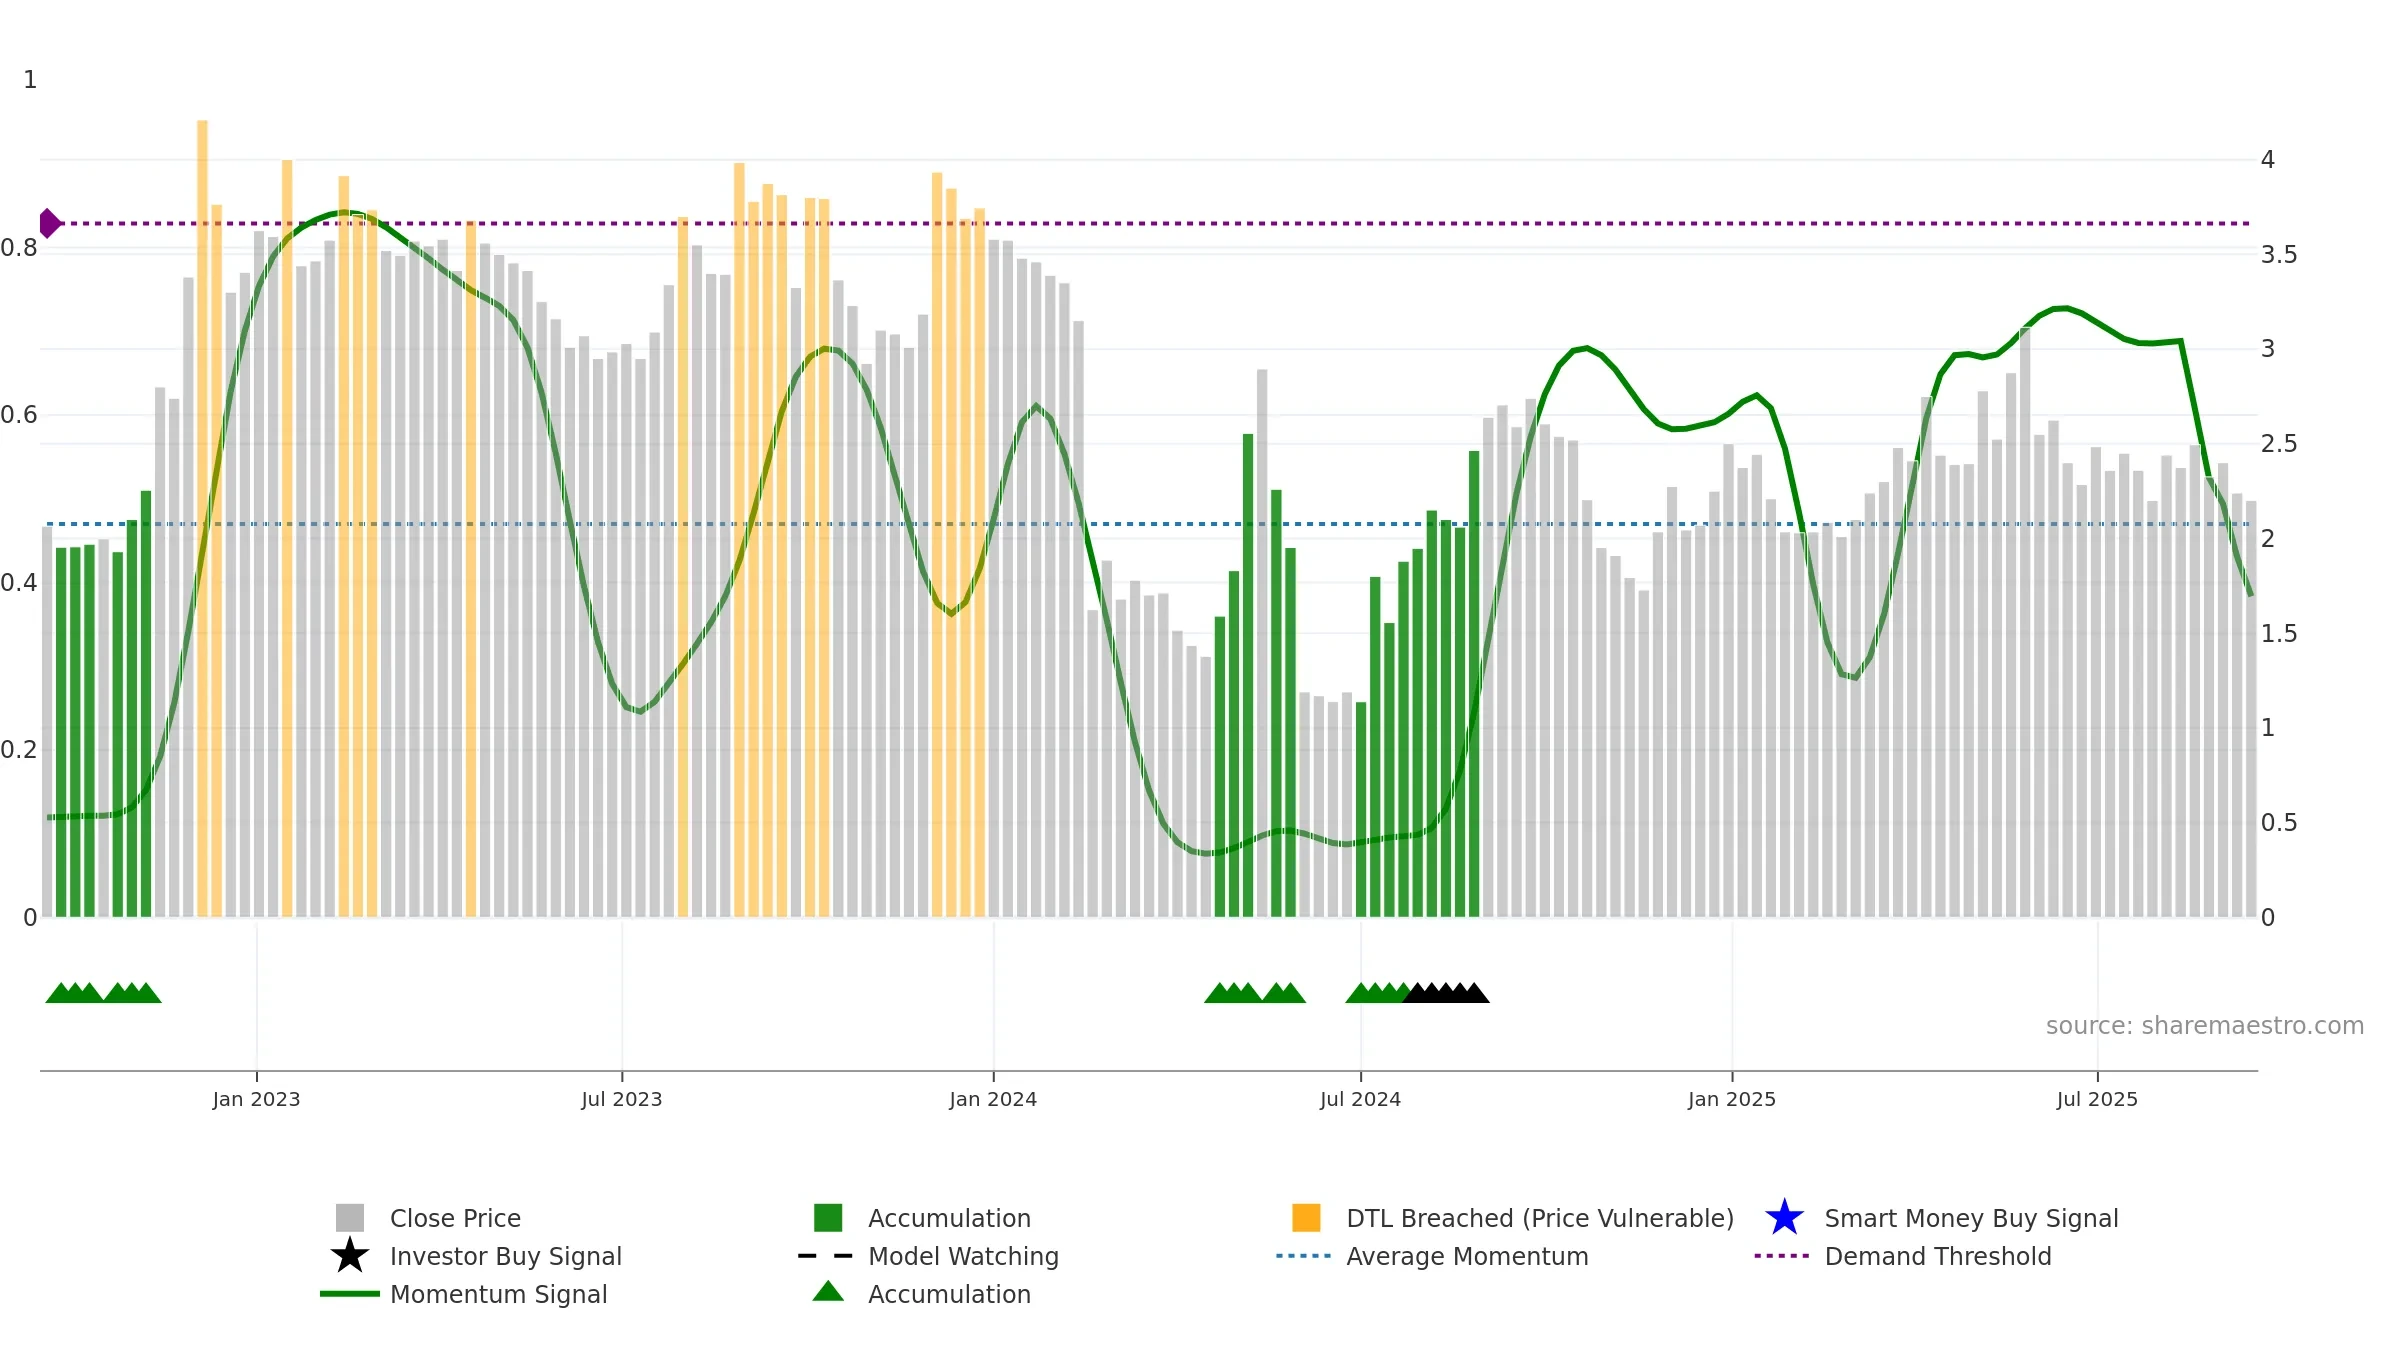
Weekly Report
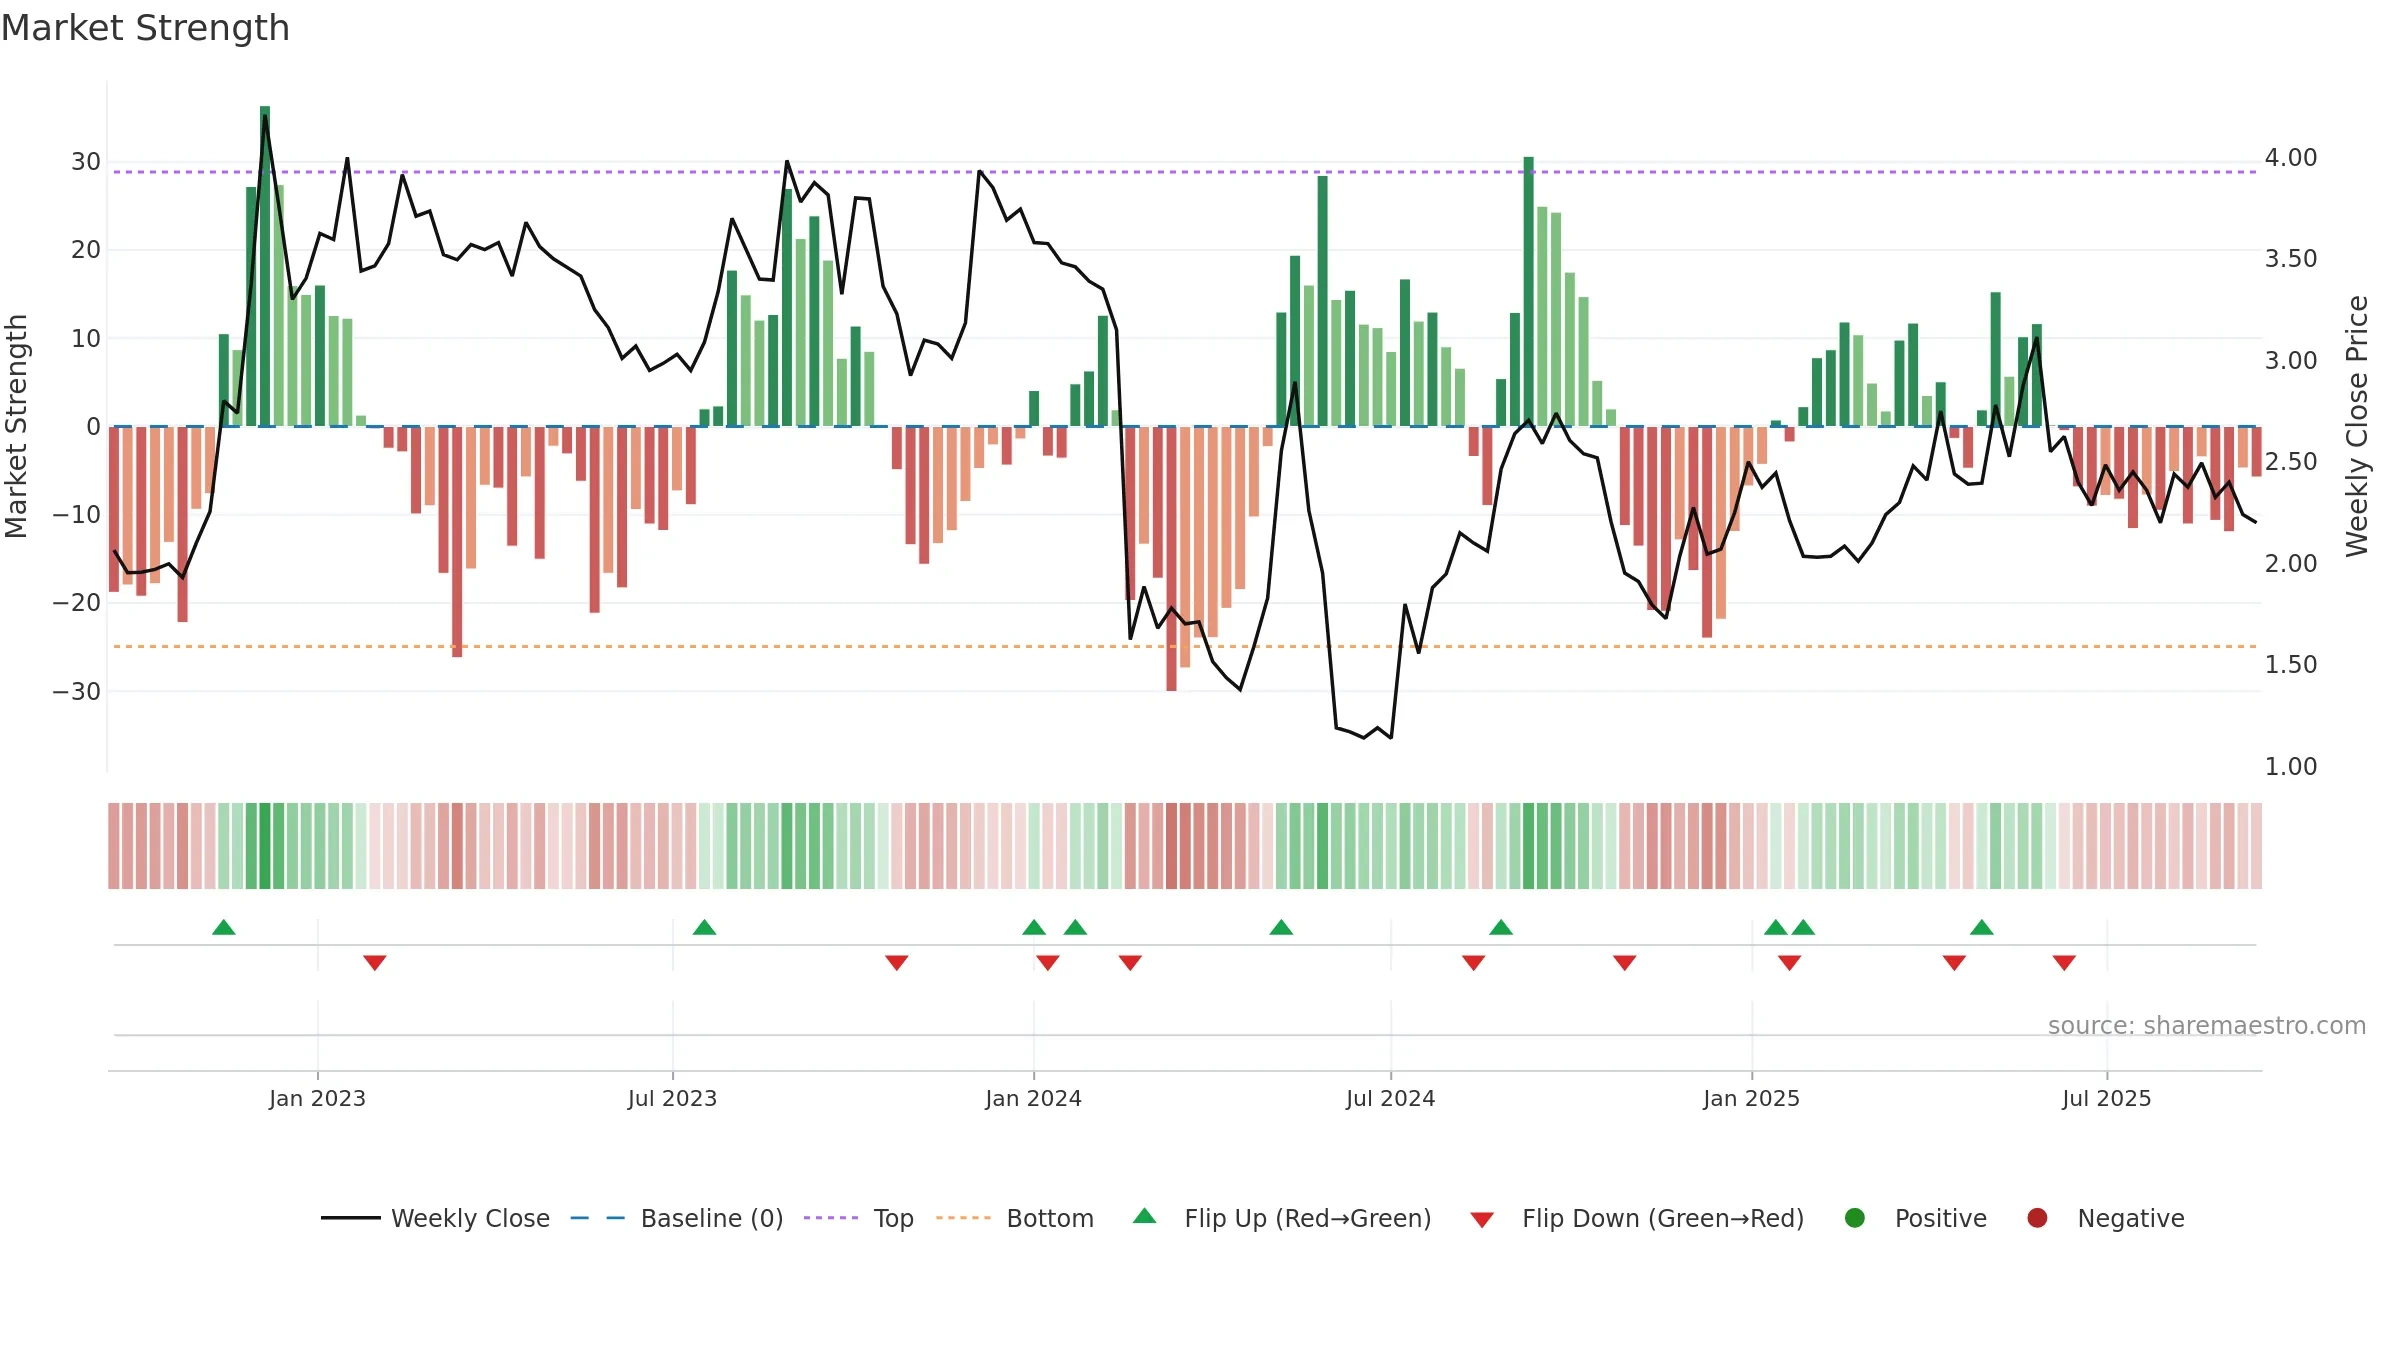
Faron Pharmaceuticals Oy closed at 2.2000 (2.33% WoW) . Data window ends Mon, 15 Sep 2025.
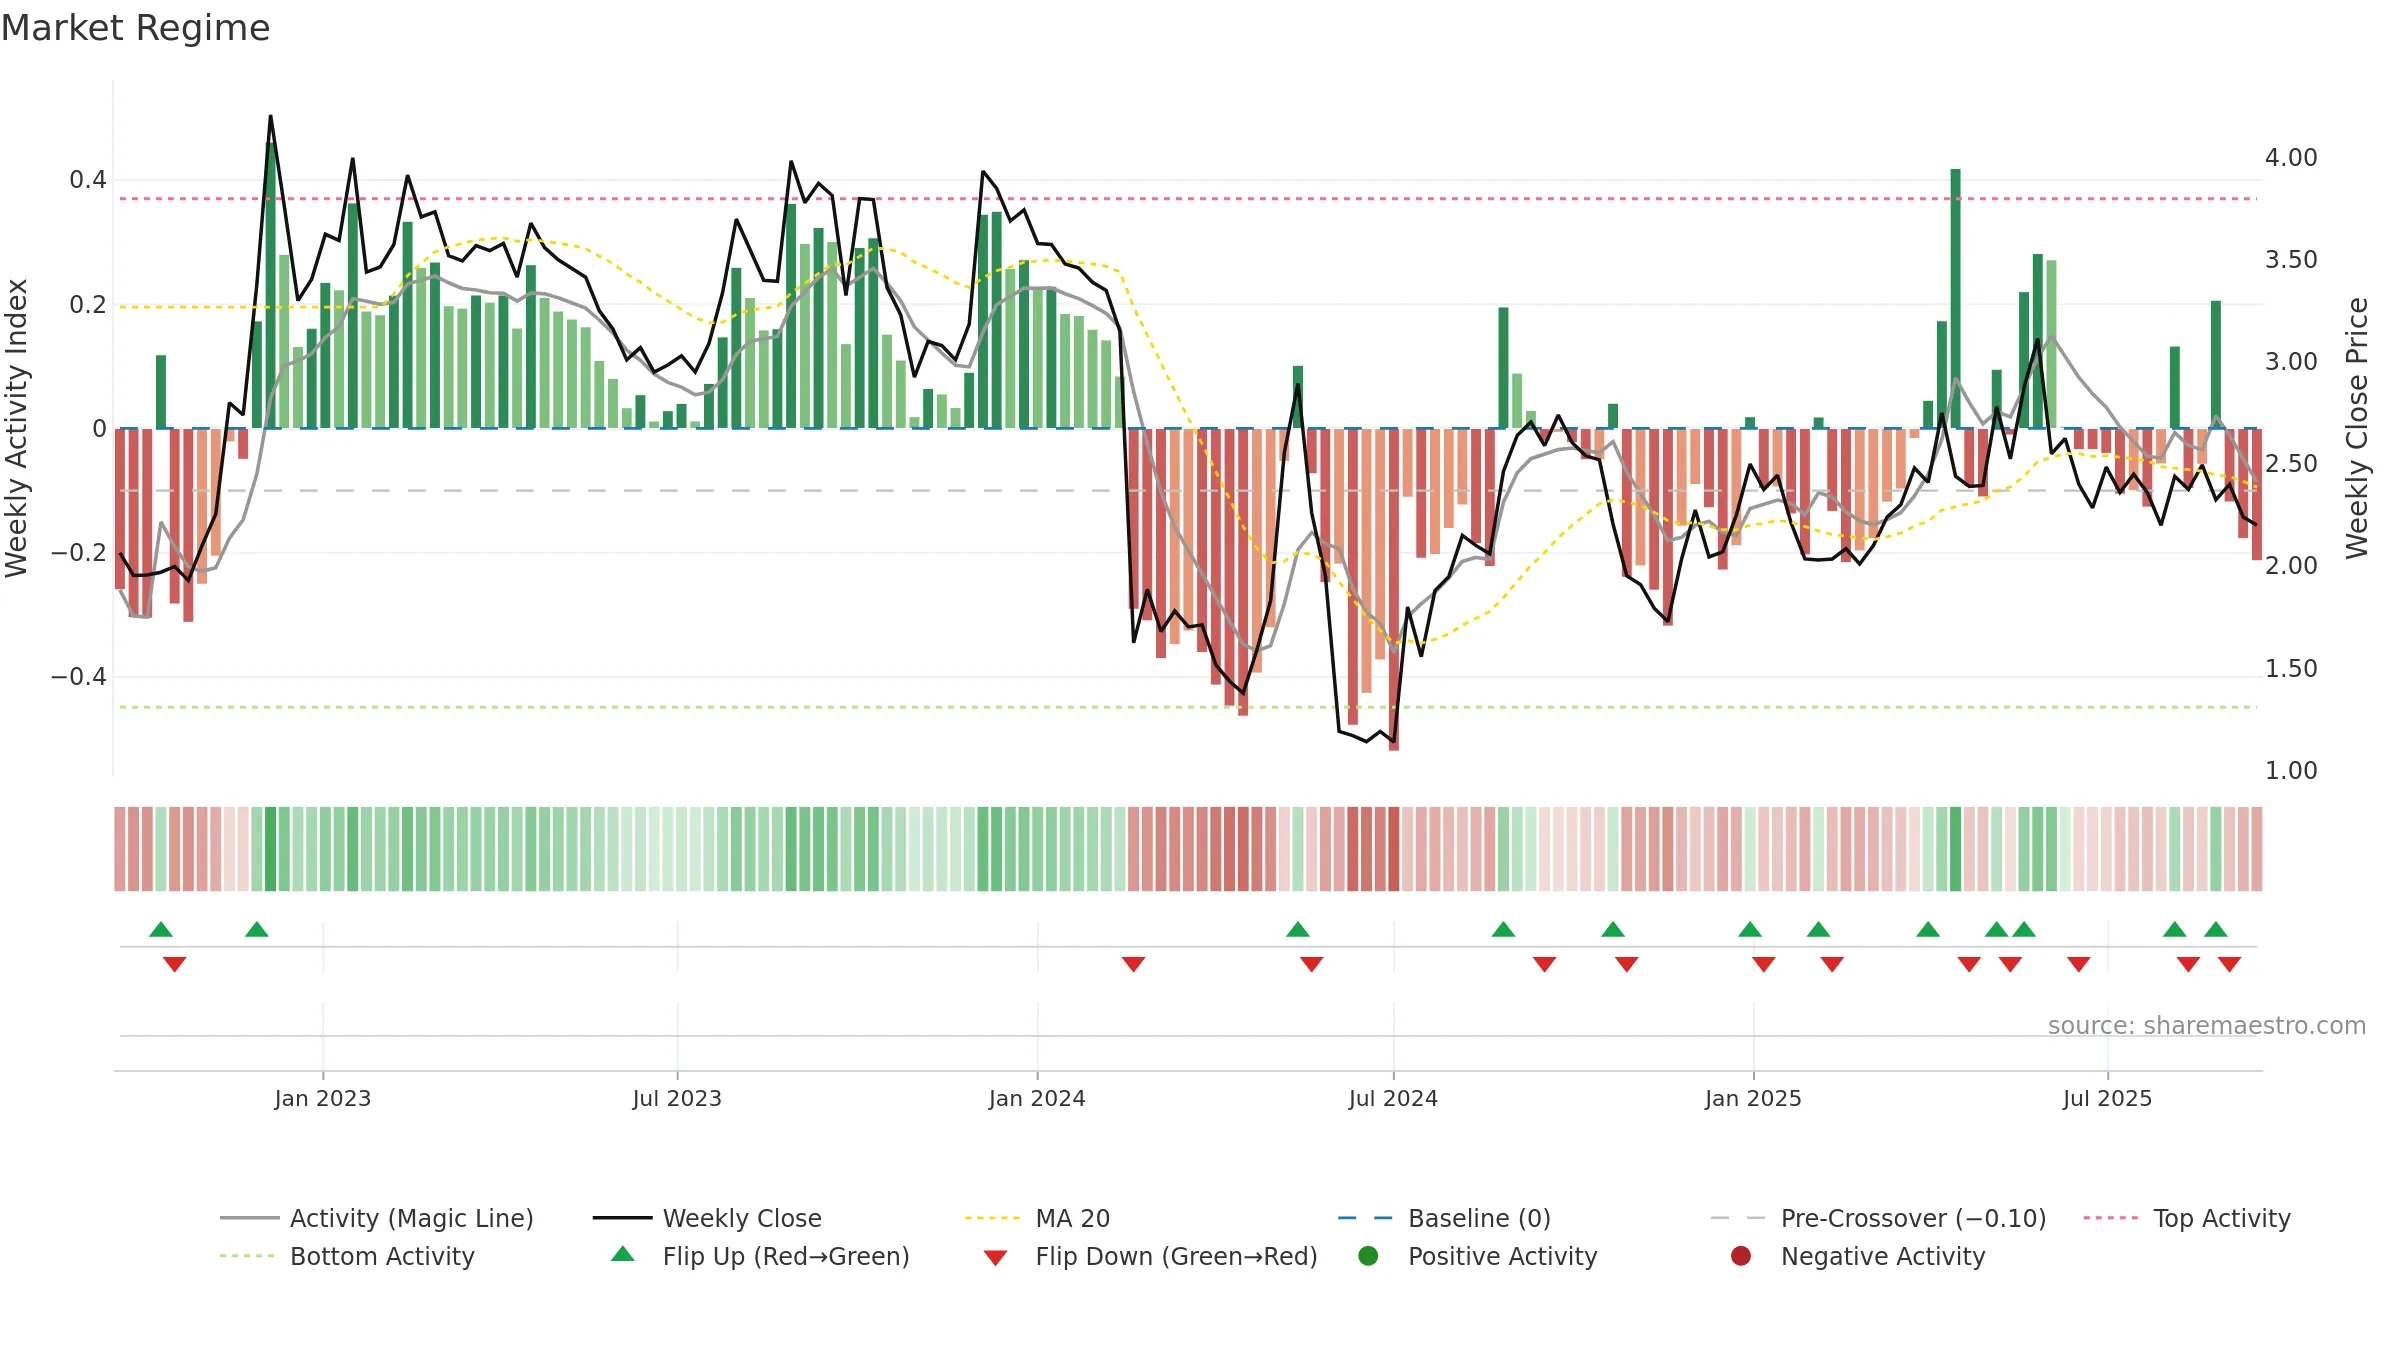
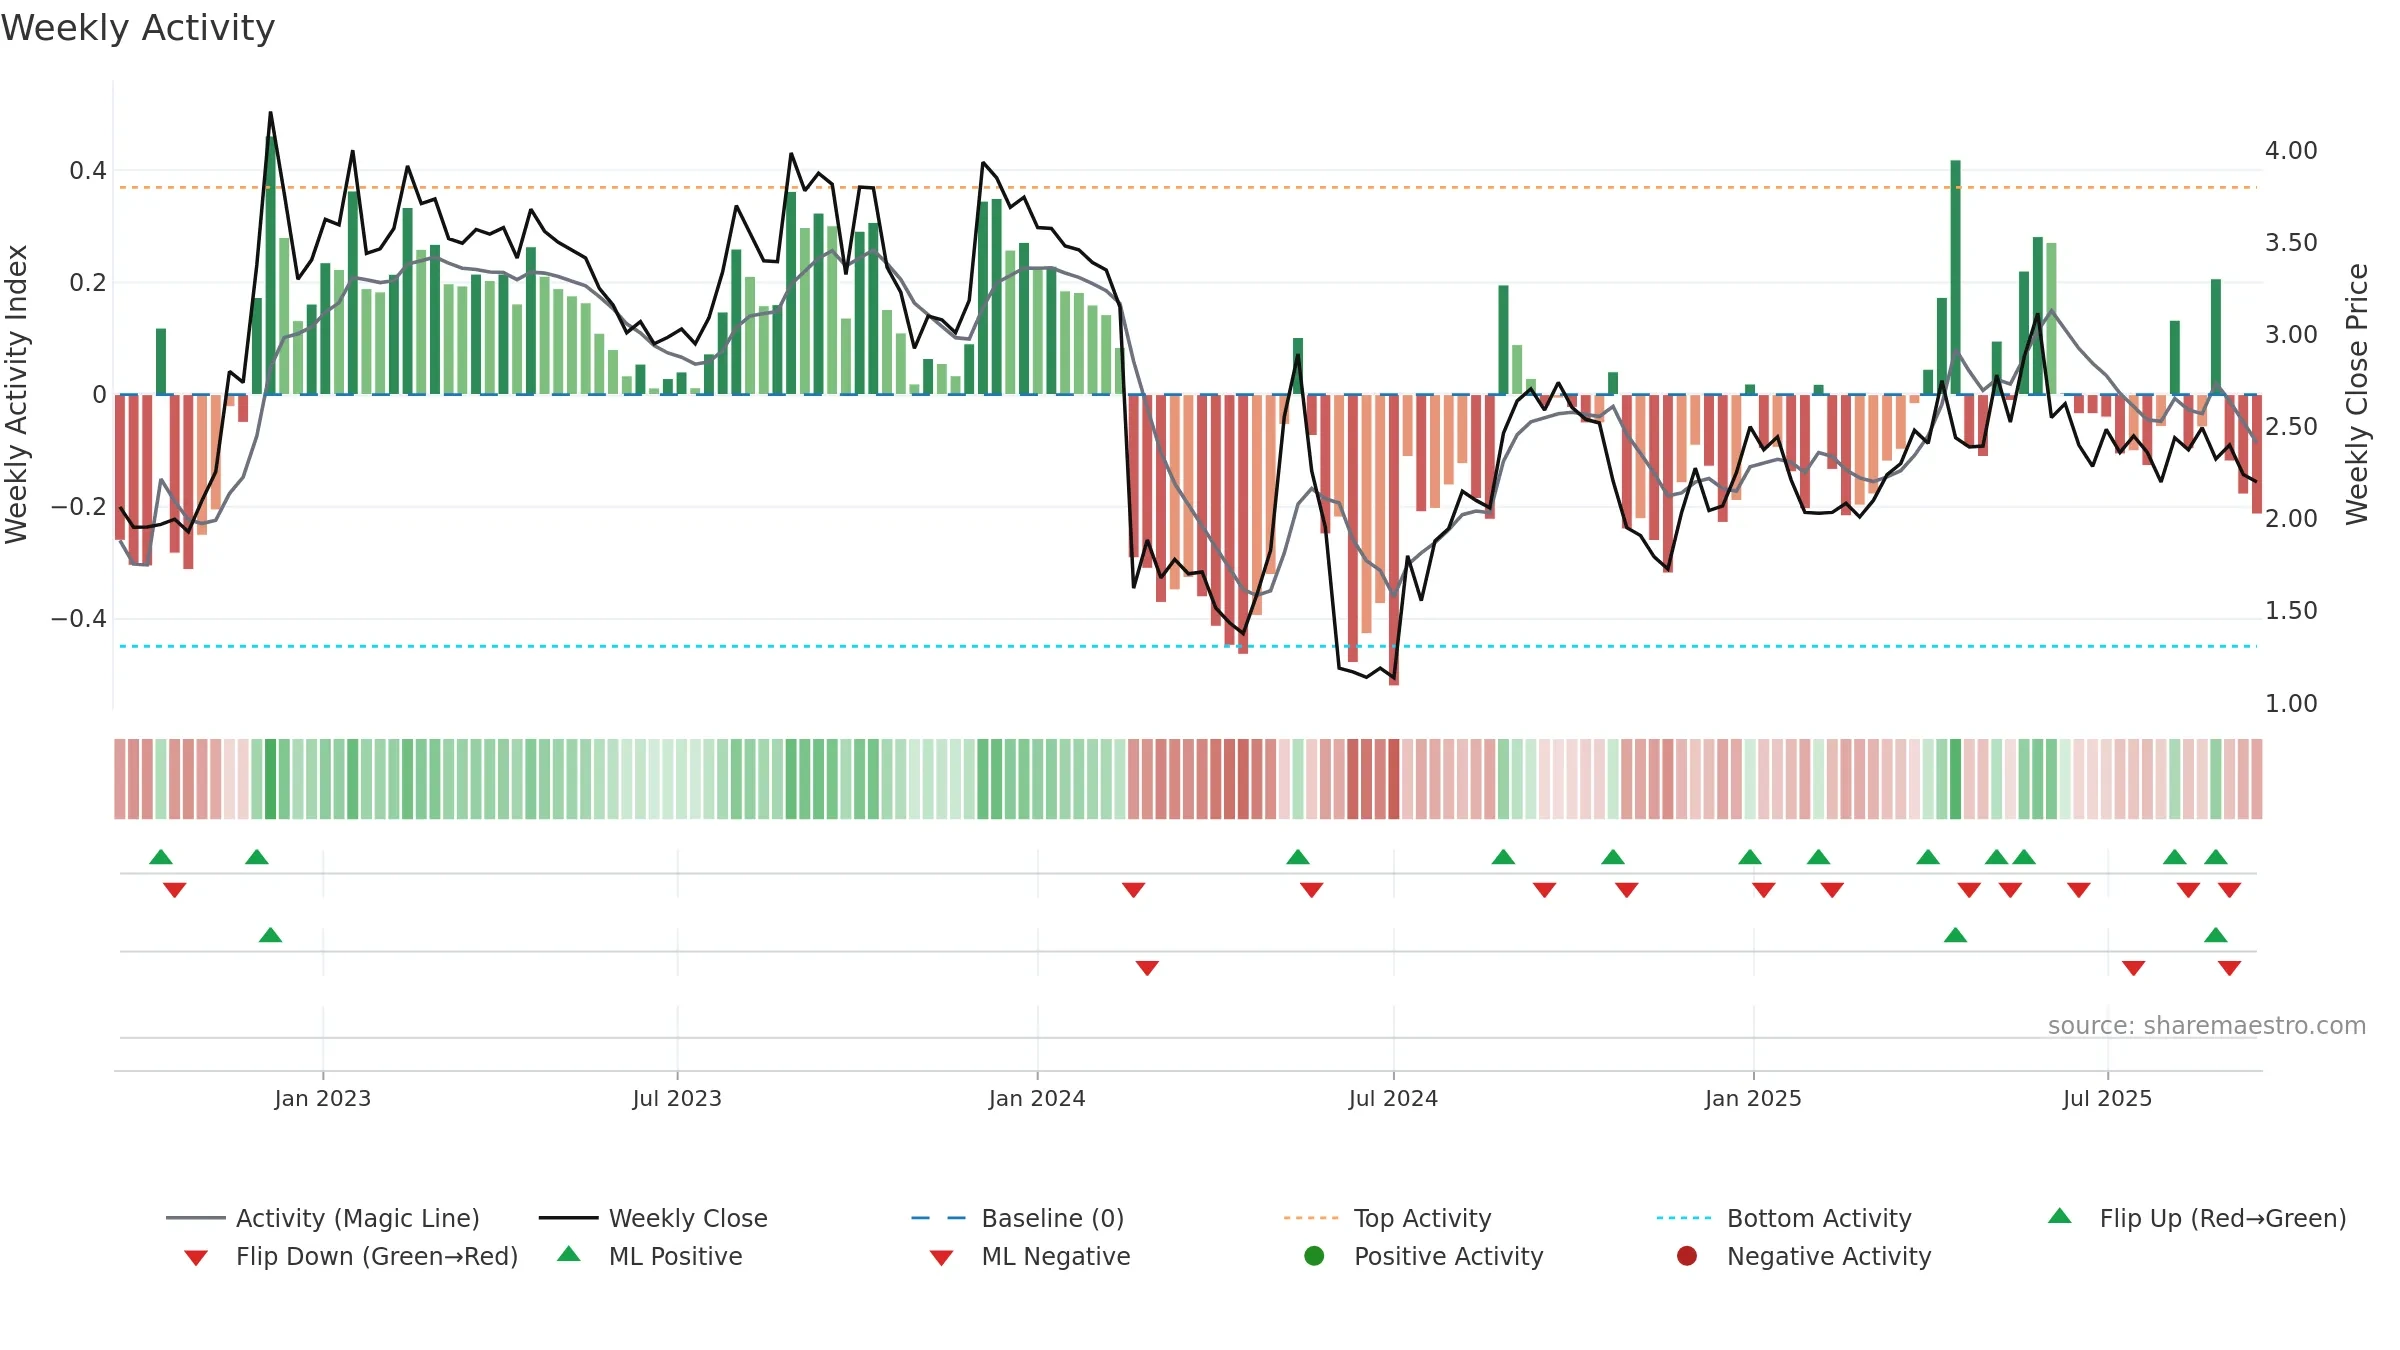
How to read this — Price slope is downward, indicating persistent supply pressure. Elevated weekly volatility increases whipsaw risk. Volume and price are moving in the same direction — a constructive confirmation. Returns are negatively correlated with volume — strength may come on lighter activity. Weak MA stack argues for caution; rallies can fail near the 8–13 week region. Fresh short-term downside crossover weakens near-term tone. Price sits below key averages, keeping pressure on the tape.
Down-slope argues for patience; rallies can fade sooner unless participation improves.
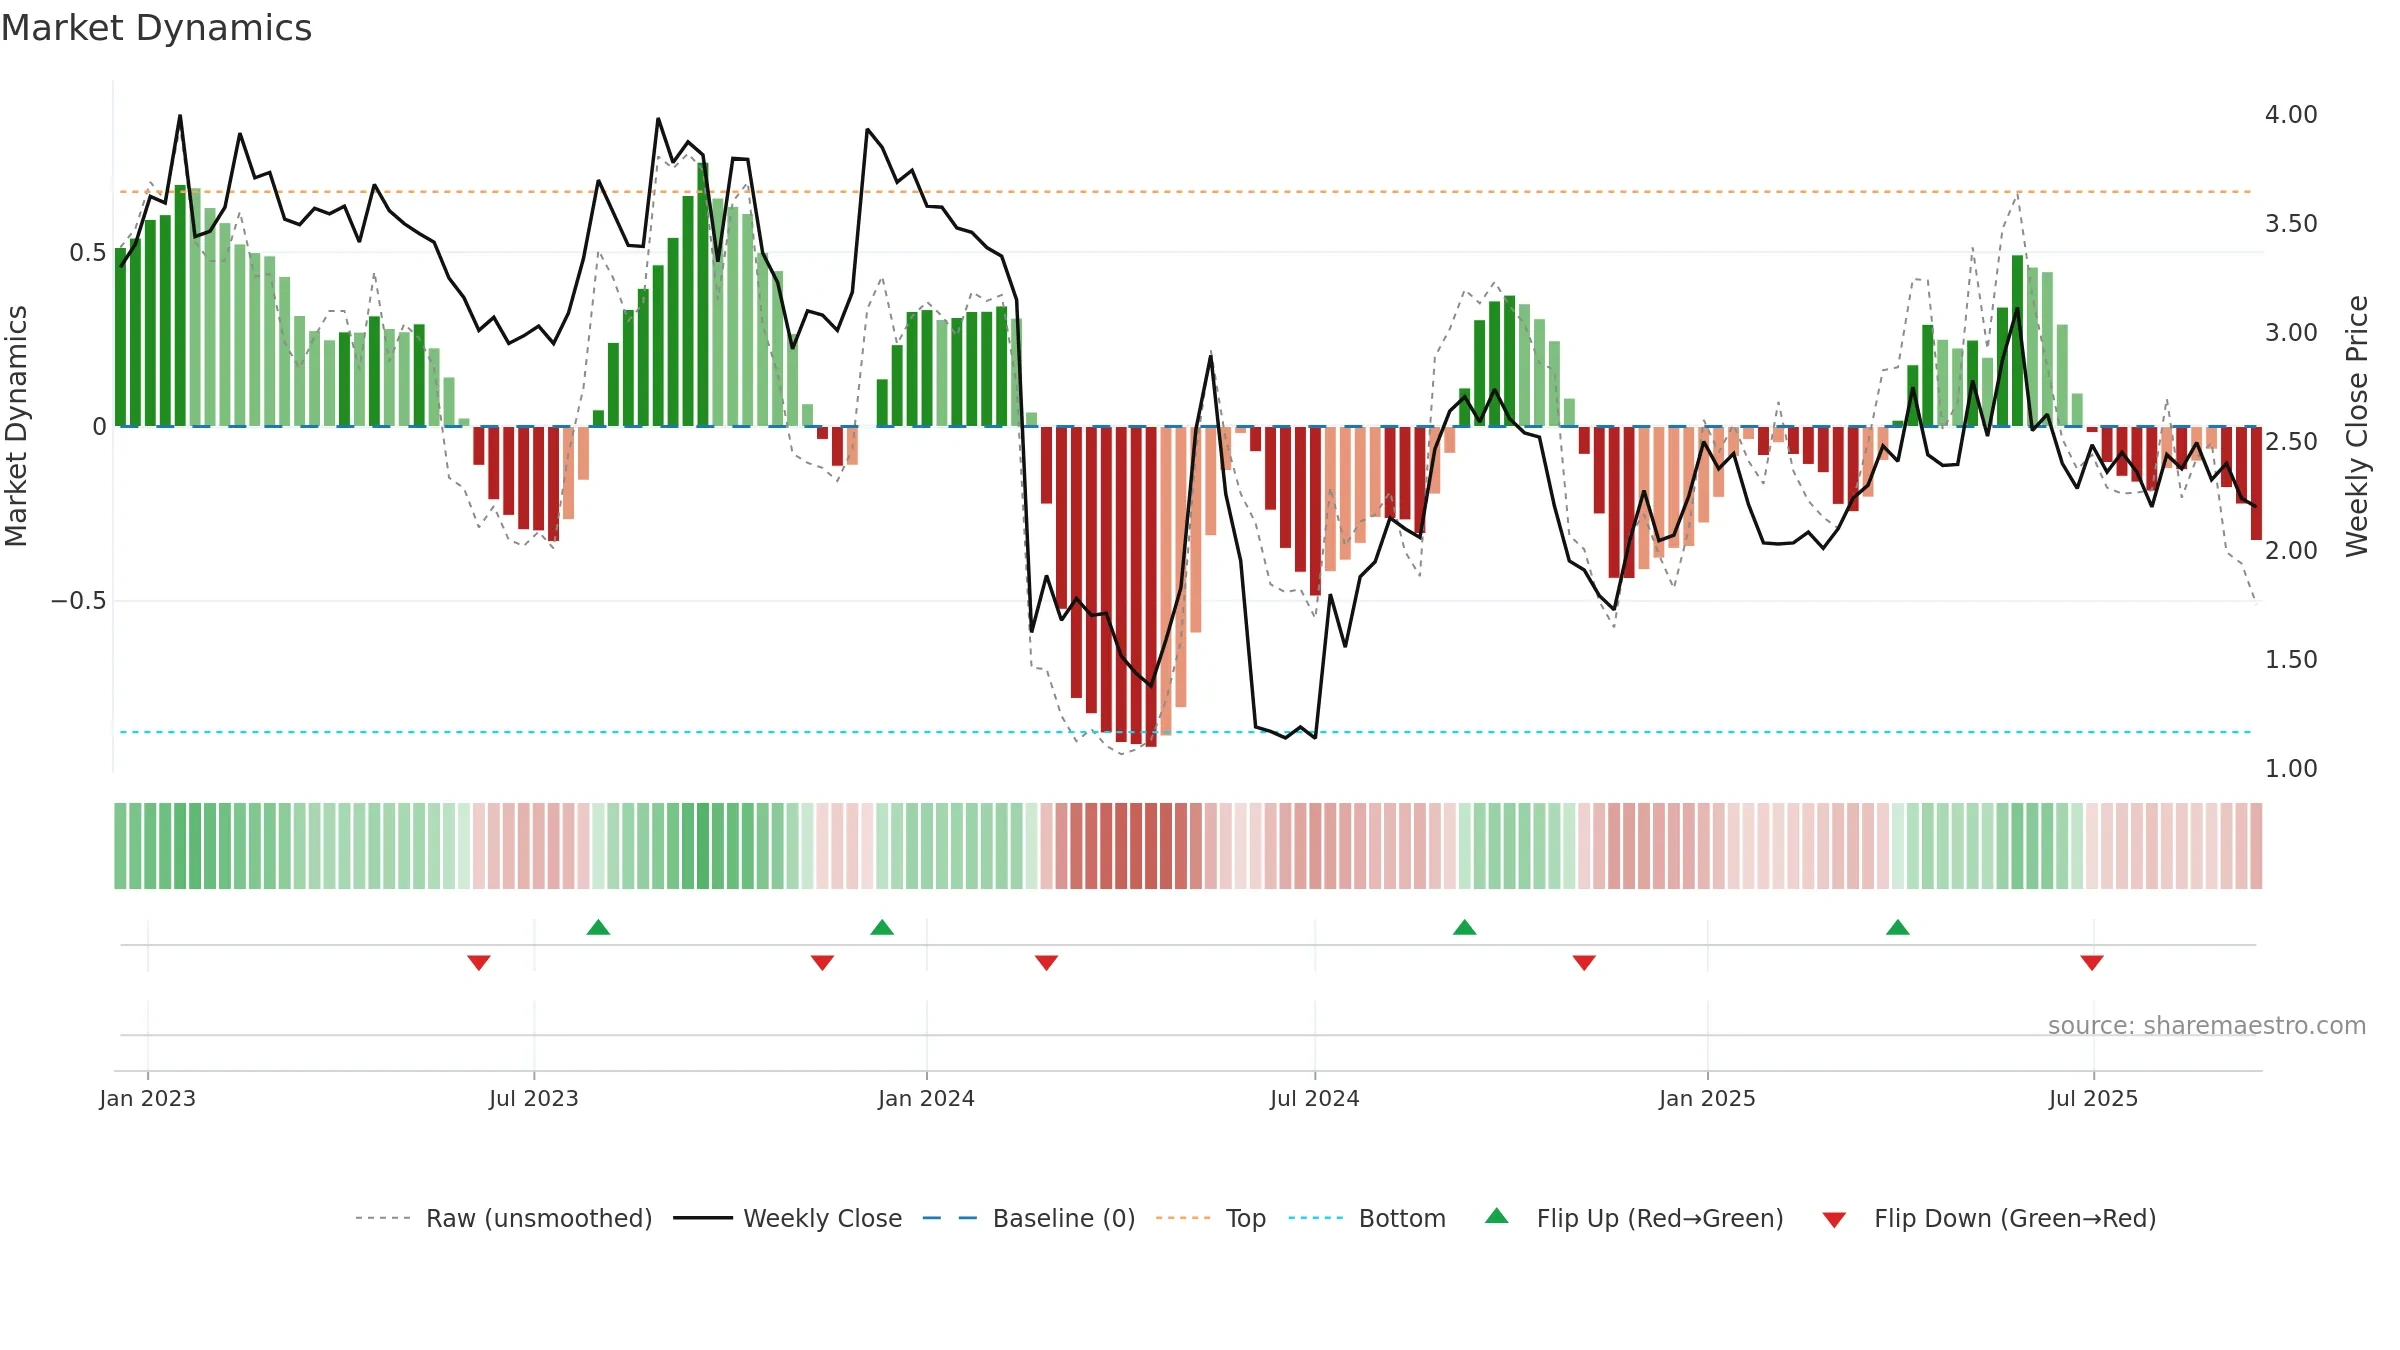
Gauge maps the trend signal to a 0–100 scale.
How to read this — Bearish zone with falling momentum — sellers in control. Loss of the ~0.50 midline after strength suggests regime shift. Sub-0.40 print confirms downside control.
Bias remains lower; rallies are suspect unless gauge reclaims 0.50/0.60.
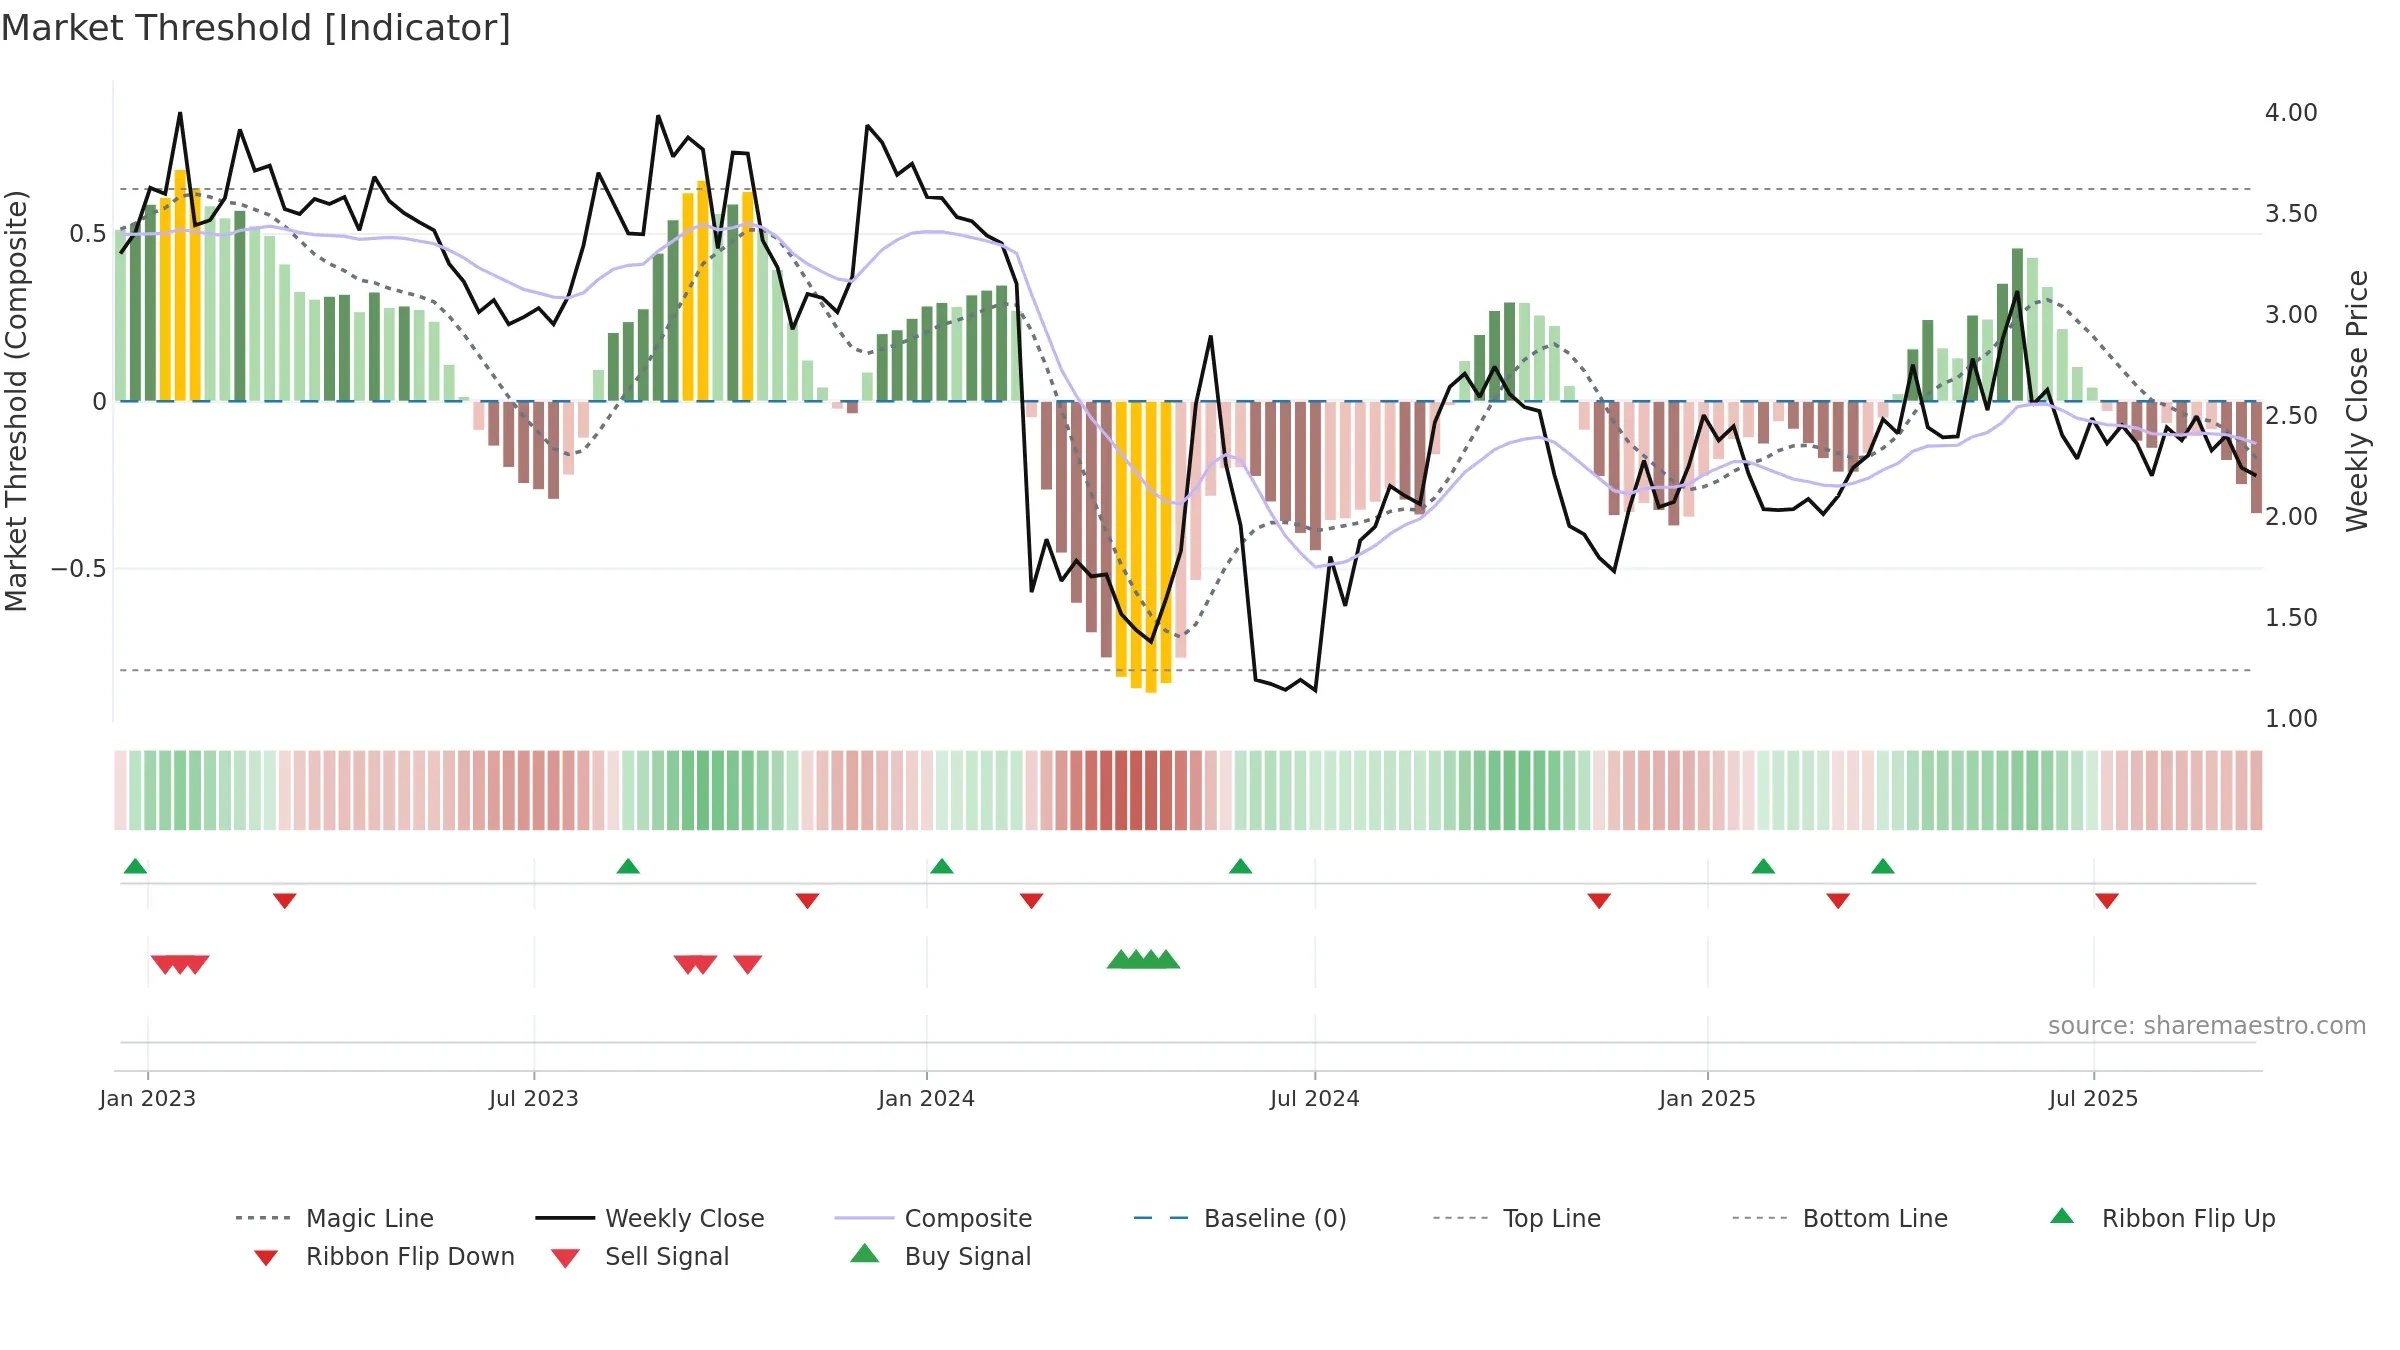
Conclusion
Negative setup. ★☆☆☆☆ confidence. Price window: 0. Trend: Downtrend Confirmed; gauge 38. In combination, liquidity confirms the move.
- Liquidity confirms the price trend
- Bearish control with falling momentum
- Momentum is weak/falling
- Price is not above key averages
- Weak moving-average stack
Why: Close is -11.82% below the prior-window high. Return volatility 6.59%. Volume trend falling. Liquidity convergence with price. Trend state downtrend confirmed. MA stack weak. 4–8w crossover bearish. Momentum bearish and falling.
Tip: Most metrics include a hover tooltip where they appear in the report.