Indo Thai Securities Limited
INDOTHAI NSE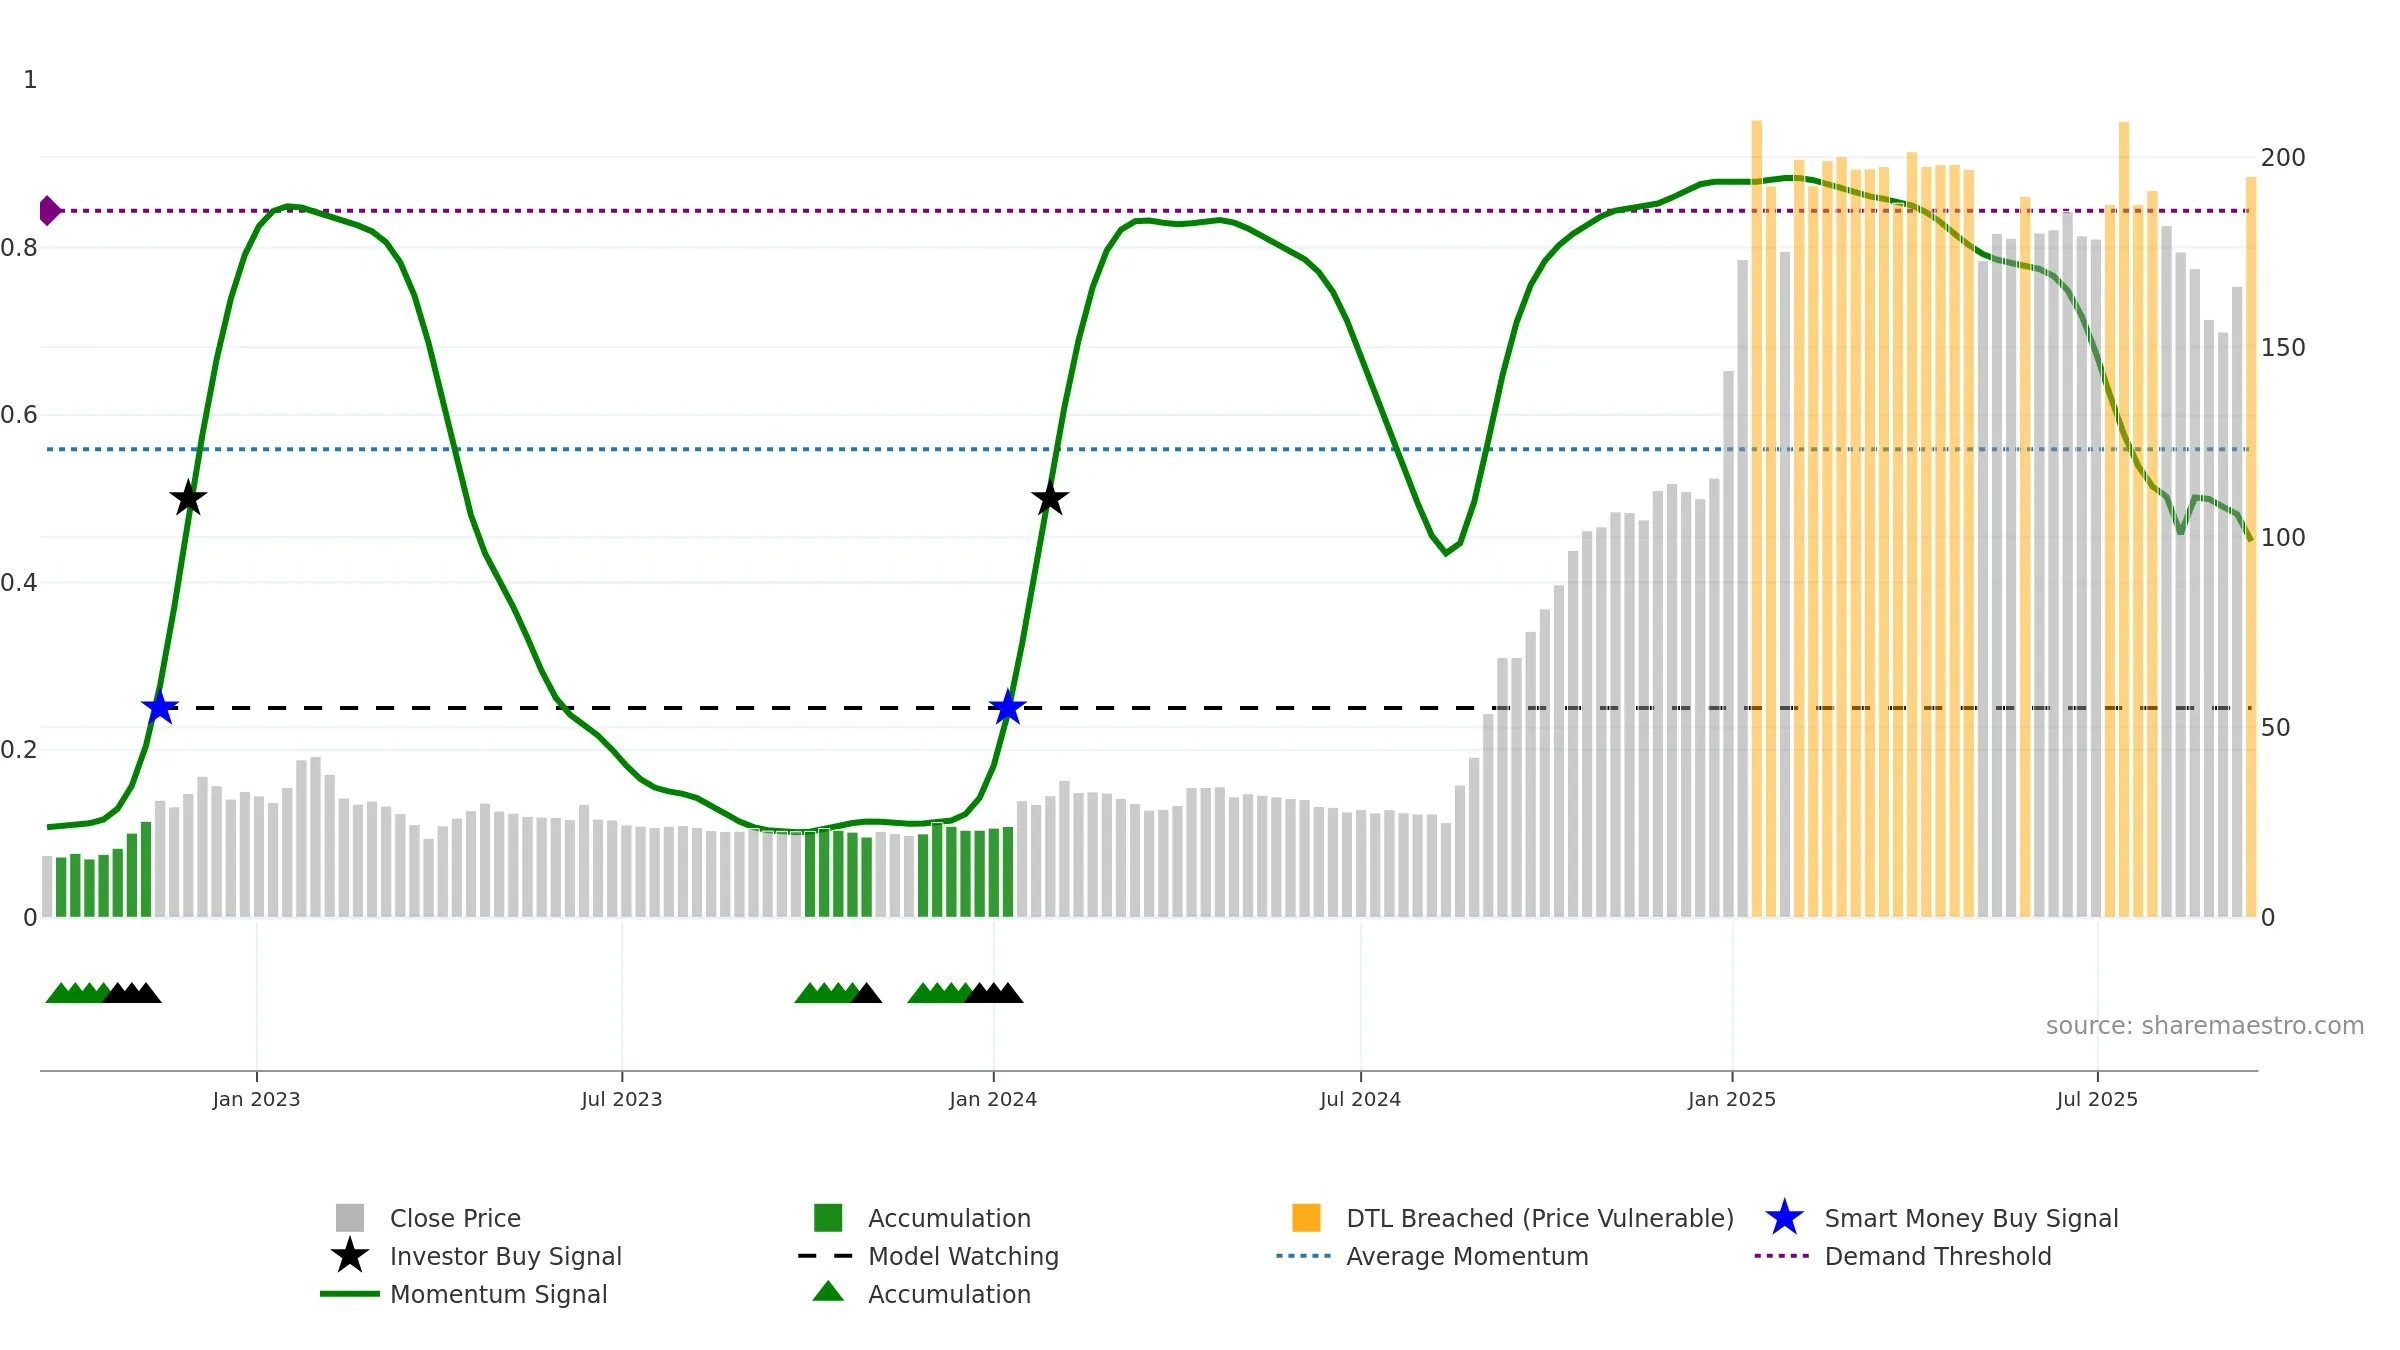
Weekly Report
Indo Thai Securities Limited closed at 194.9700 (-6.26% WoW) . Data window ends Mon, 15 Sep 2025.
How to read this — Price slope is downward, indicating persistent supply pressure. Elevated weekly volatility increases whipsaw risk. Volume trend diverges from price — watch for fatigue or rotation. Returns are positively correlated with volume — strength tends to arrive on higher activity. Distance to baseline is narrowing — reverting closer to its fair-value track. Weak MA stack argues for caution; rallies can fail near the 8–13 week region. Price holds above key averages, indicating constructive participation.
Down-slope argues for patience; rallies can fade sooner unless participation improves. Because liquidity isn’t confirming, prefer evidence of fresh demand before chasing moves.
Gauge maps the trend signal to a 0–100 scale.
How to read this — Range-bound conditions; conviction is limited until a break or acceleration emerges.
Wait for a directional break or improving acceleration.
Price is above fair value; upside may be capped without catalysts.
Conclusion
Negative setup. ★★☆☆☆ confidence. Price window: 1. Trend: Range / Neutral; gauge 44. In combination, liquidity diverges from price.
- Price holds above 8w & 26w averages
- Momentum is weak/falling
- Weak moving-average stack
- Liquidity diverges from price
- High return volatility raises whipsaw risk
Why: Price window 1.96% over 8w. Close is 1.96% above the prior-window high. Return volatility 4.62%. Volume trend rising. Liquidity divergence with price. Trend state range / neutral. MA stack weak. Baseline deviation 1.63% (narrowing). Momentum neutral and falling. Valuation limited upside without catalysts.
Tip: Most metrics include a hover tooltip where they appear in the report.