Heeros Oyj
HEEROS HEL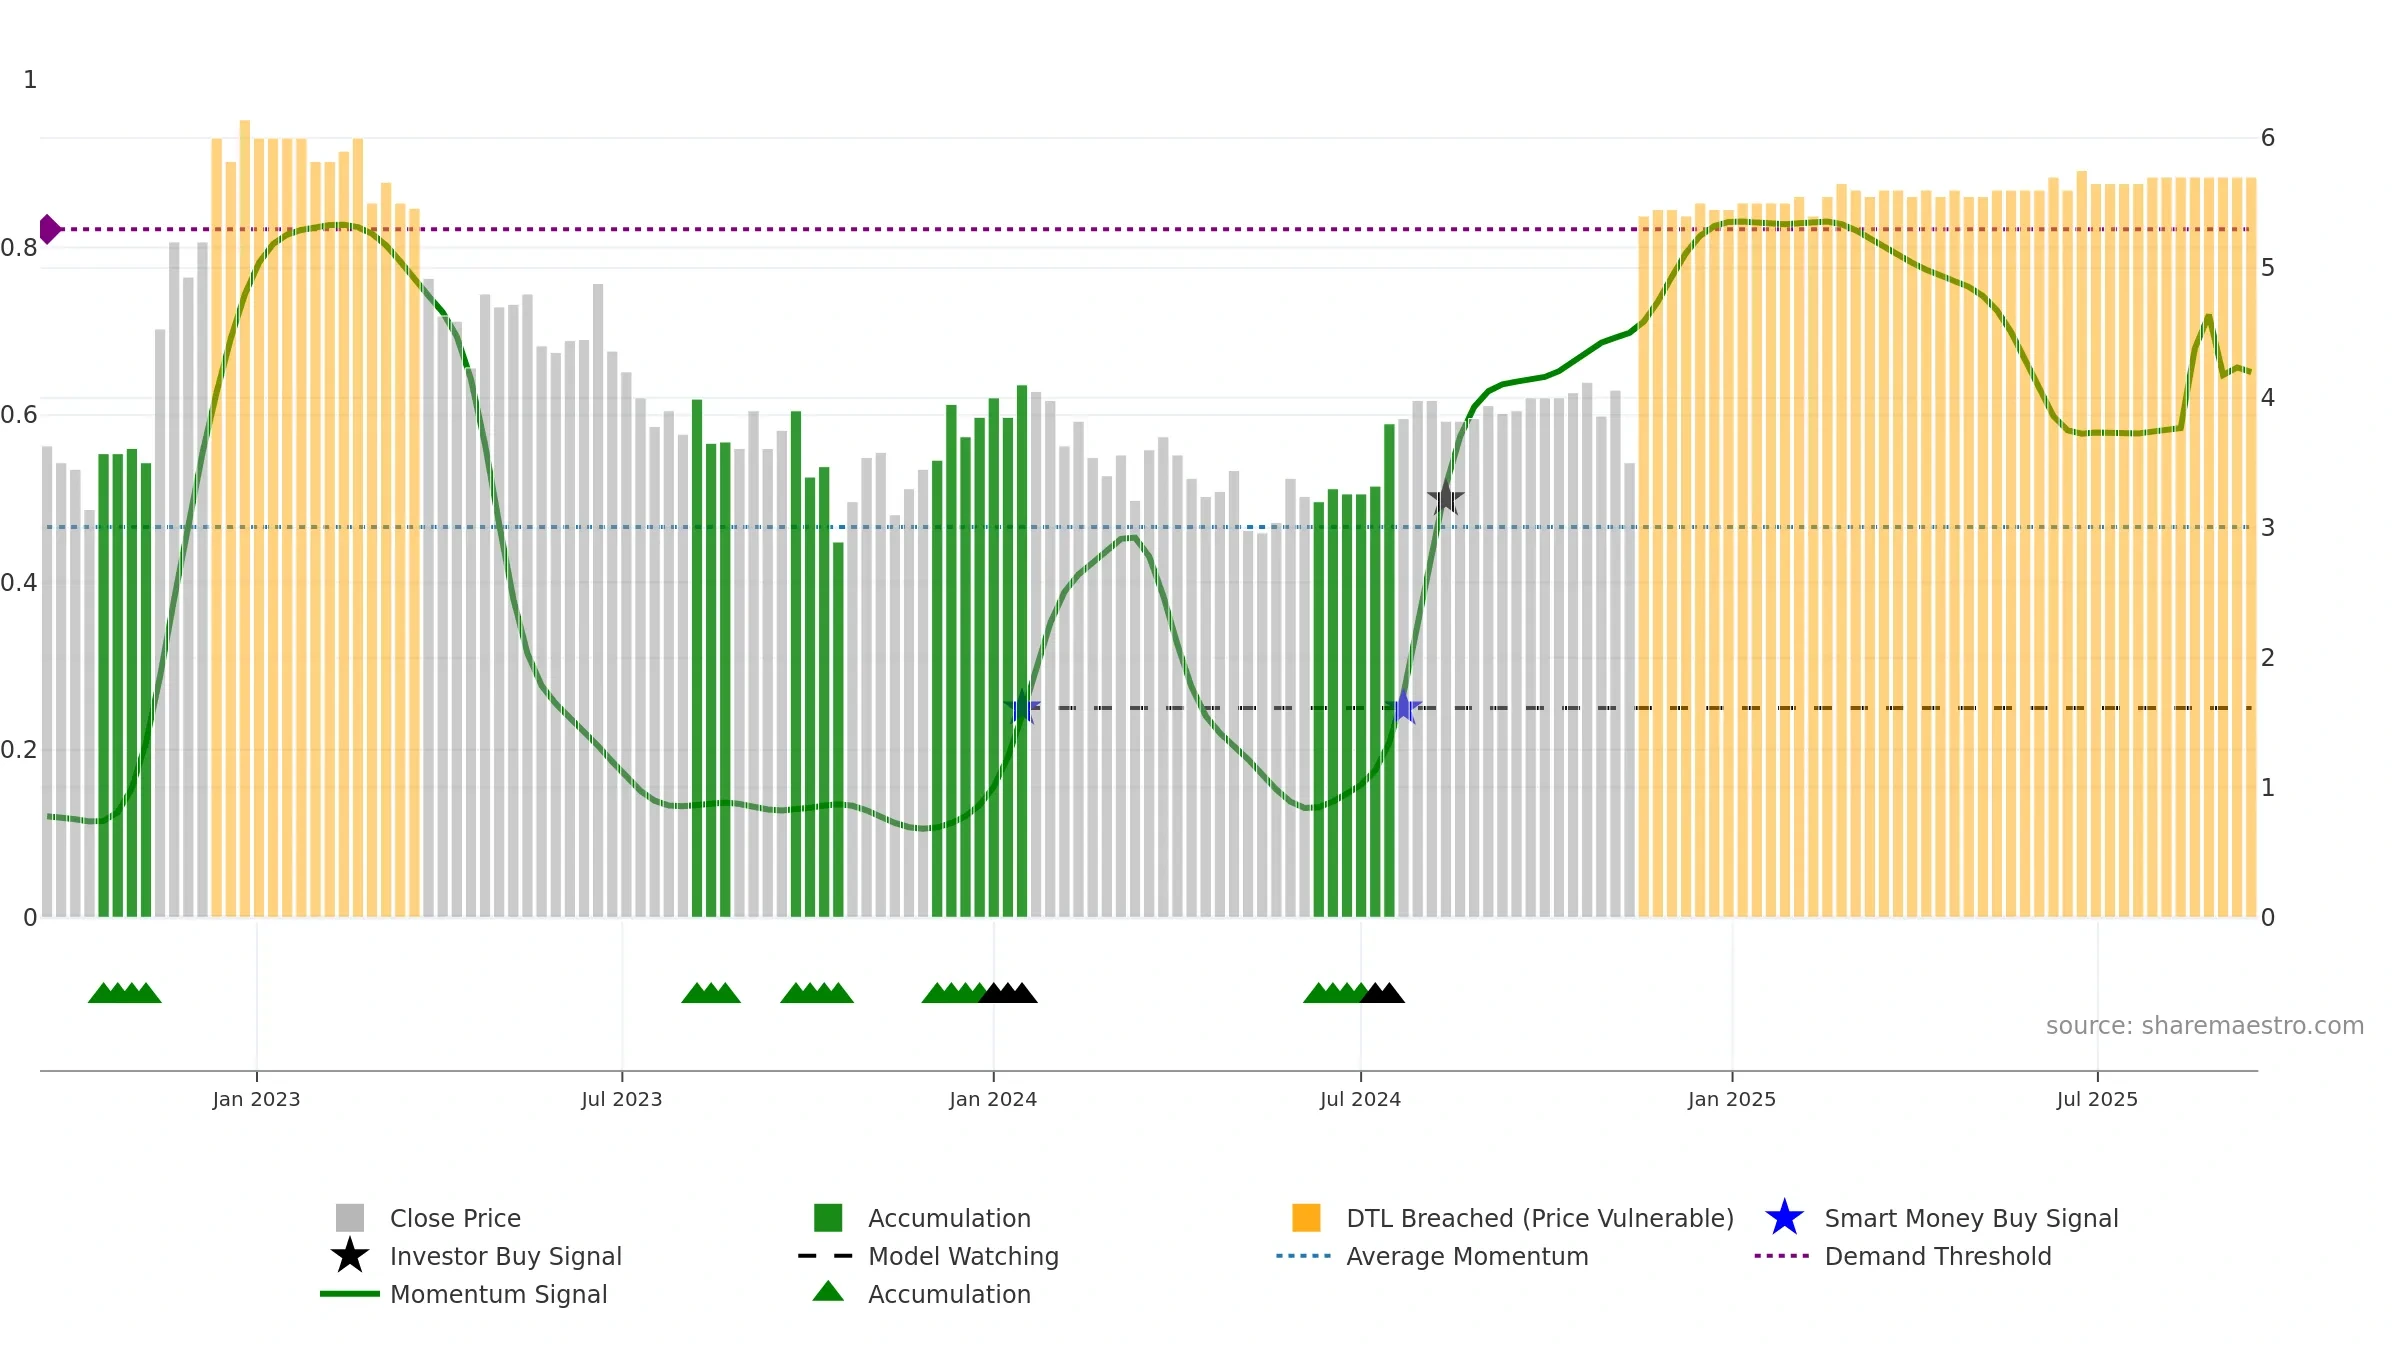
Weekly Report
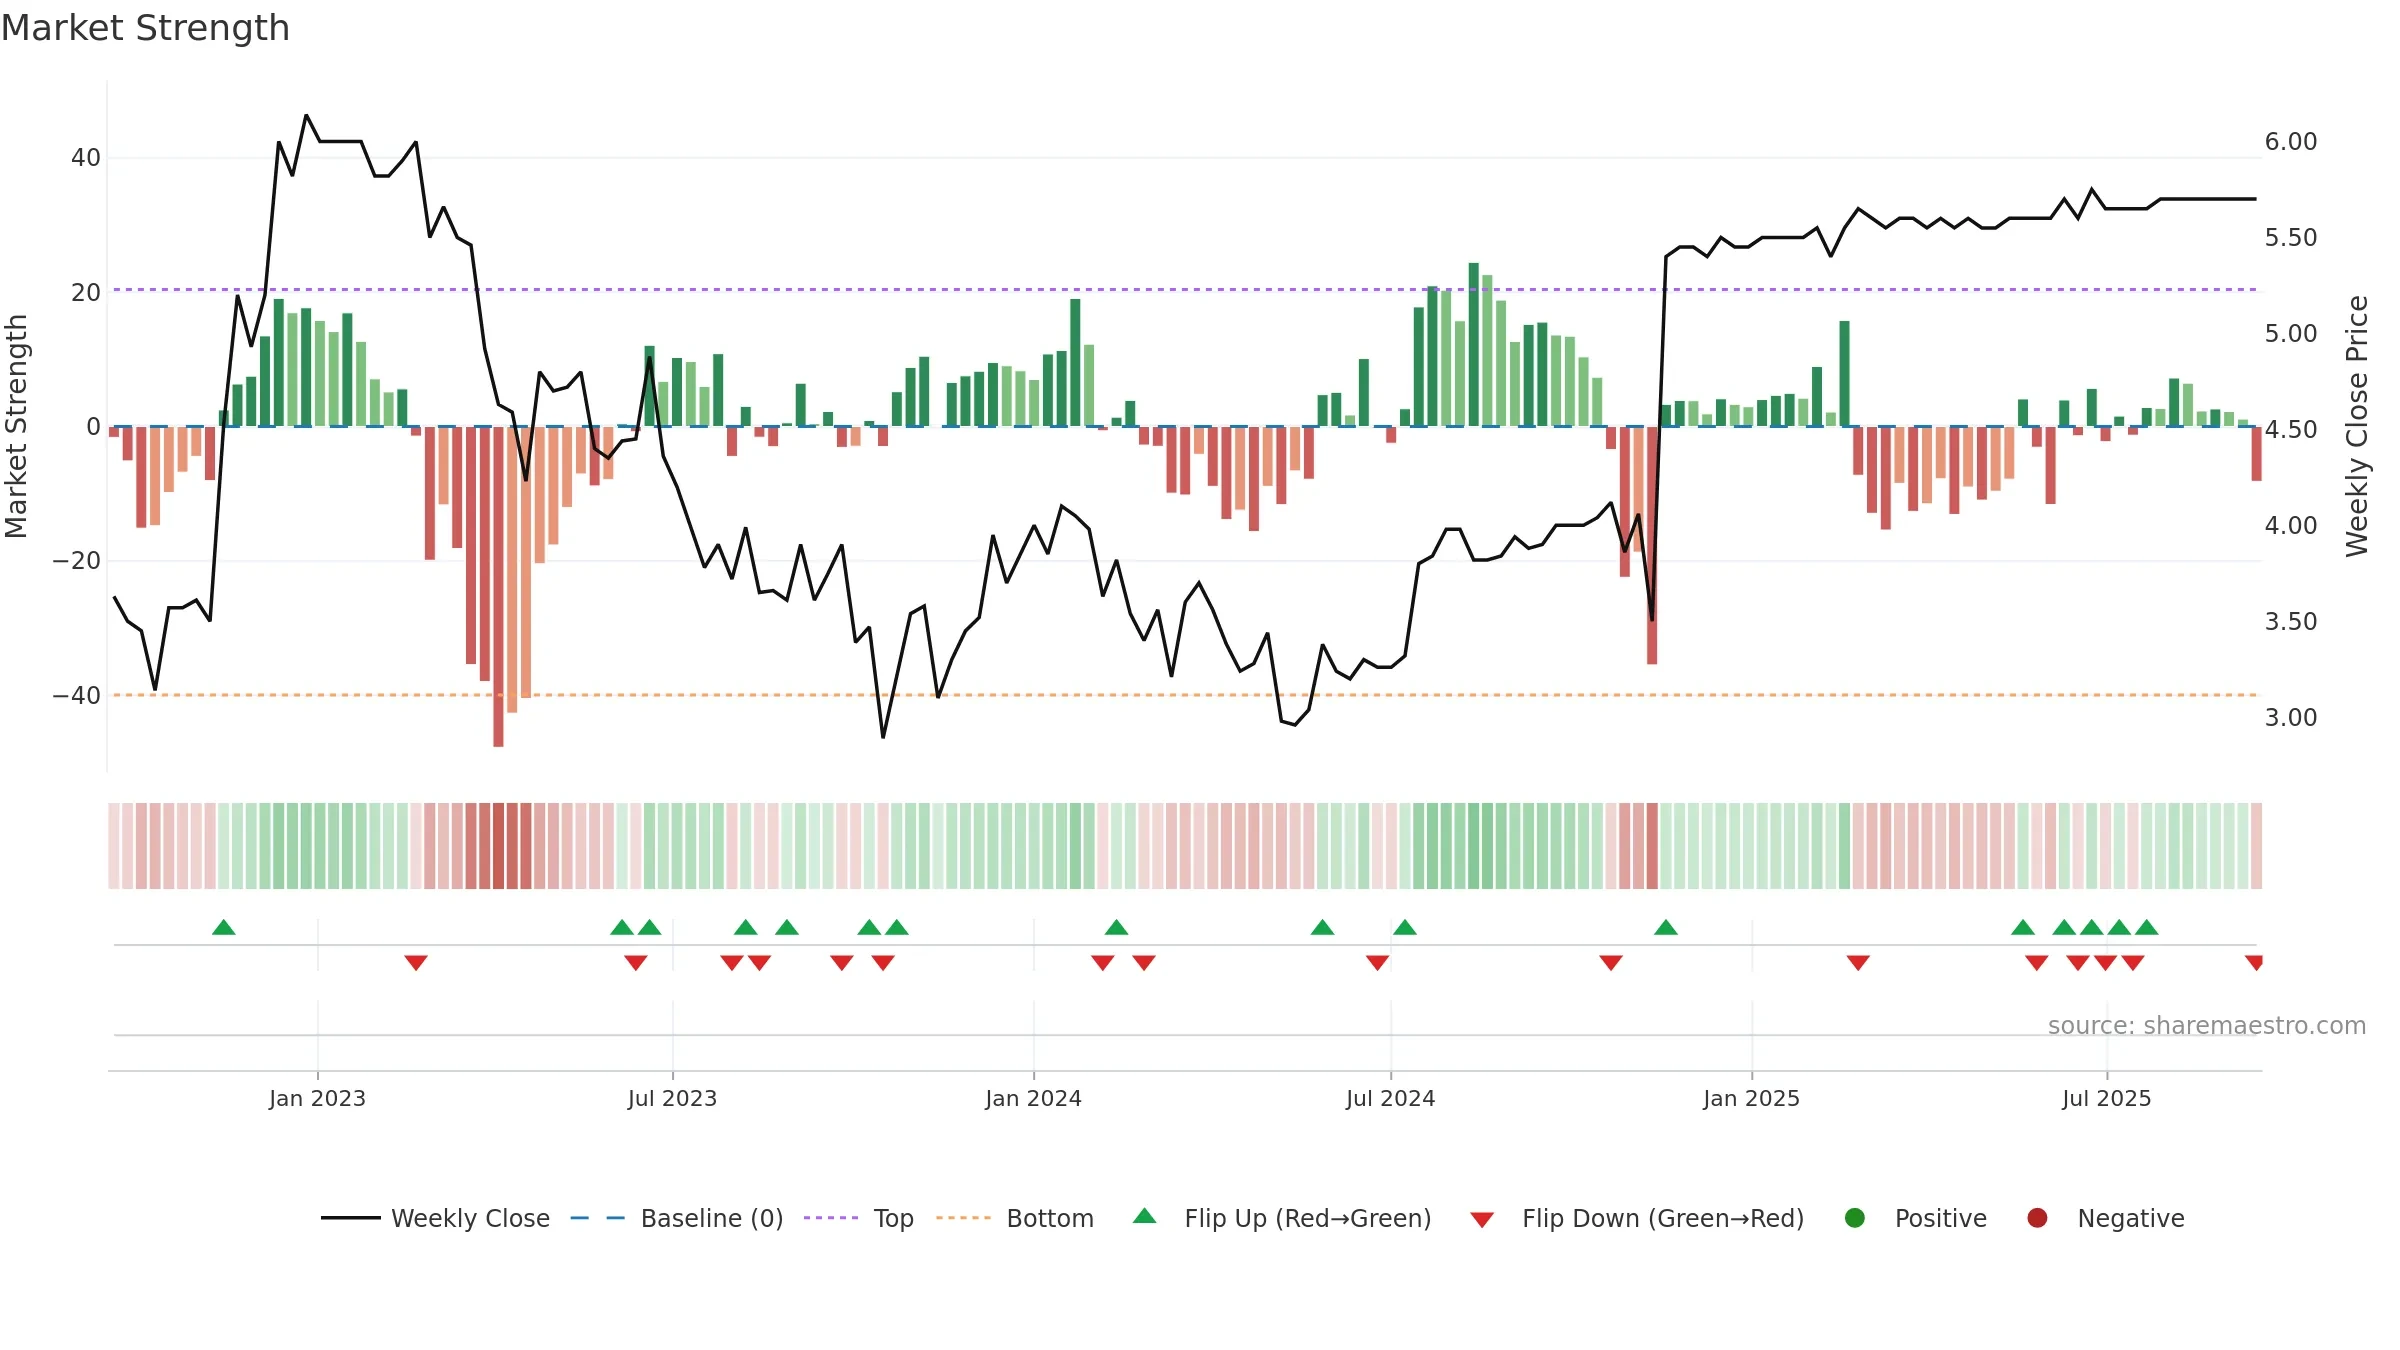
Heeros Oyj closed at 5.7000 (0.00% WoW) . Data window ends Mon, 15 Sep 2025.
How to read this — Price slope is flat, suggesting balance between buyers and sellers. Low weekly volatility favours steadier follow-through. Volume or price is flat; confirmation from liquidity is limited.
Flat slope suggests a wait-and-see approach until the balance shifts.
Gauge maps the trend signal to a 0–100 scale.
How to read this — Gauge is elevated but momentum is rolling over; topping risk is rising.
Stay alert: protect gains or seek confirmation before adding risk.
Price is above fair value; upside may be capped without catalysts.
Conclusion
Neutral setup. ★★★☆☆ confidence. Price window: 0. Trend: Uptrend at Risk; gauge 65. In combination, liquidity confirmation is mixed.
- Momentum is bullish and rising
- Low return volatility supports durability
- High-level but rolling over (topping risk)
- Price is not above key averages
Why: Return volatility 0.00%. Volume trend falling. Liquidity flat with price. Trend state uptrend at risk. Momentum bullish and rising. Valuation limited upside without catalysts.
Tip: Most metrics include a hover tooltip where they appear in the report.