Lyko Group AB (publ)
LYKO-A STO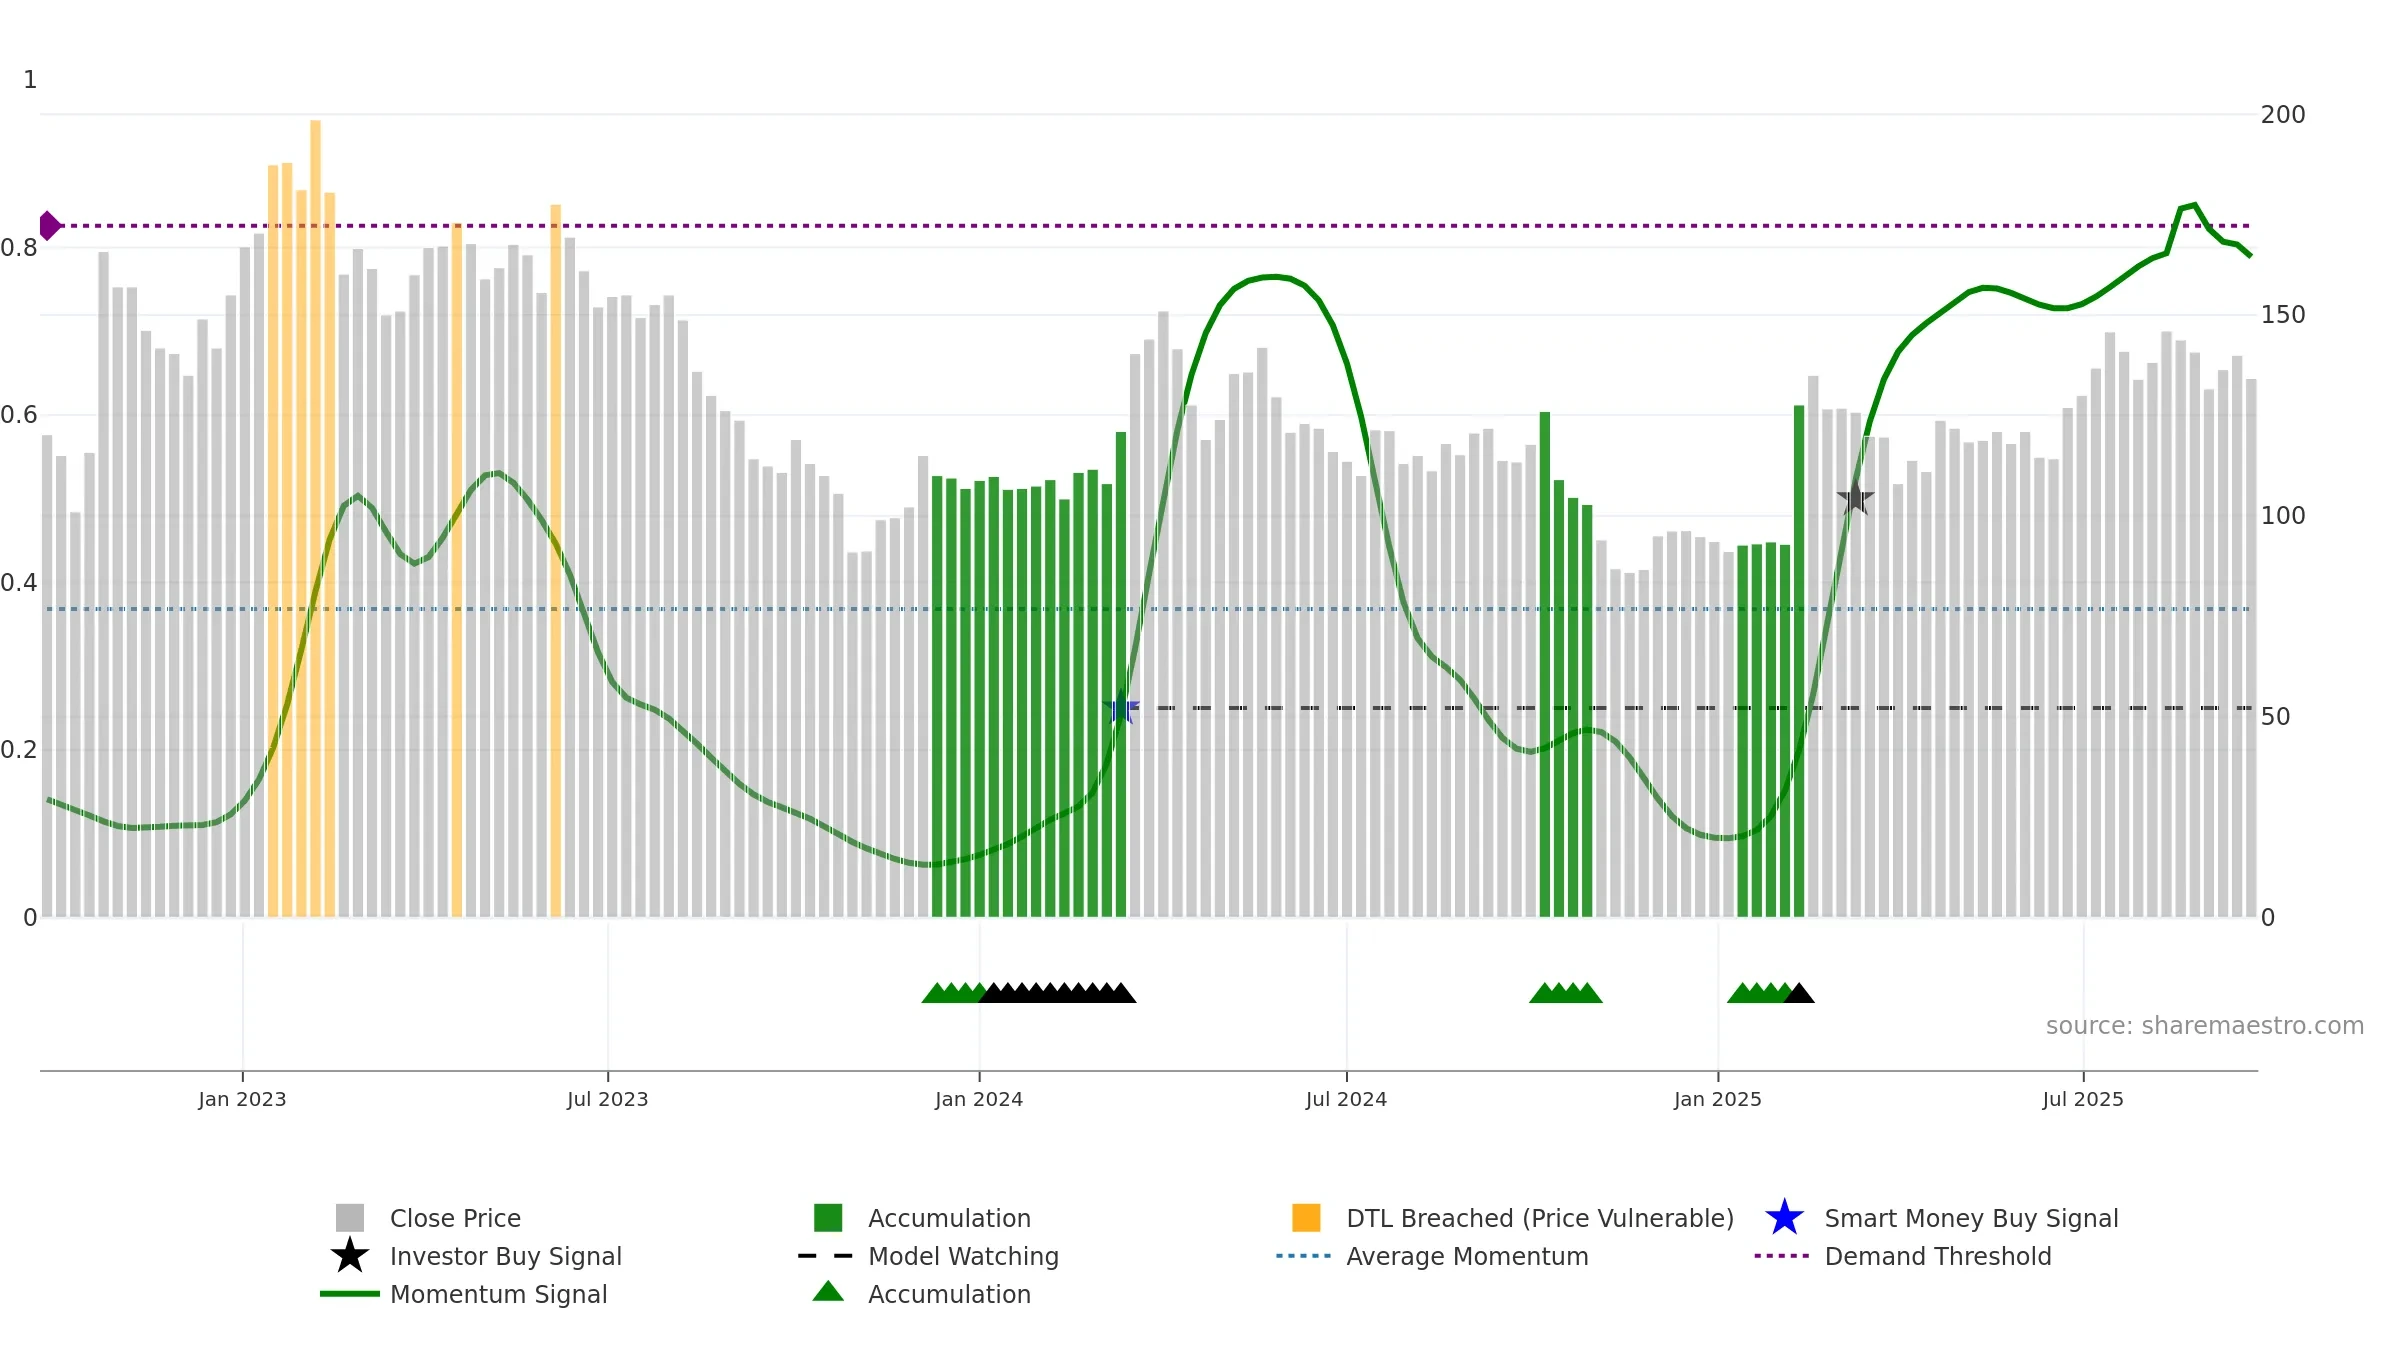
Weekly Summary
Lyko Group AB (publ) closed at 134.2000 (1.67% WoW) . Data window ends Mon, 22 Sep 2025.
How to read this — Price slope is downward, indicating persistent supply pressure. Volume and price are moving in the same direction — a constructive confirmation. Returns are positively correlated with volume — strength tends to arrive on higher activity.
Down-slope argues for patience; rallies can fade sooner unless participation improves.
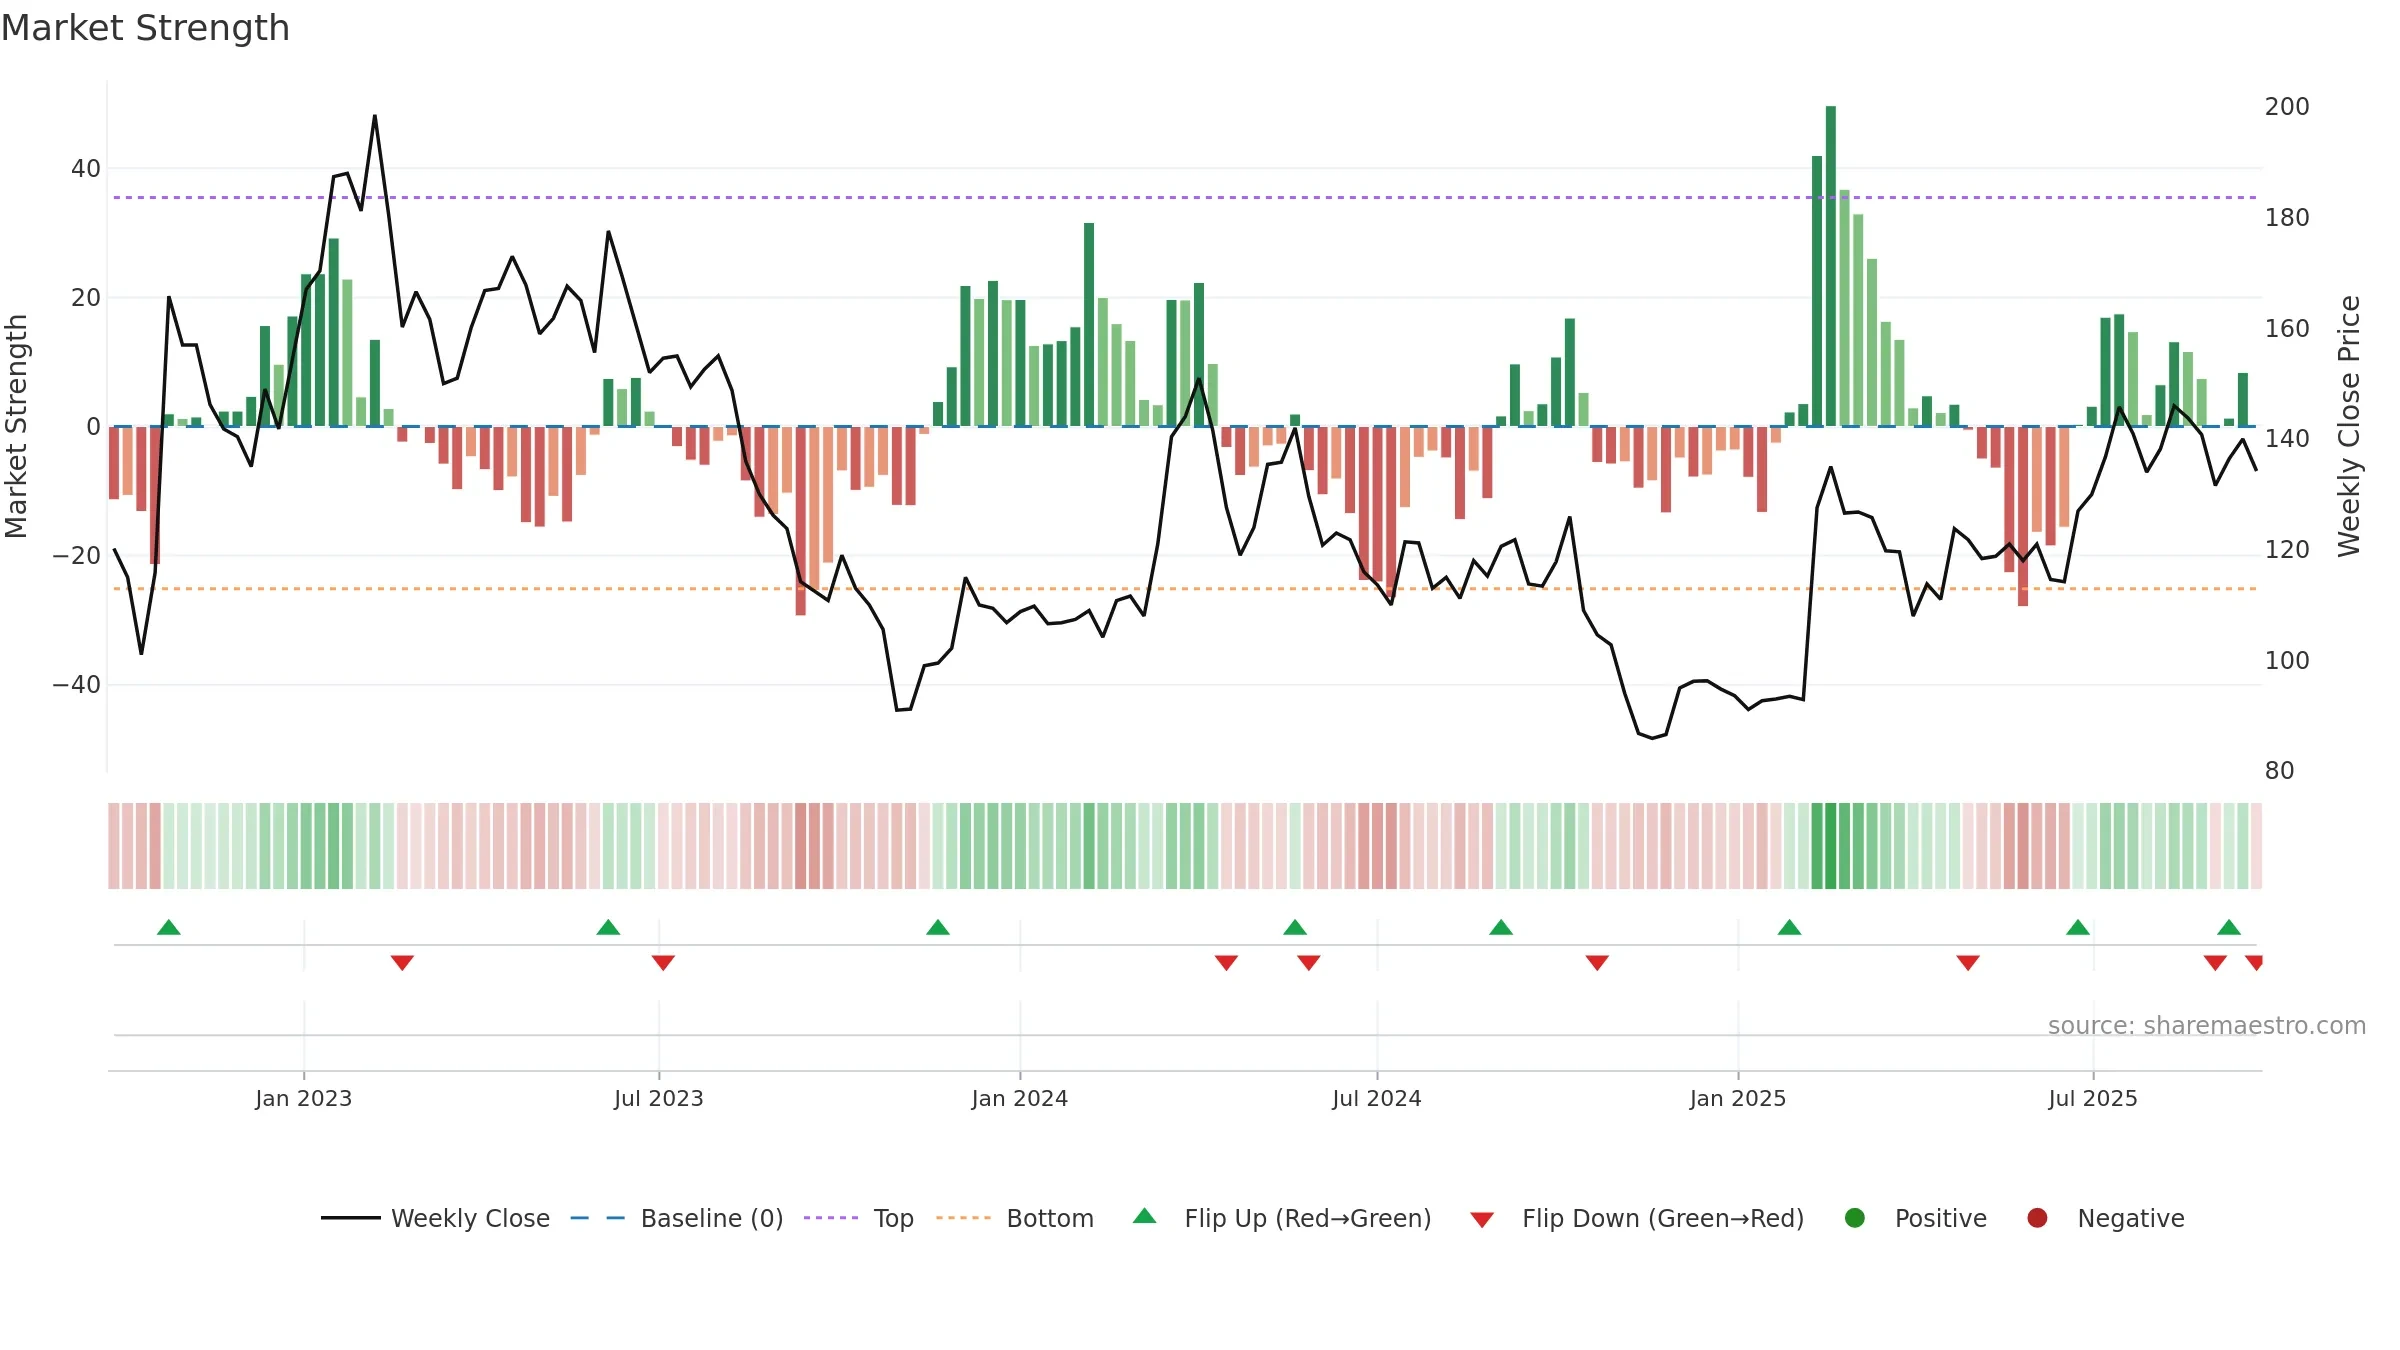
Gauge maps the trend signal to a 0–100 scale.
How to read this — Gauge is elevated but momentum is rolling over; topping risk is rising. Notable breakdown from ≥0.80 weakens trend quality.
Stay alert: protect gains or seek confirmation before adding risk.

Relative strength is Positive
(> 0%, outperforming).
Latest MRS: 5.51% (week ending Fri, 26 Sep 2025).
Slope: Falling over 8w.
Notes:
- Holding above the zero line indicates relative bid.
- MRS slope falling over ~8 weeks.
Price is above fair value; upside may be capped without catalysts.
Conclusion
Negative setup. ★★☆☆☆ confidence. Trend: Uptrend at Risk · -2.89% over window · vol 3.46% · liquidity convergence · posture mixed · RS outperforming
- Liquidity confirms the price trend
- Mansfield RS: outperforming & rising
- High level but momentum rolling over (topping risk)
- Momentum is weak/falling
- Price is not above key averages
- Negative multi-week performance
Why: Price window -2.89% over w. Close is -8.08% below the prior-window high. Volume trend falling. Liquidity convergence with price. Trend state uptrend at risk. Momentum neutral and falling. Valuation limited upside without catalysts.
Tip: Most metrics include a hover tooltip where they appear in the report.