Future Lifestyle Fashions Limited
FLFL NSE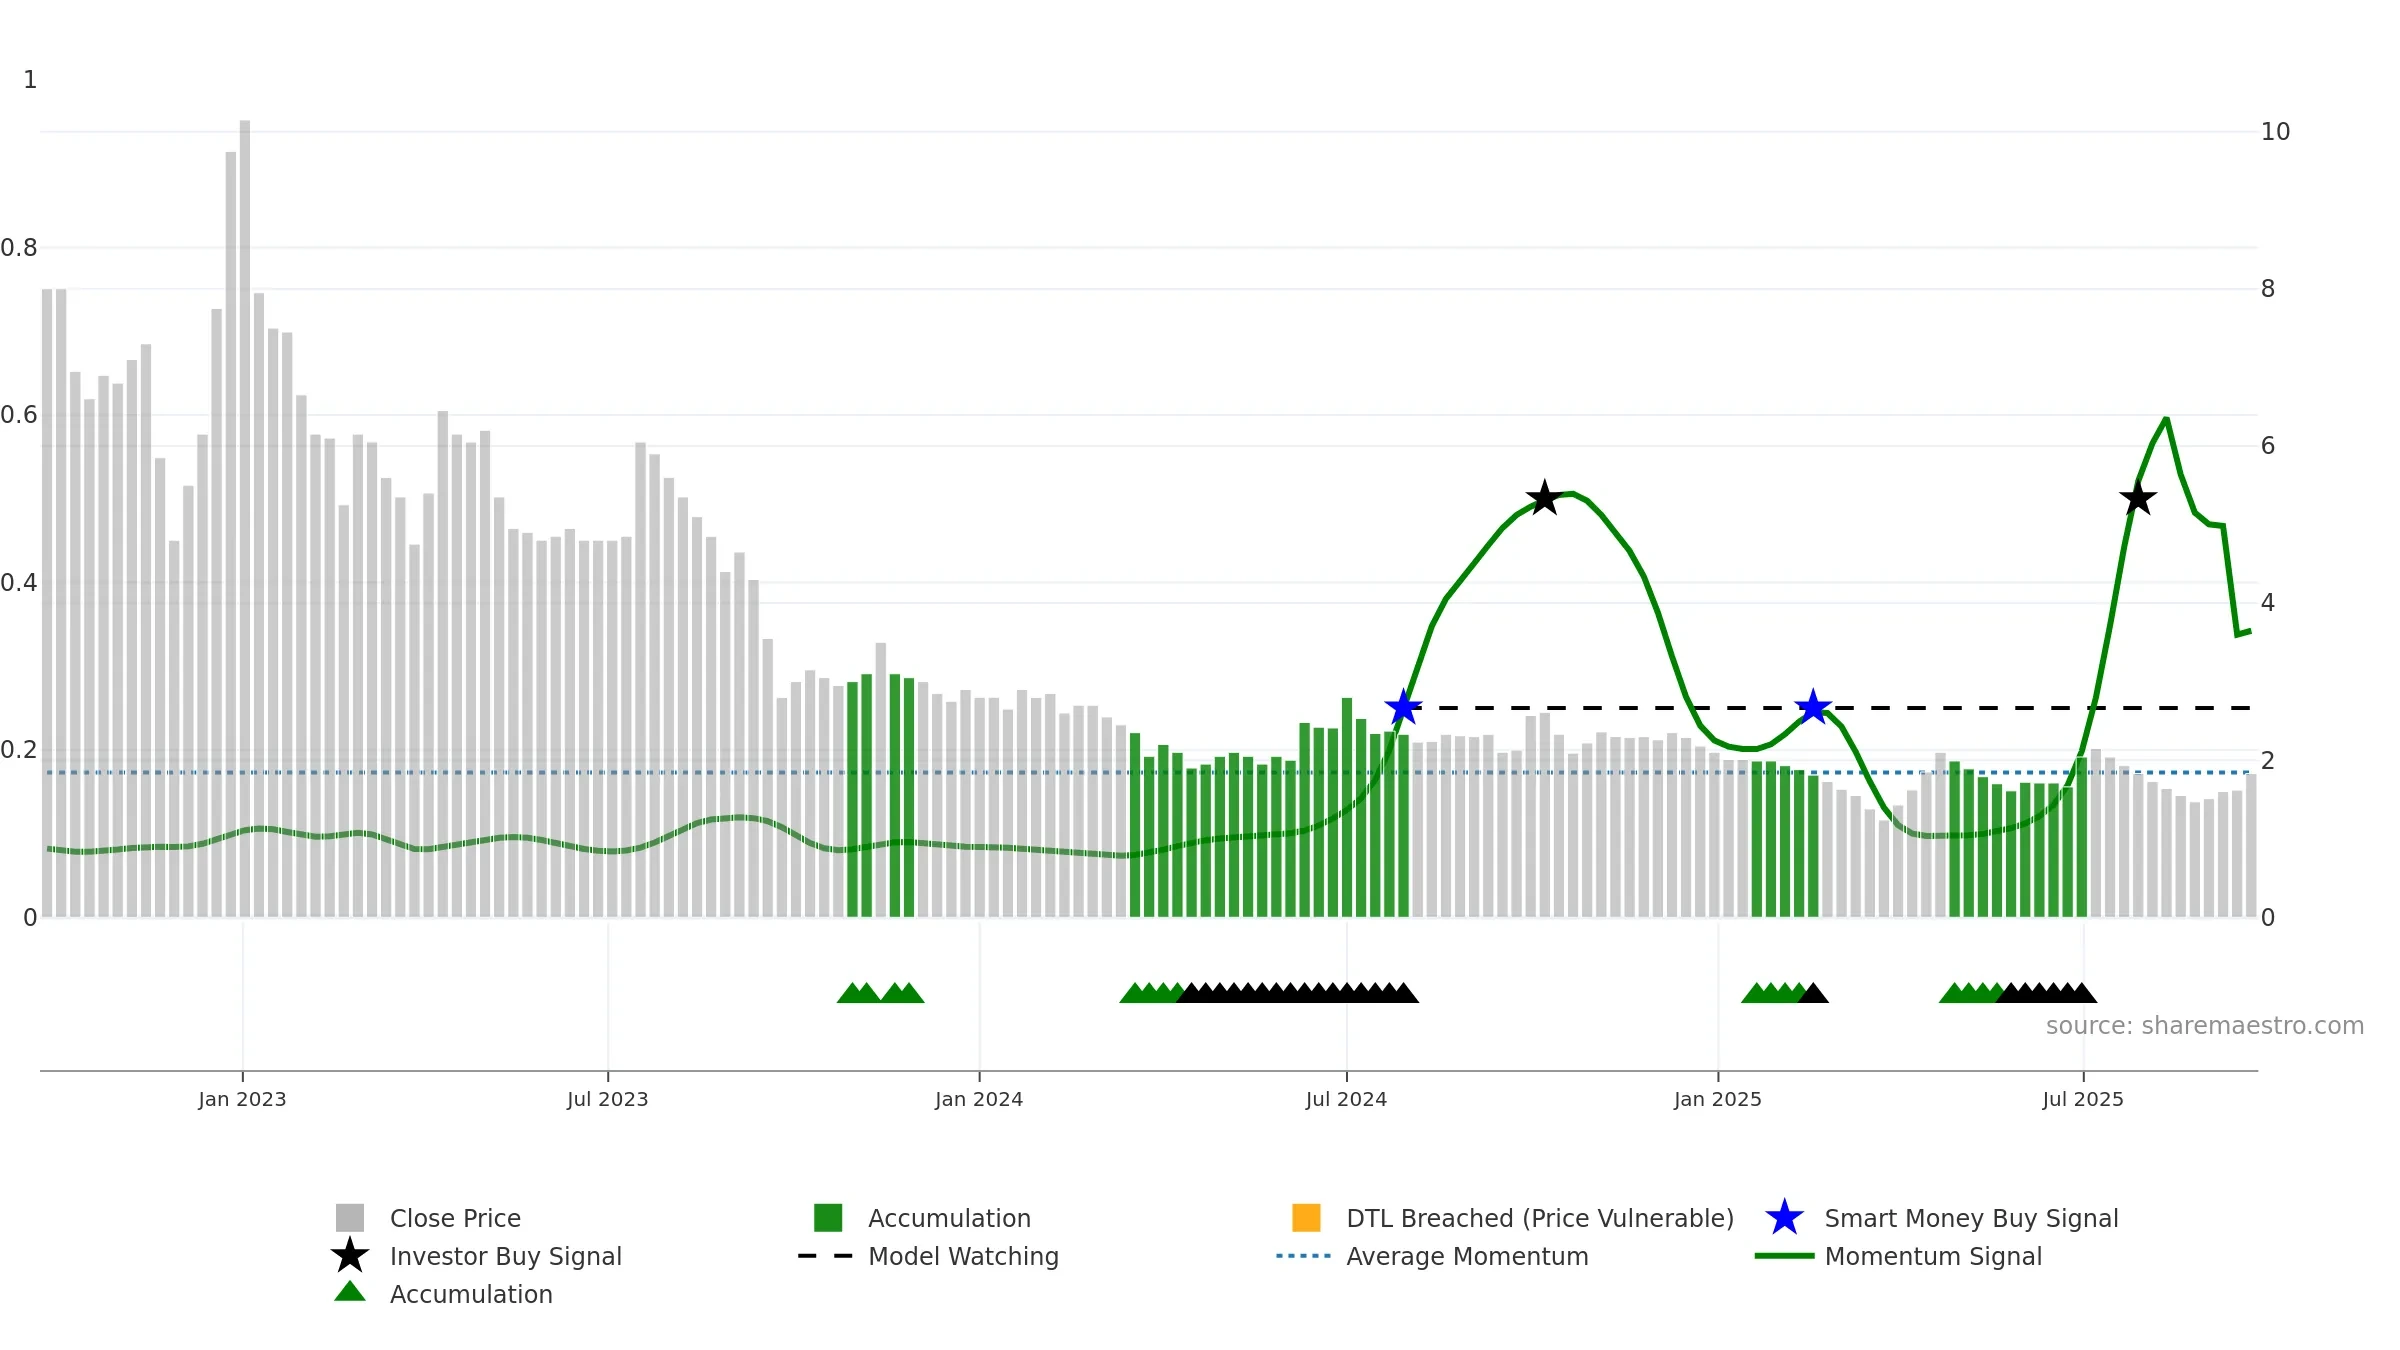
Weekly Summary
Future Lifestyle Fashions Limited closed at 1.8300 (-3.68% WoW) . Data window ends Mon, 22 Sep 2025.
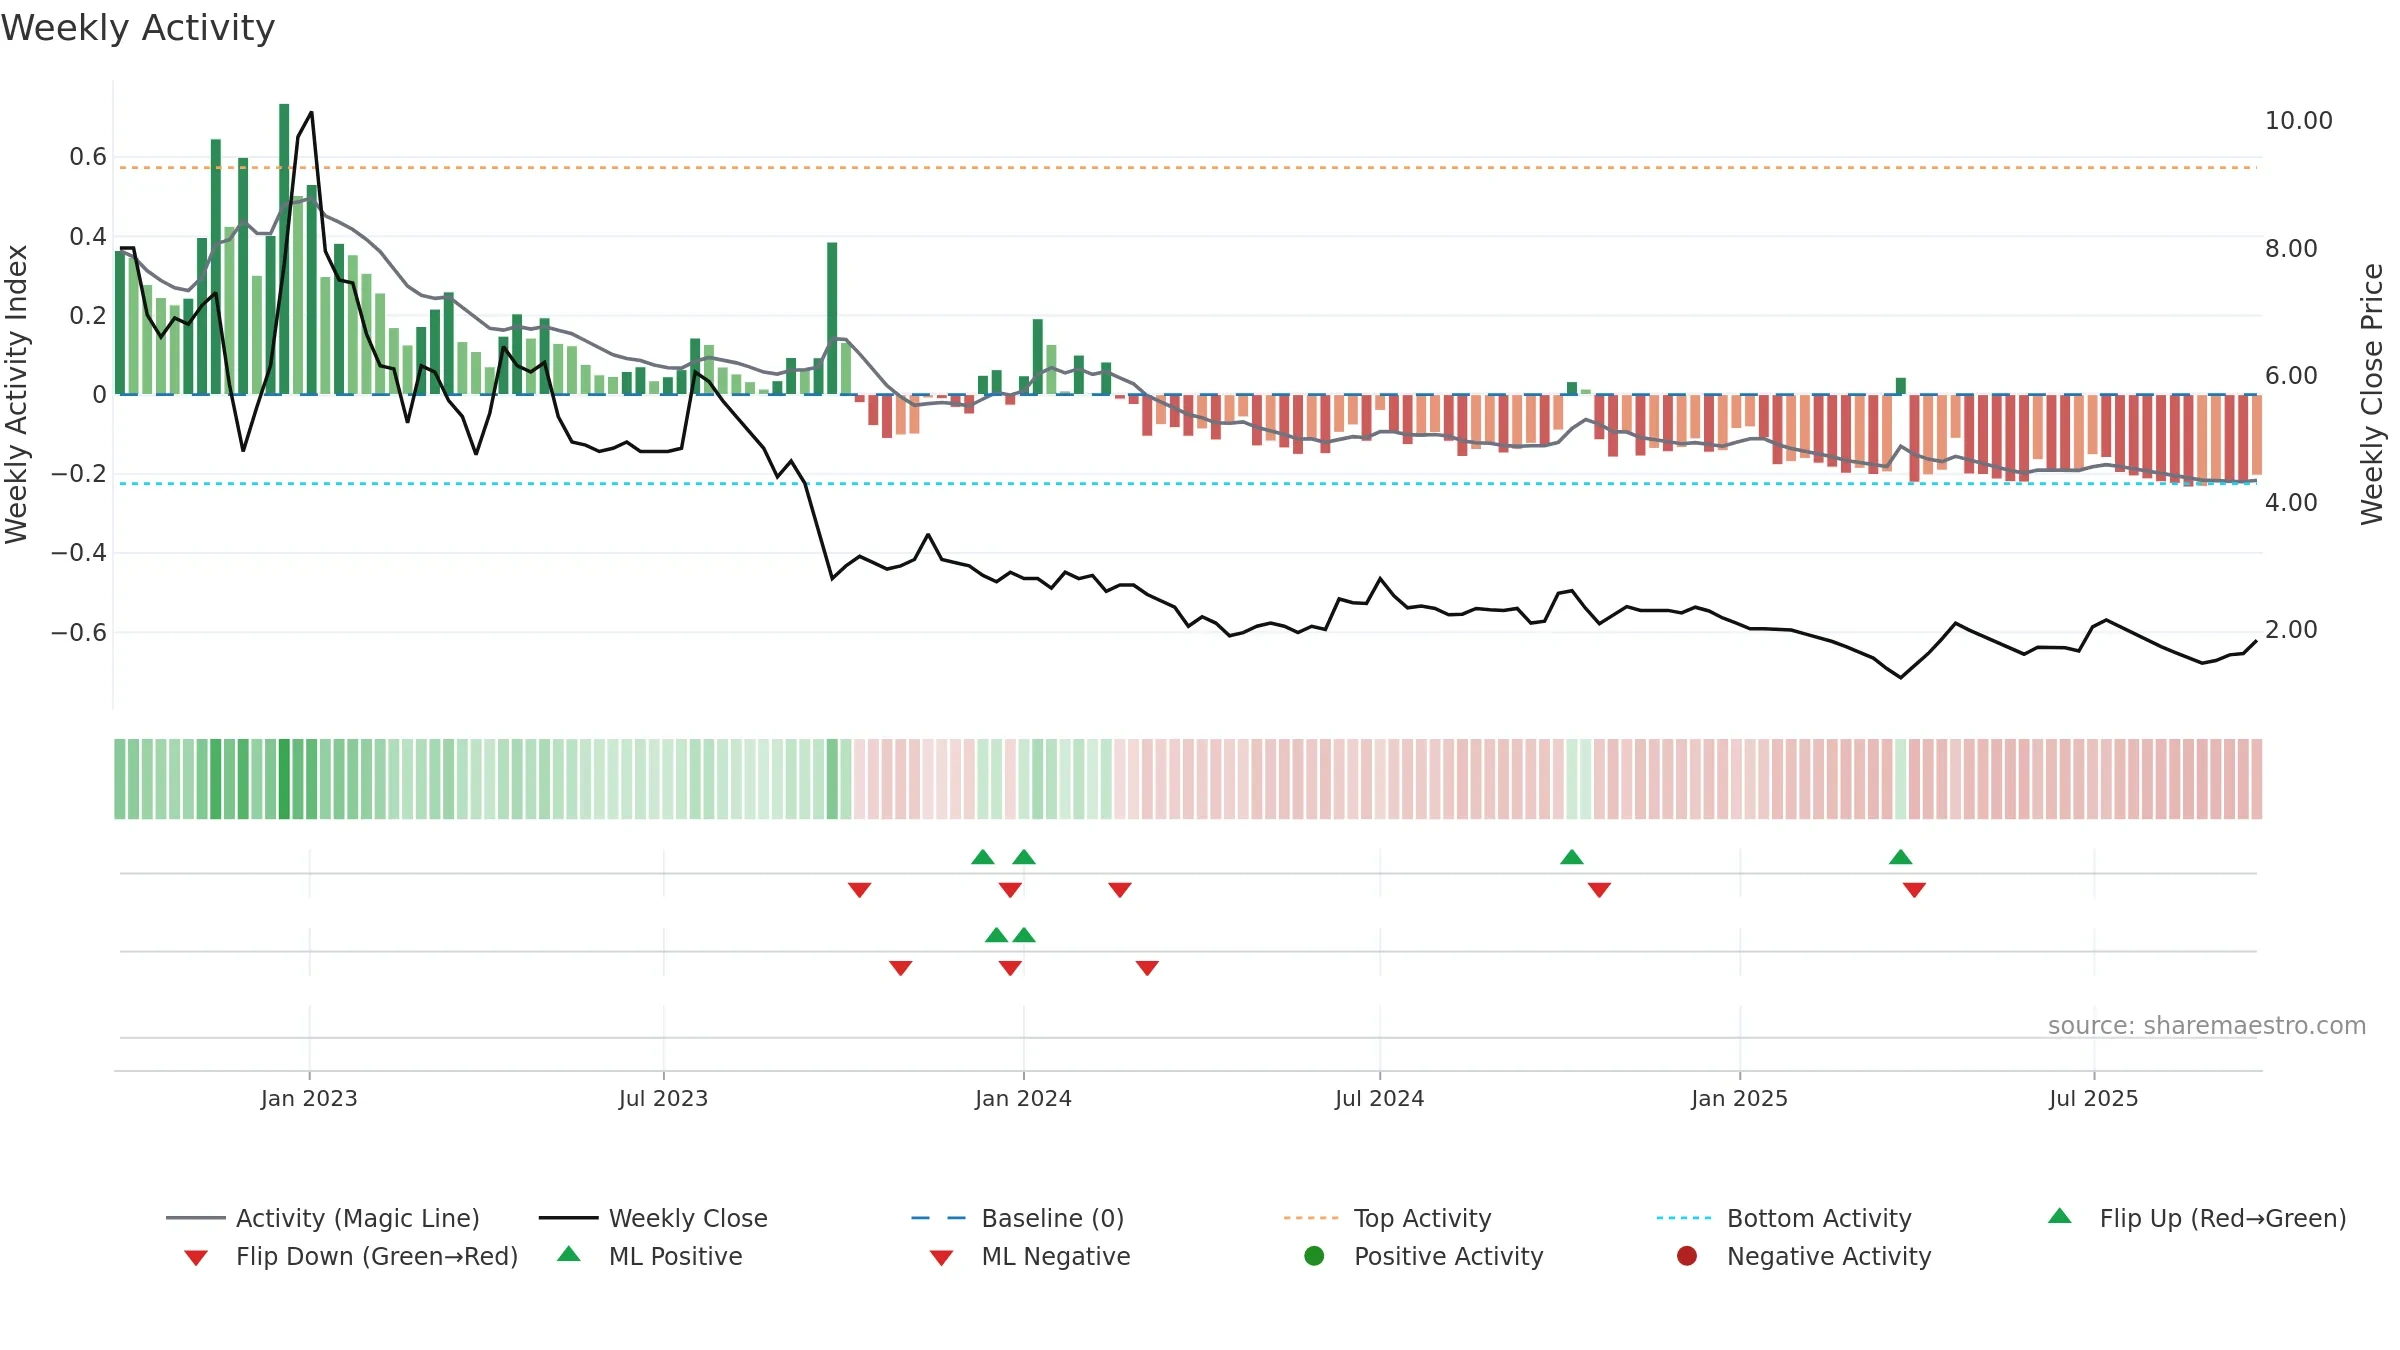
How to read this — Price slope is upward, indicating persistent buying over the window. Volume and price are moving in the same direction — a constructive confirmation. Fresh short-term crossover improves near-term tone. Price holds above key averages, indicating constructive participation.
Up-slope supports buying interest; pullbacks may be contained if activity stays firm.
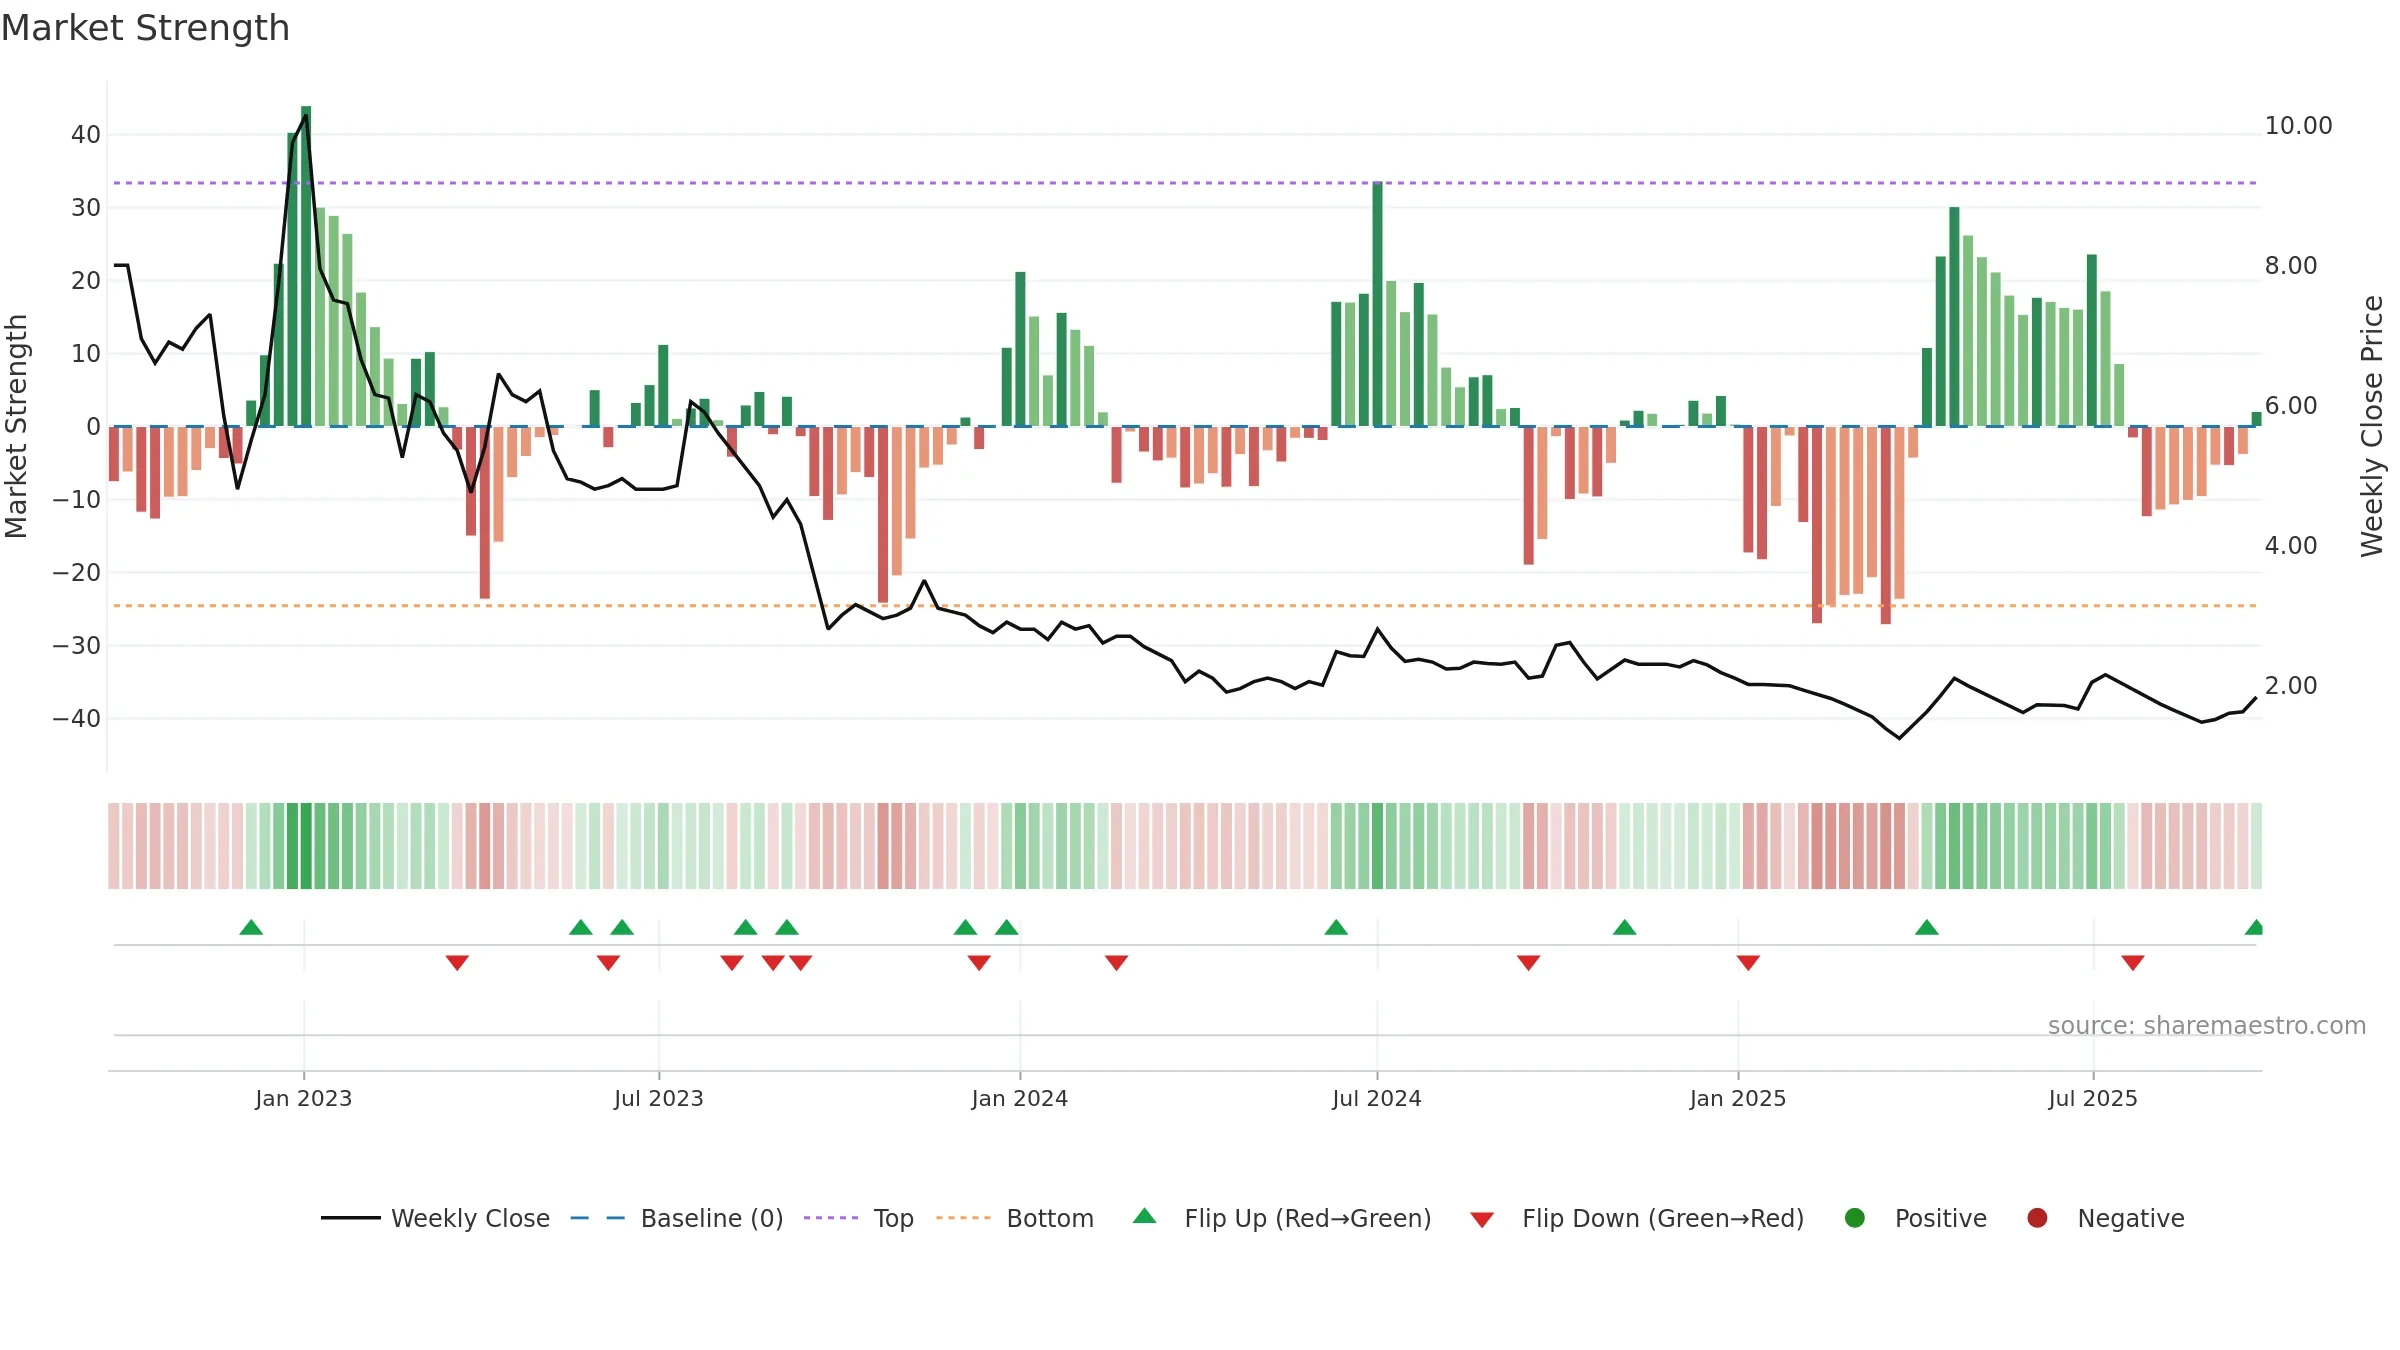
Gauge maps the trend signal to a 0–100 scale.
How to read this — Bearish zone with falling momentum — sellers in control. Sub-0.40 print confirms downside control.
Bias remains lower; rallies are suspect unless gauge reclaims 0.50/0.60.

Relative strength is Negative
(< 0%, underperforming).
Latest MRS: -13.03% (week ending Fri, 19 Sep 2025).
Slope: Falling over 8w.
Notes:
- Below zero line indicates relative weakness vs benchmark.
- MRS slope falling over ~8 weeks.
Conclusion
Negative setup. ★⯪☆☆☆ confidence. Trend: Downtrend Confirmed · 5.78% over window · vol 2.23% · liquidity convergence · posture above · RS weak
- Price holds above 8–26 week averages
- Liquidity confirms the price trend
- Bearish control with falling momentum
- Momentum is weak/falling
- Sub-0.40 print confirms bear control
- Mansfield RS: weak & falling
Why: Price window 5.78% over w. Close is 5.78% above the prior-window high. Return volatility 2.23%. Volume trend rising. Liquidity convergence with price. Trend state downtrend confirmed. 4–8w crossover bullish. Momentum bearish and falling.
Tip: Most metrics include a hover tooltip where they appear in the report.