Fubon Financial Holding Co., Ltd.
2881 TPE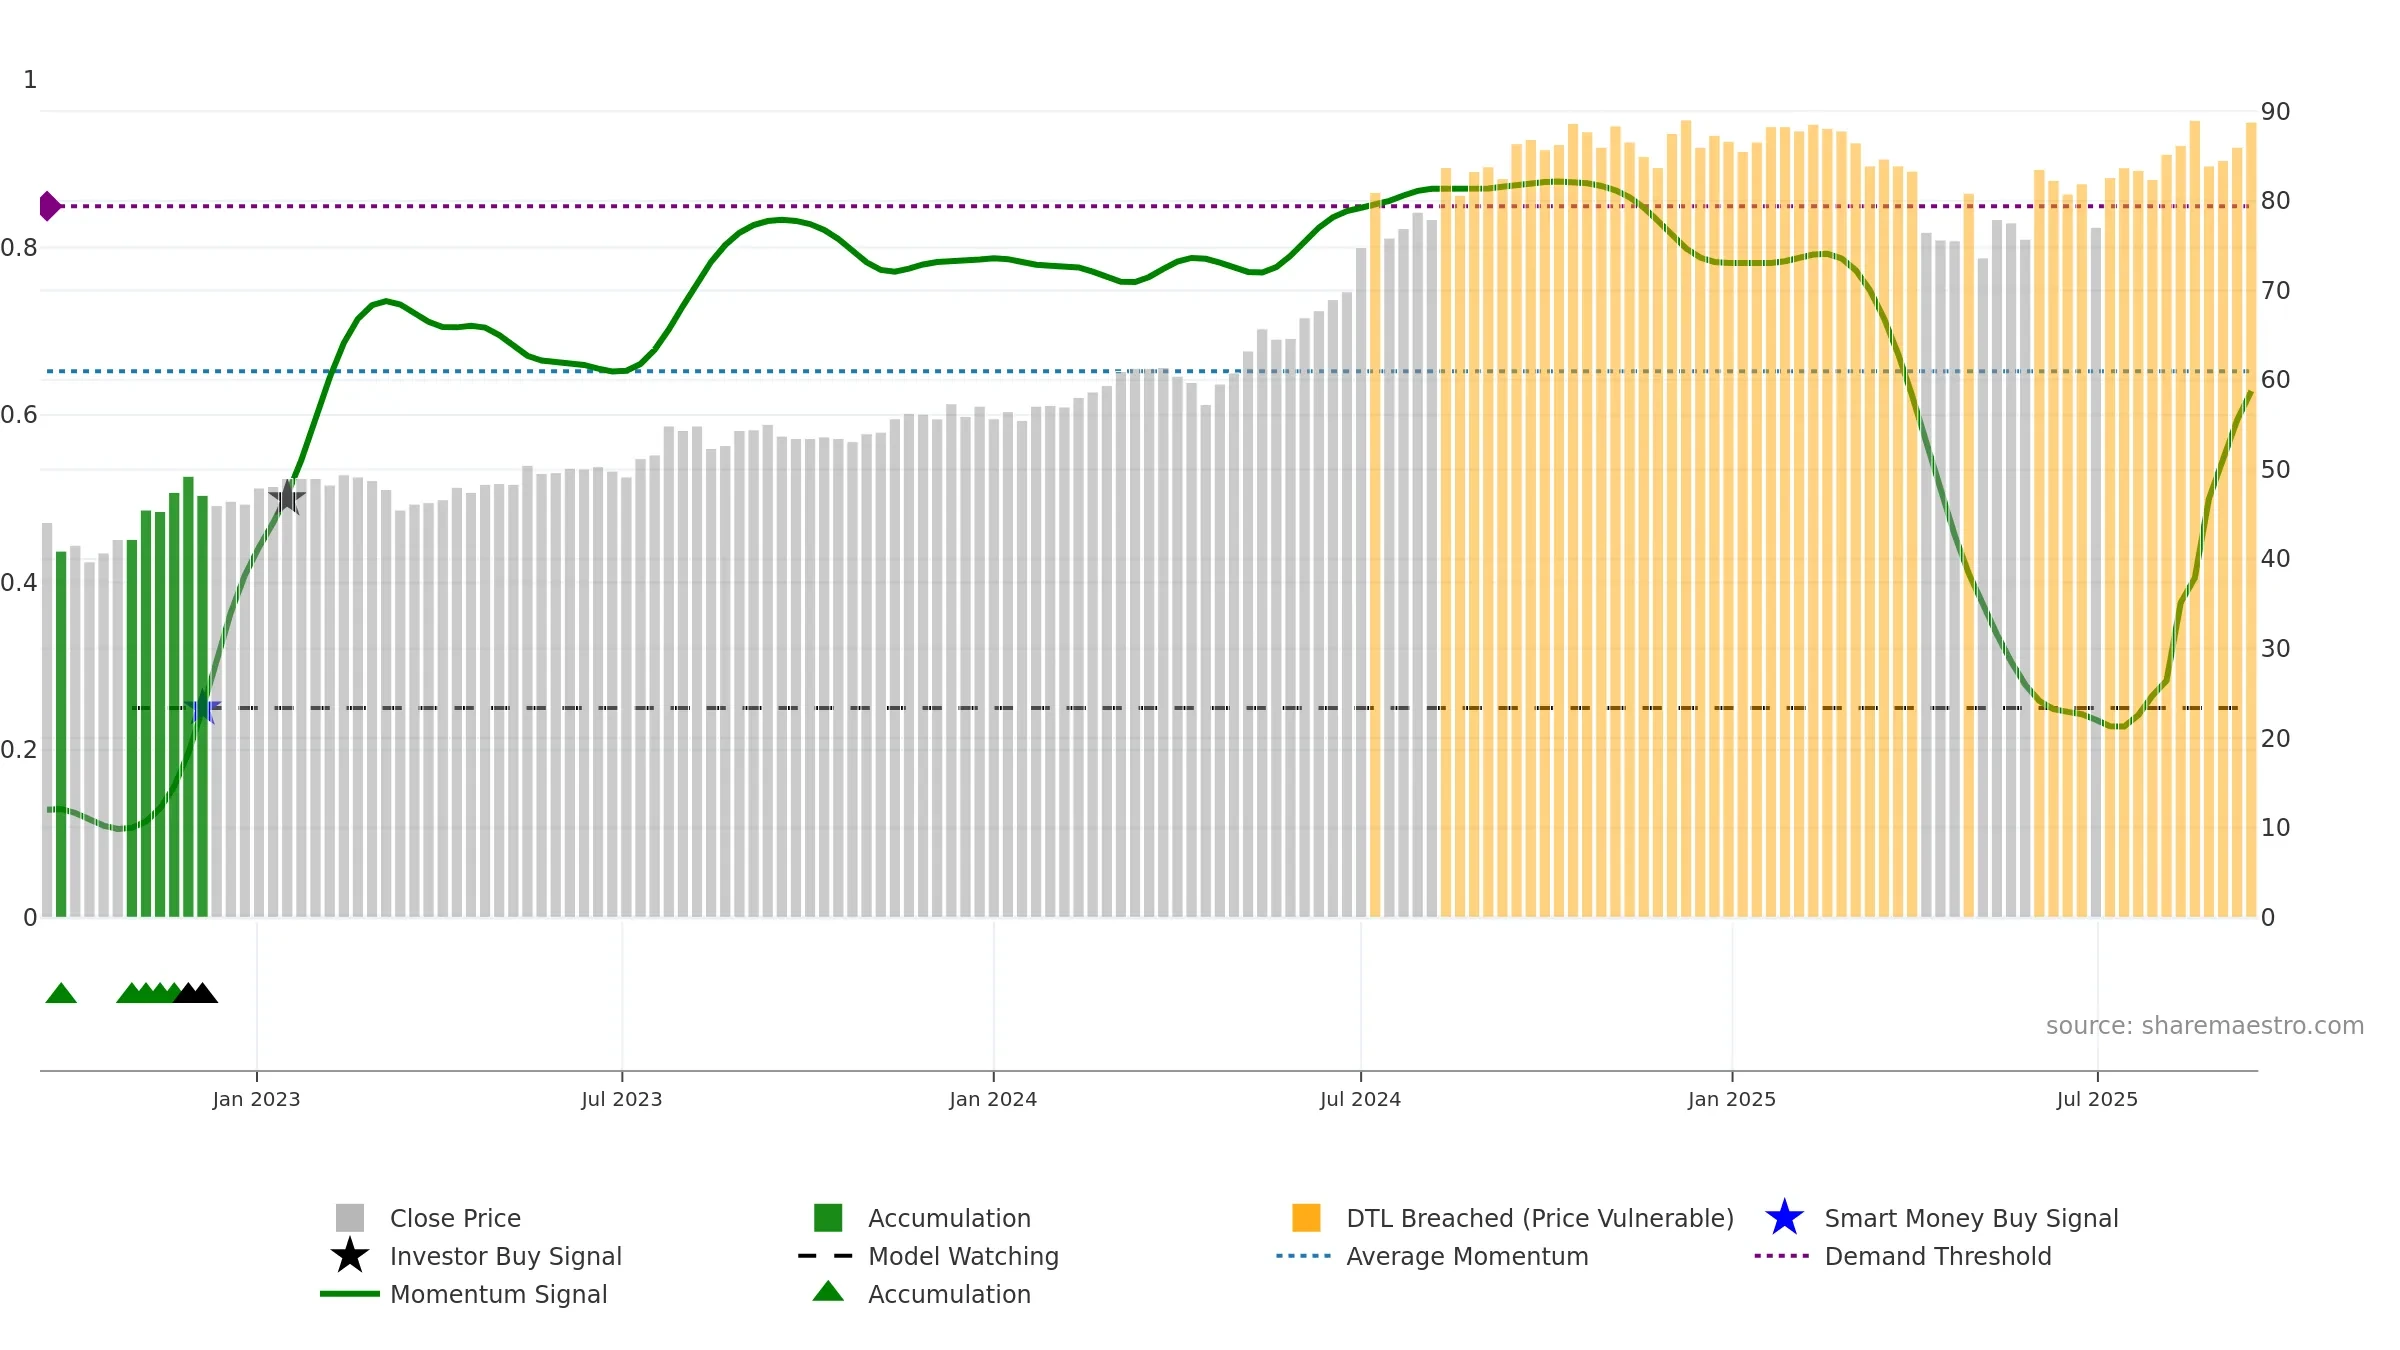
Weekly Report
Fubon Financial Holding Co., Ltd. closed at 88.8000 (0.34% WoW) . Data window ends Mon, 15 Sep 2025.
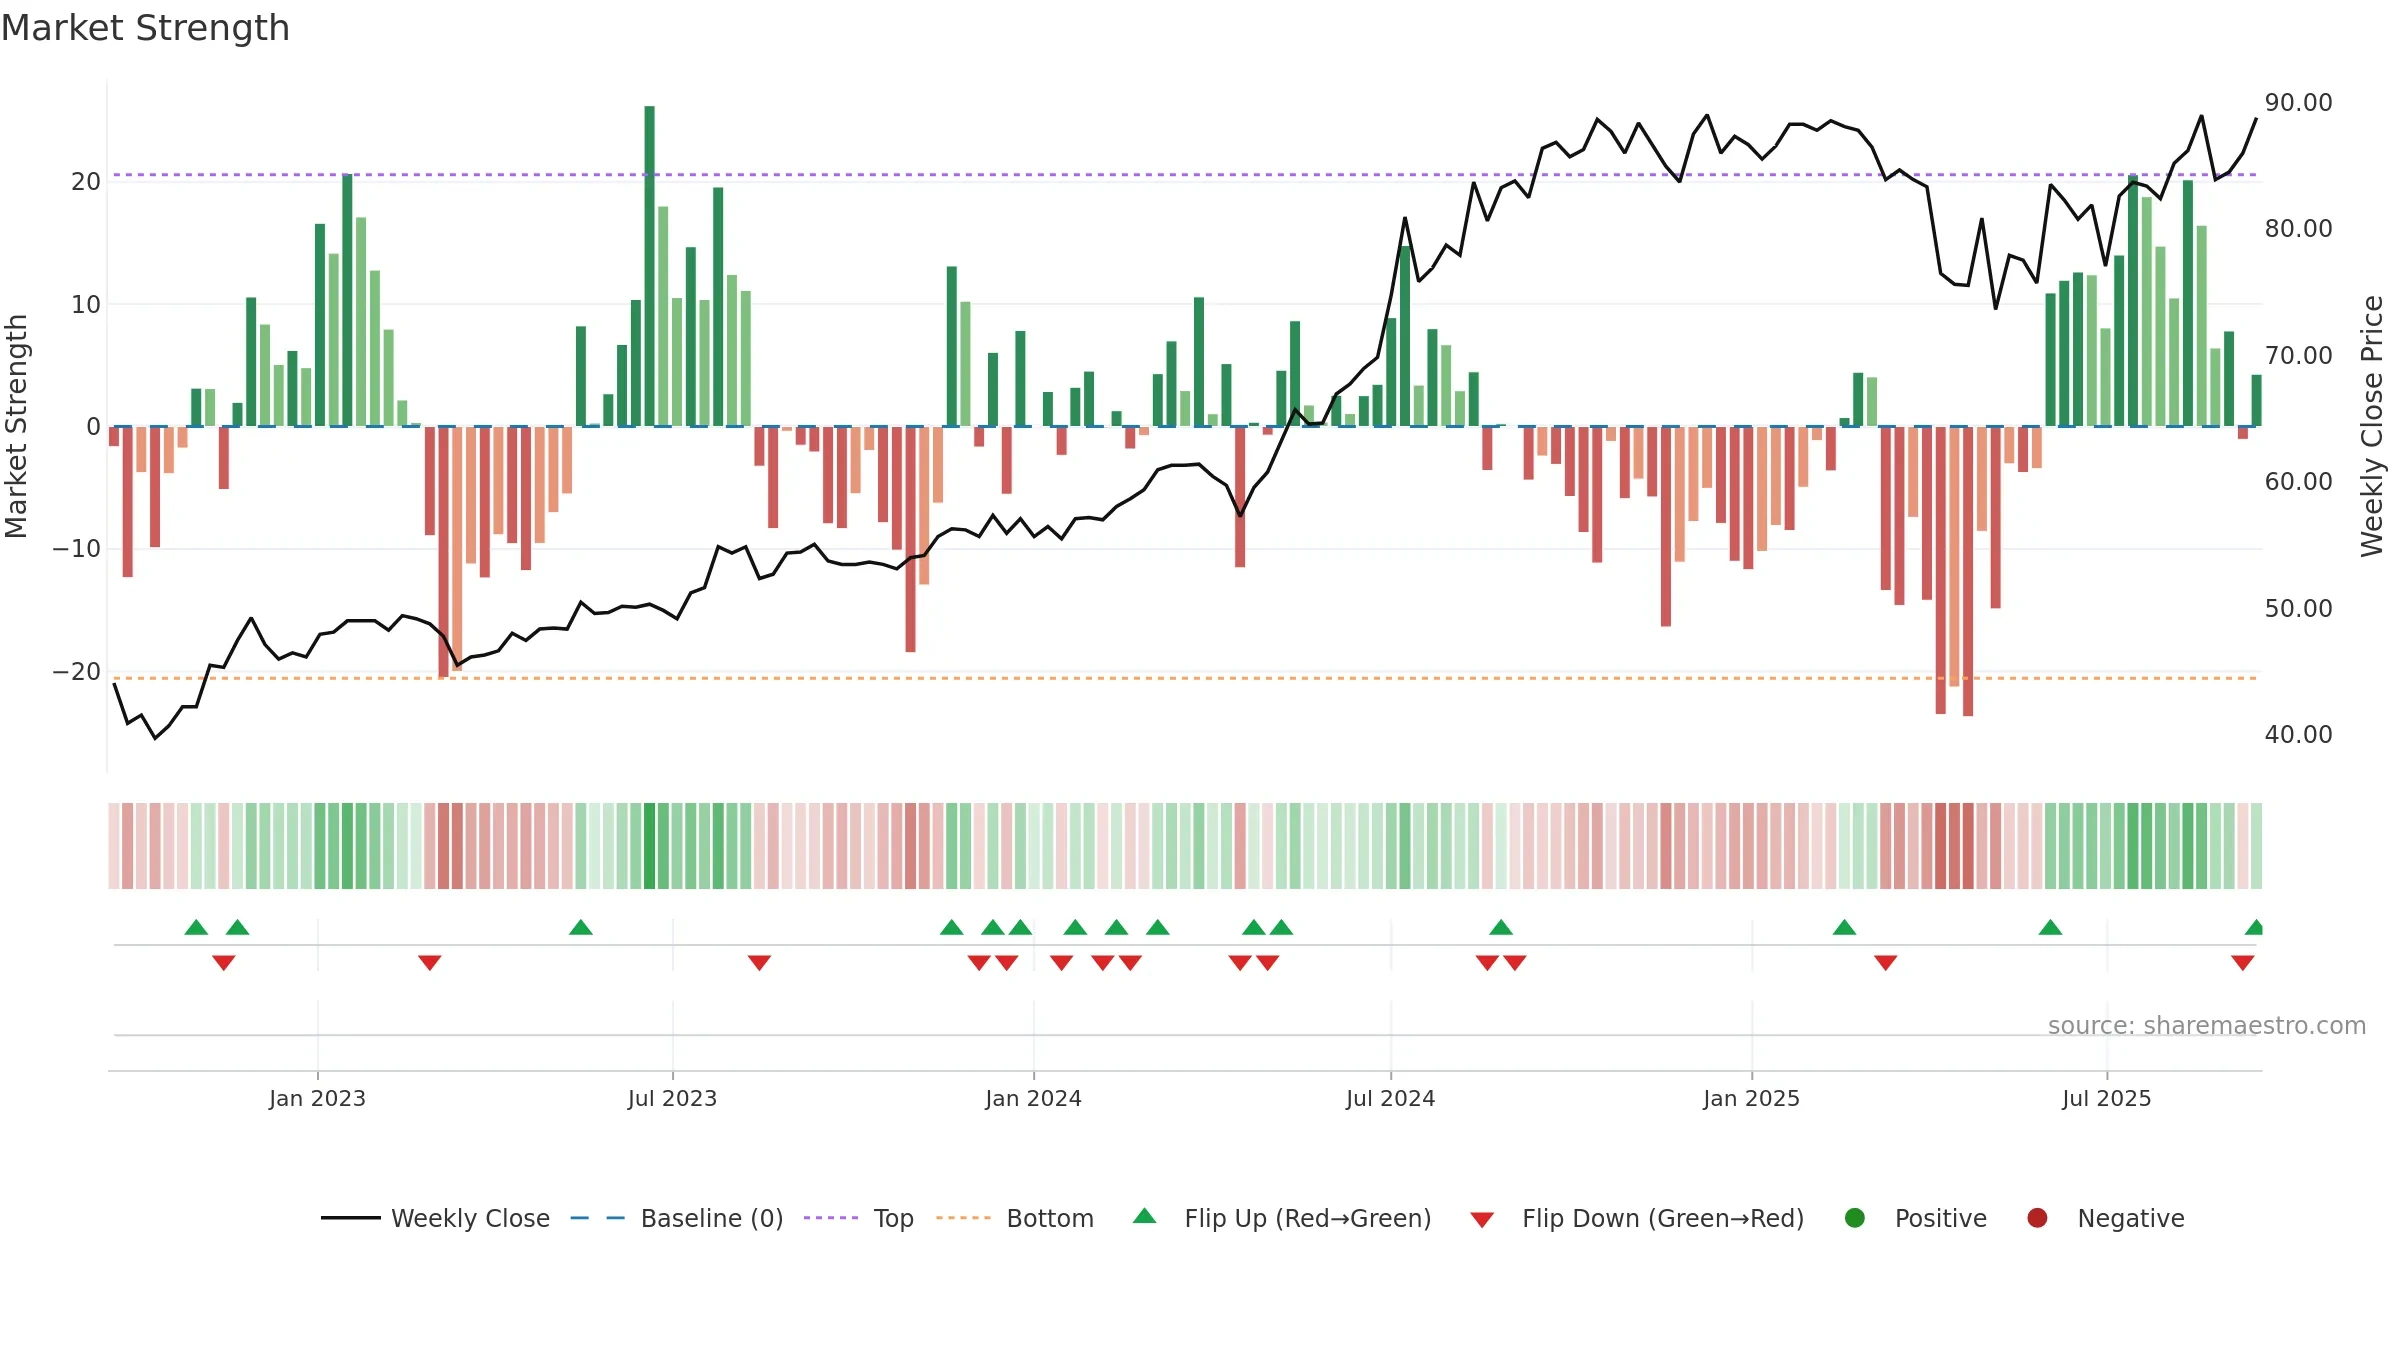
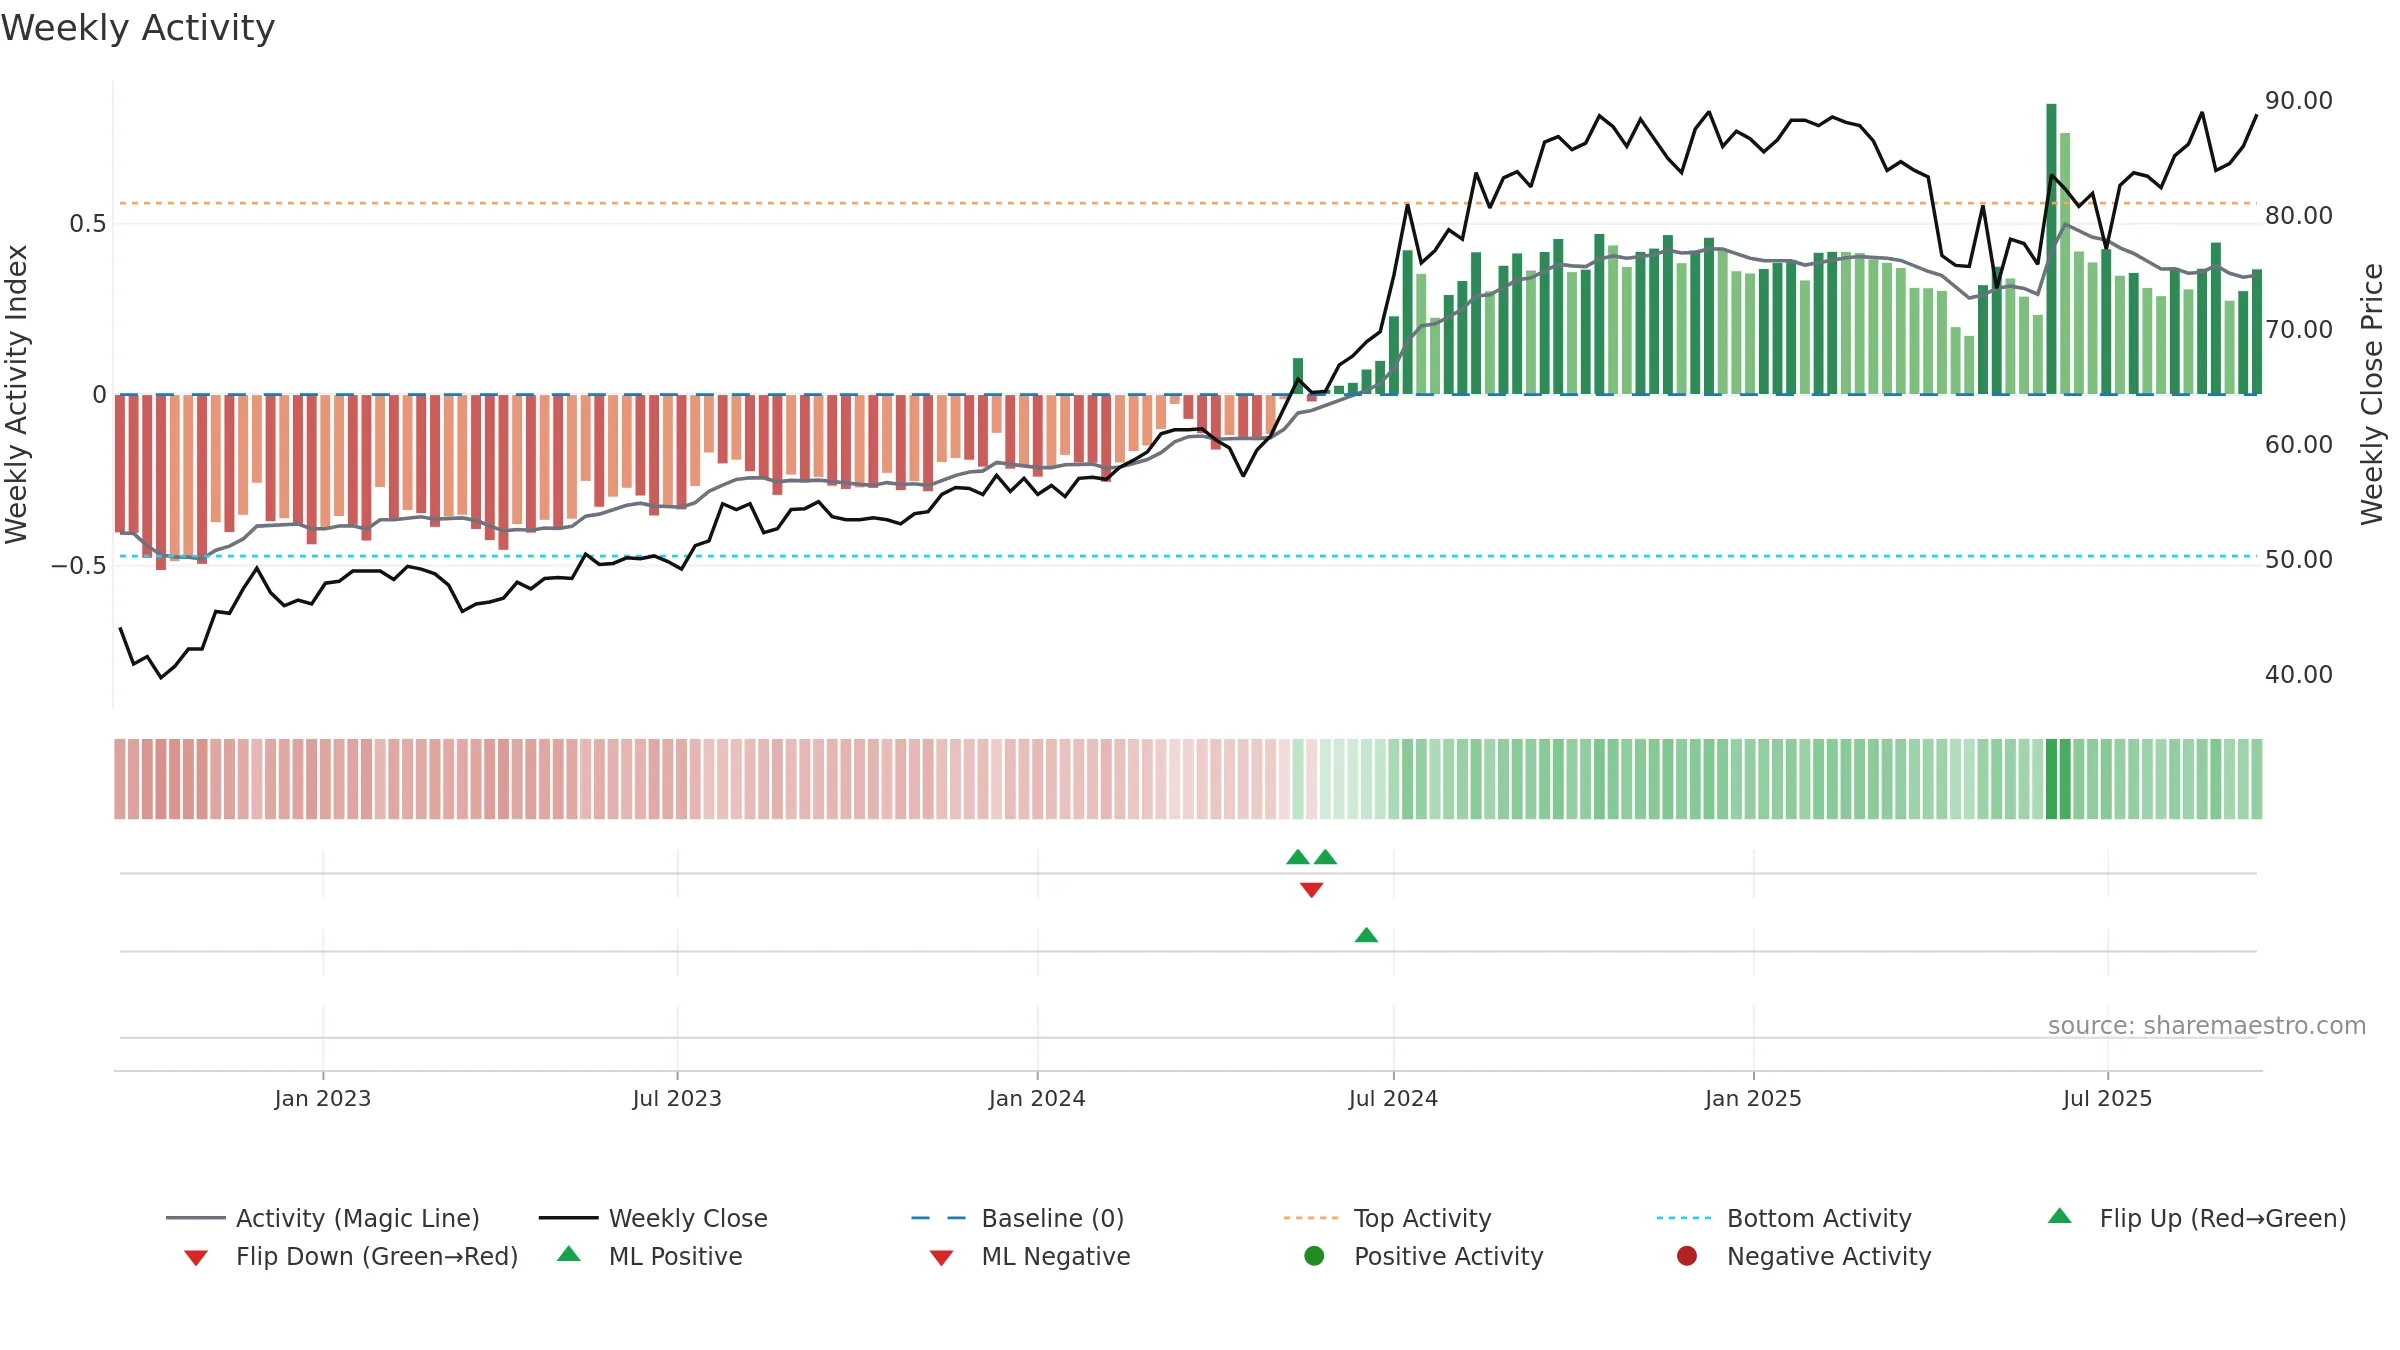
How to read this — Price slope is upward, indicating persistent buying over the window. Volume trend diverges from price — watch for fatigue or rotation. Returns are negatively correlated with volume — strength may come on lighter activity. Distance to baseline is narrowing — reverting closer to its fair-value track. Constructive MA stack supports the up-drift; pullbacks may find support at the 8–13 week region. Price holds above key averages, indicating constructive participation.
Up-slope supports buying interest; pullbacks may be contained if activity stays firm. Because liquidity isn’t confirming, prefer evidence of fresh demand before chasing moves.
Gauge maps the trend signal to a 0–100 scale.
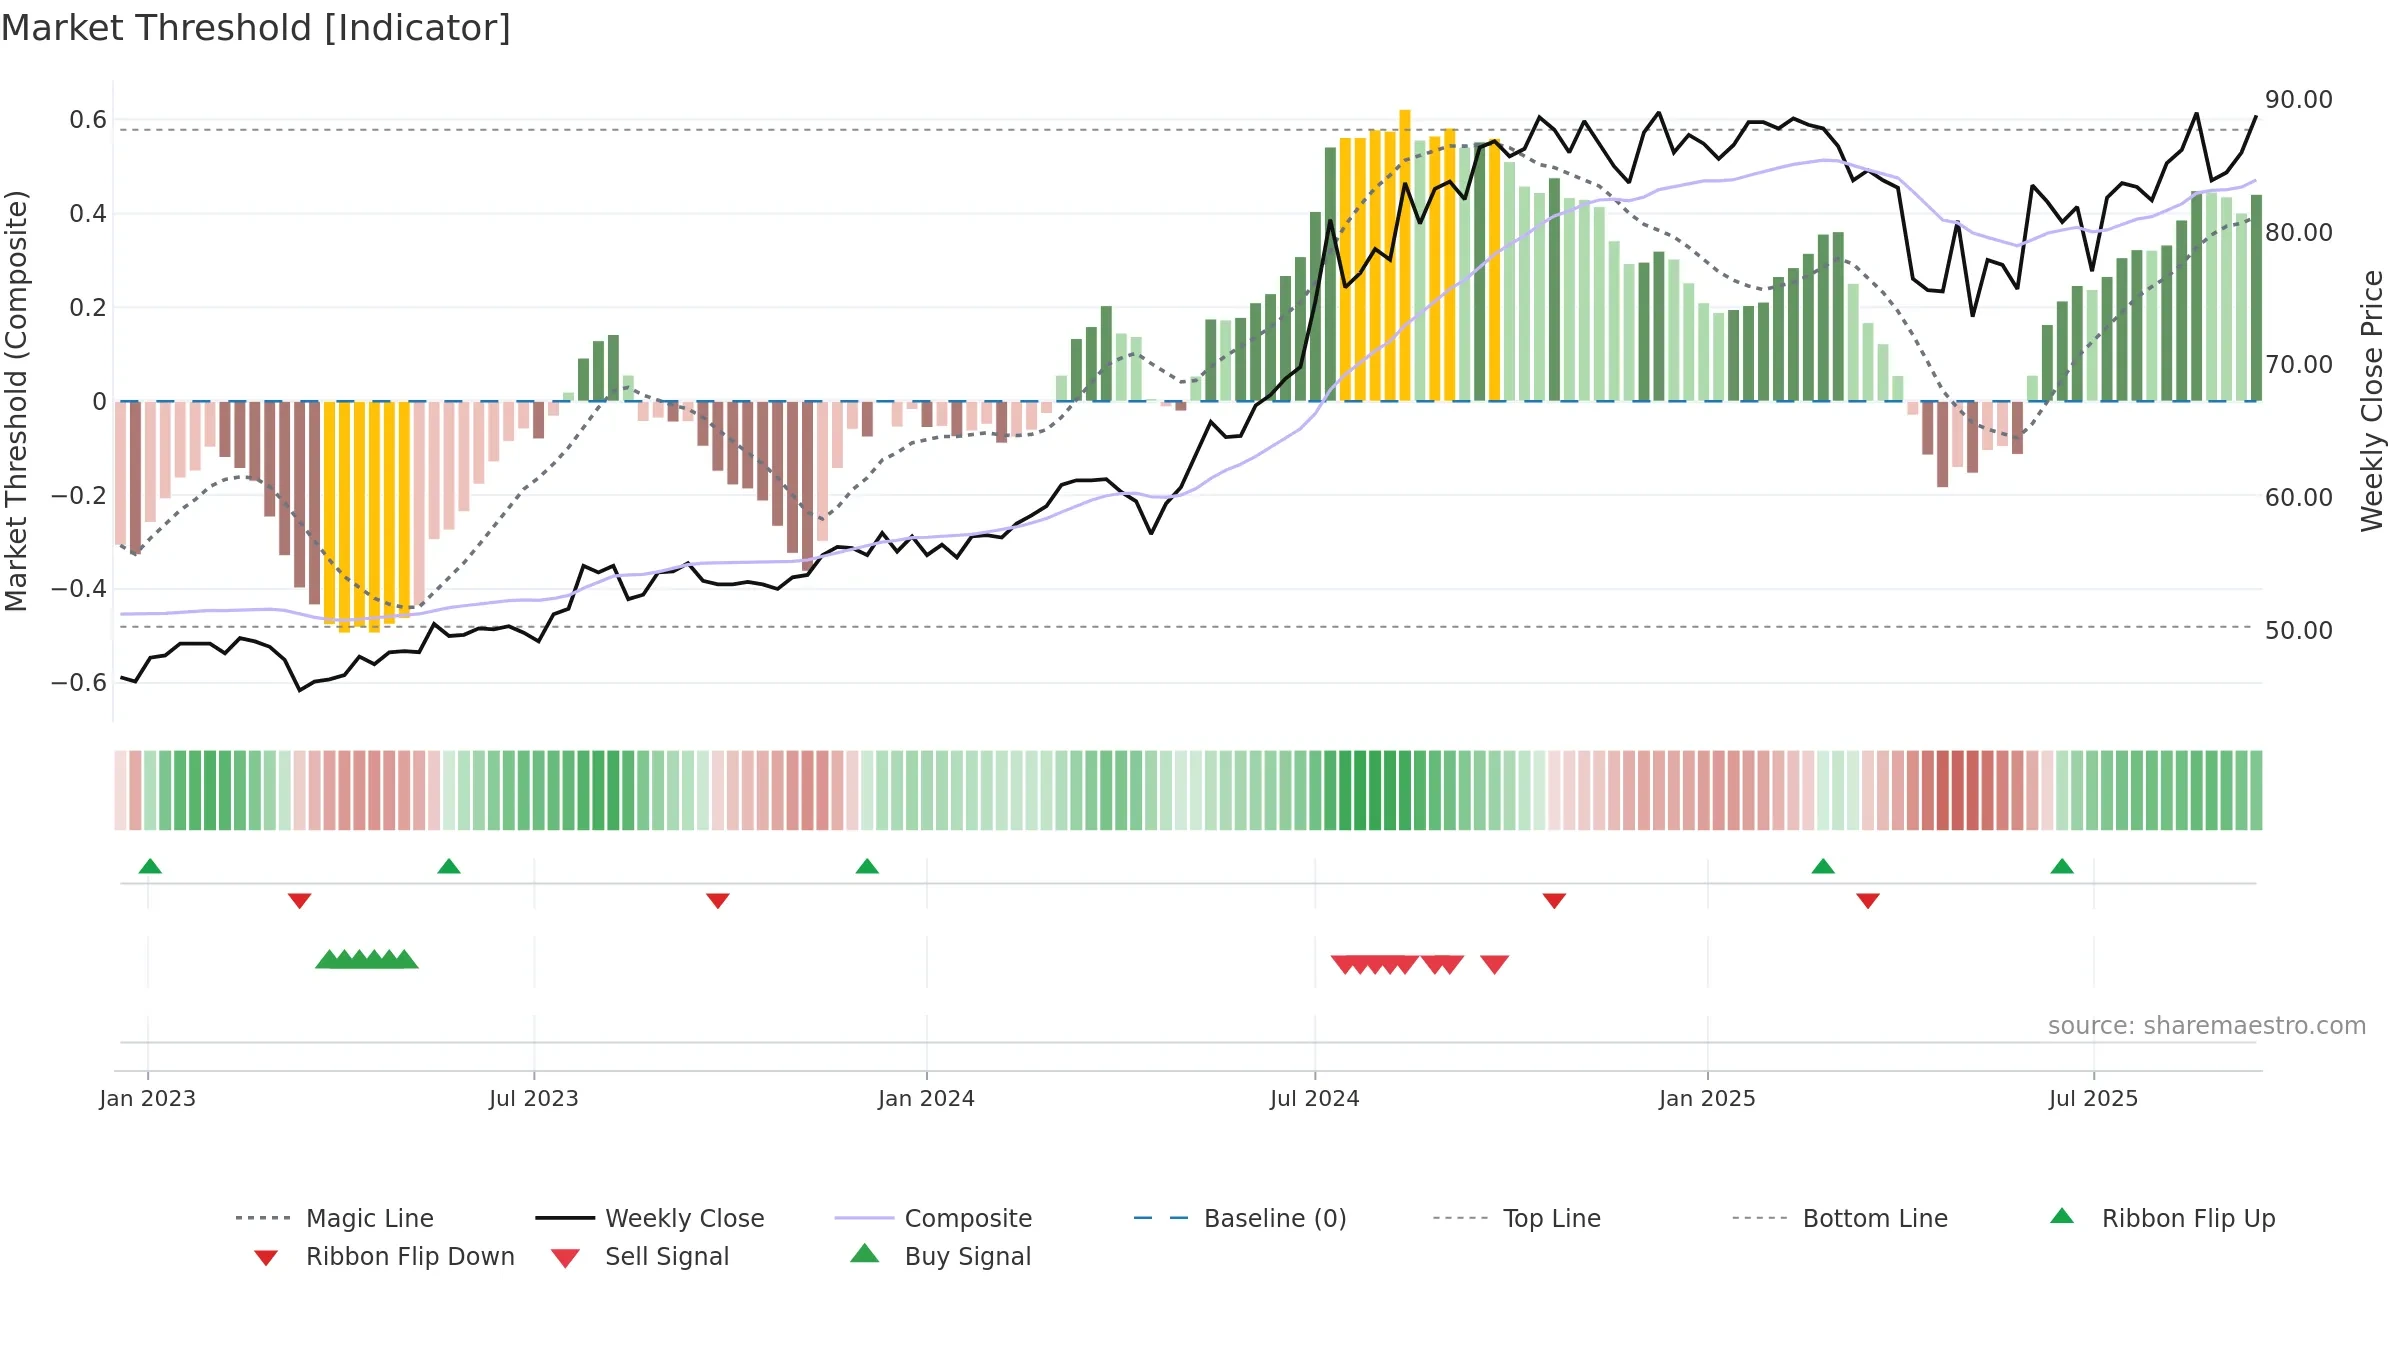
How to read this — Range-bound conditions; conviction is limited until a break or acceleration emerges.
Wait for a directional break or improving acceleration.
Price is above fair value; upside may be capped without catalysts.
Conclusion
Positive setup. ★★★★☆ confidence. Price window: 7. Trend: Range / Neutral; gauge 62. In combination, liquidity diverges from price.
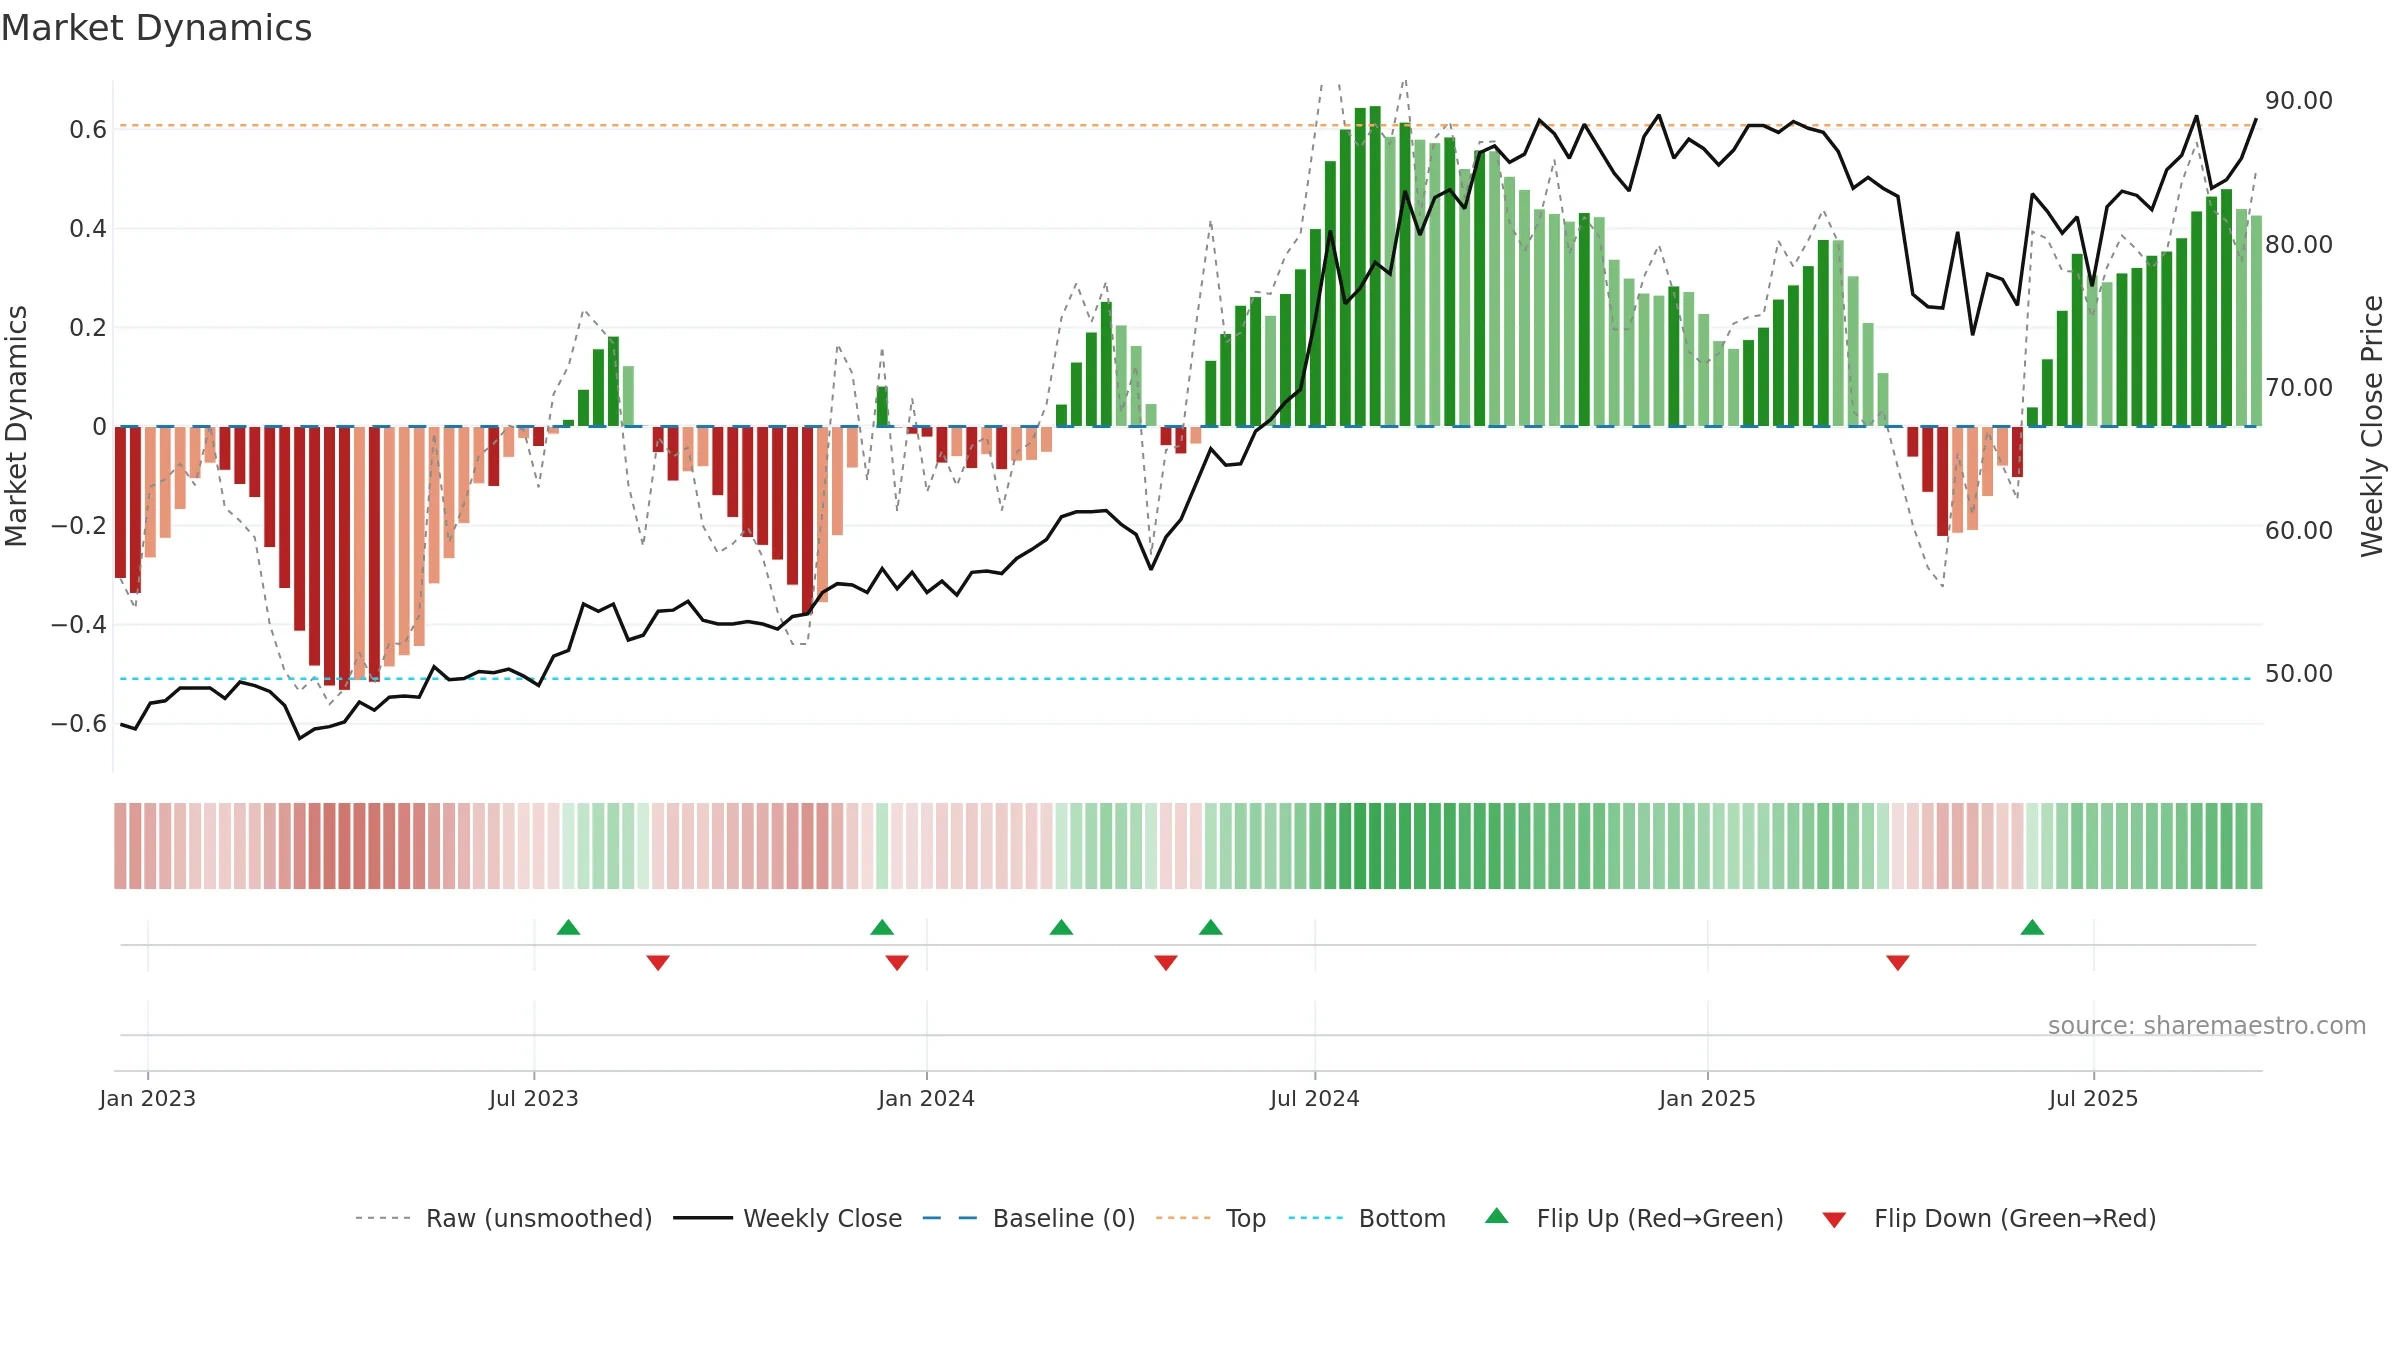
- Momentum is bullish and rising
- Price holds above 8w & 26w averages
- Constructive moving-average stack
- Liquidity diverges from price
Why: Price window 7.77% over 8w. Return volatility 2.48%. Volume trend falling. Liquidity divergence with price. Trend state range / neutral. MA stack constructive. Momentum bullish and rising. Valuation limited upside without catalysts.
Tip: Most metrics include a hover tooltip where they appear in the report.