CRISPR Therapeutics AG
CRSP NASDAQ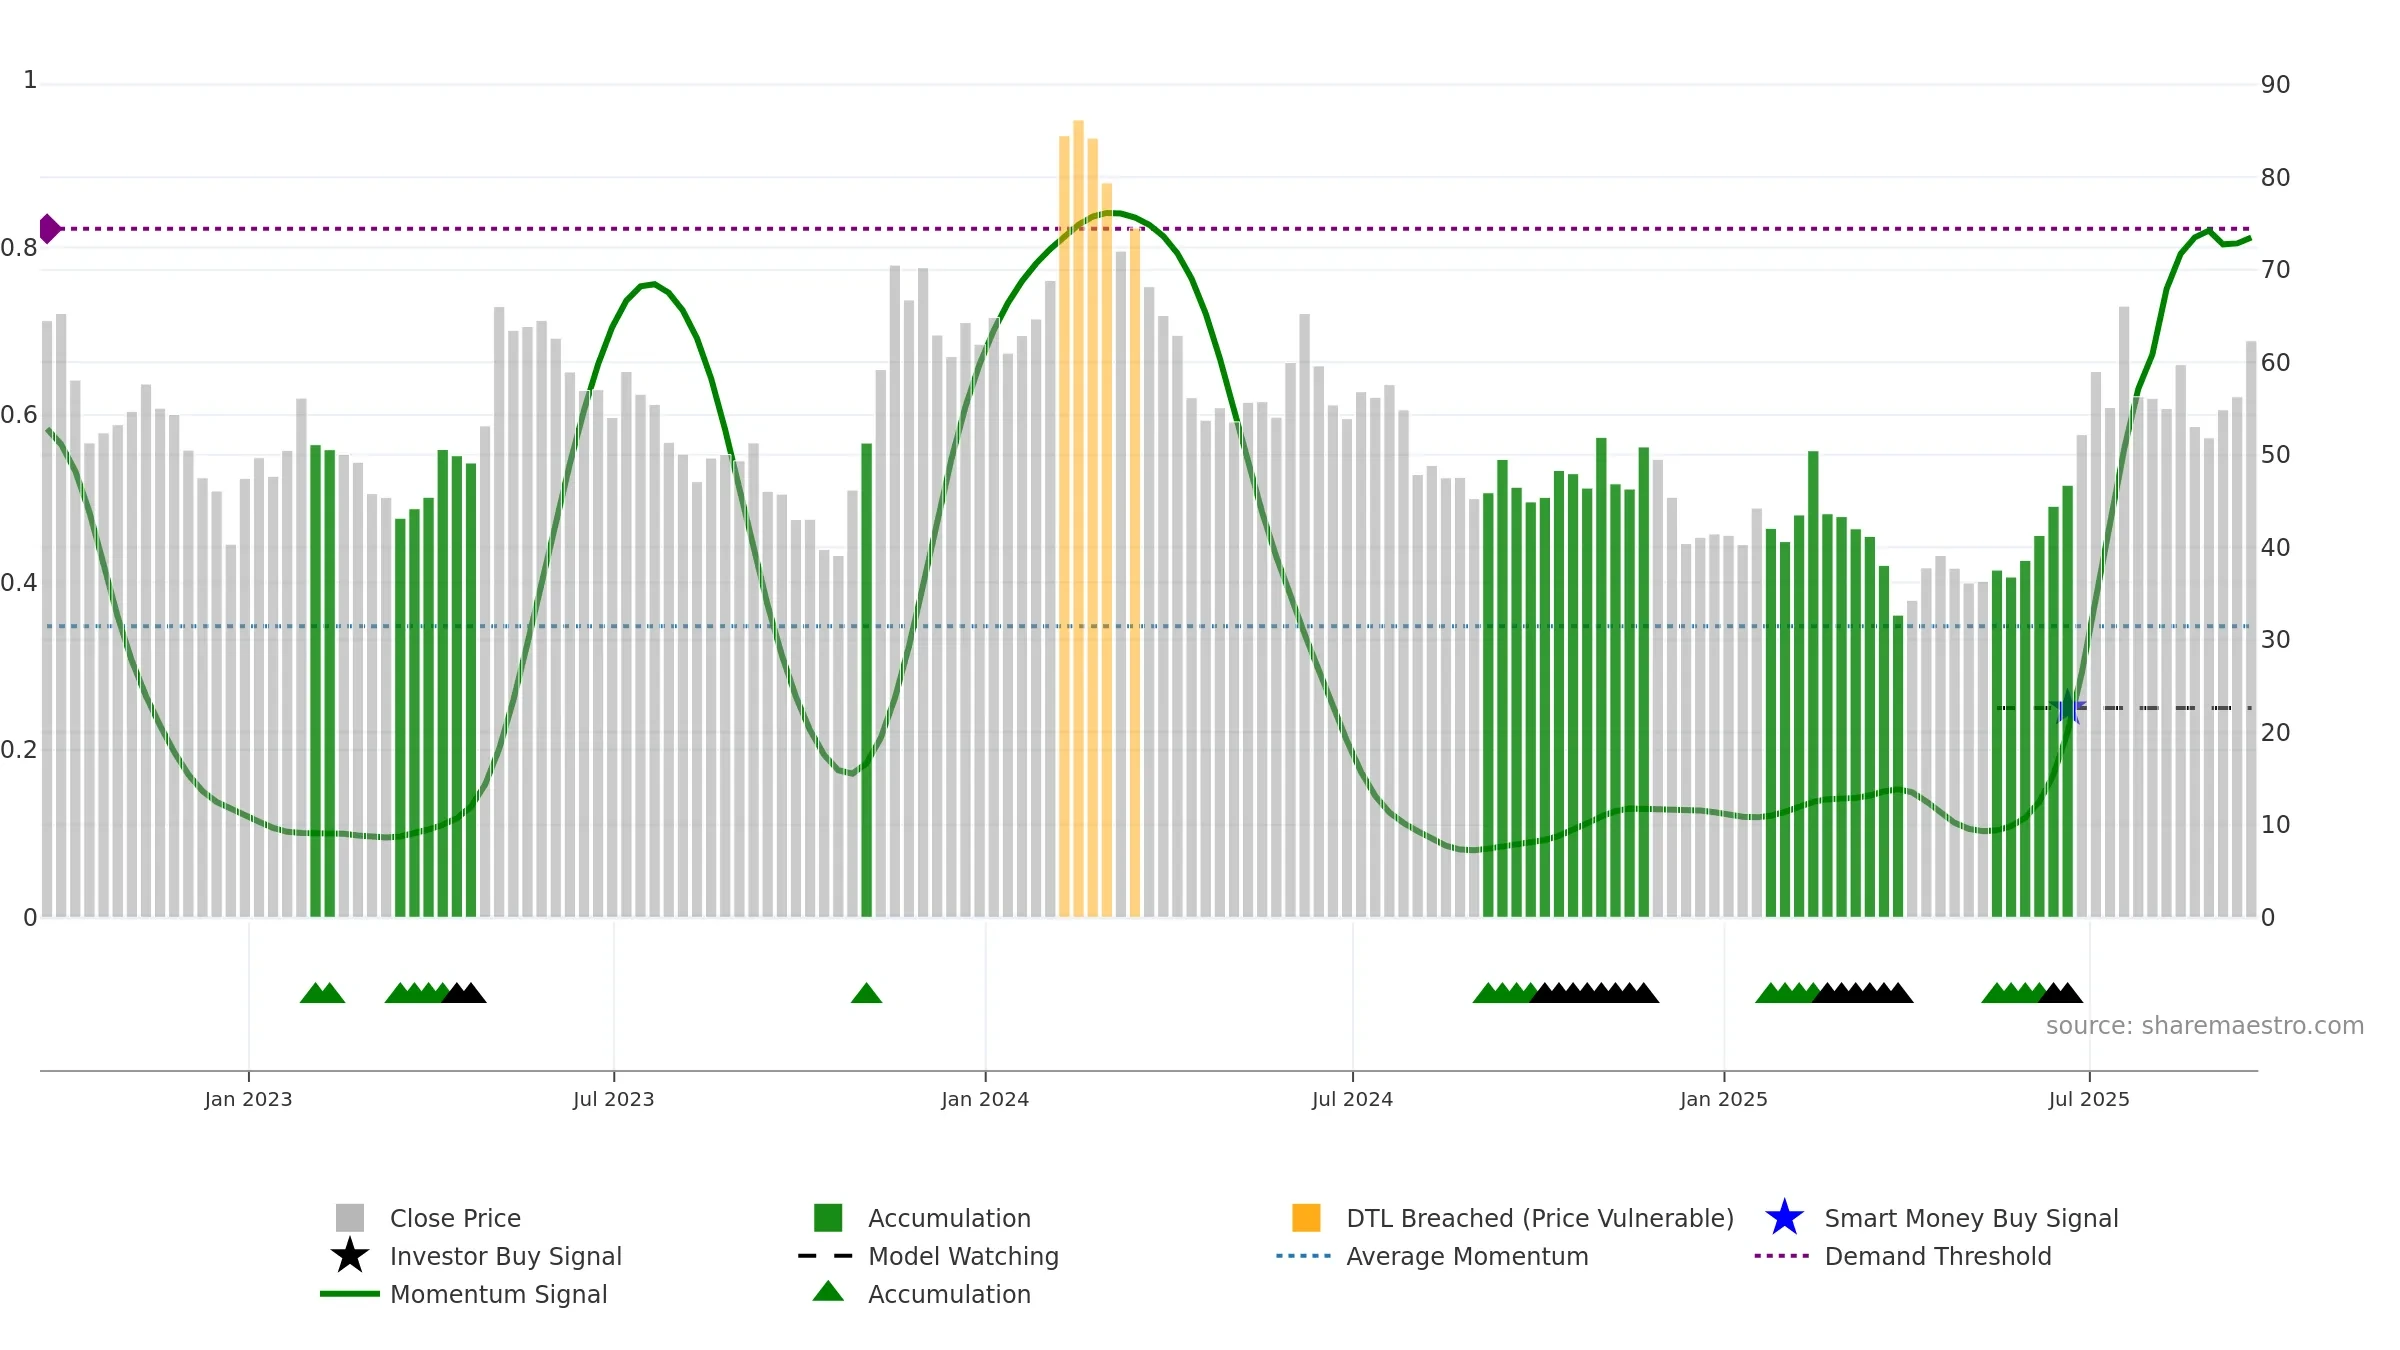
Weekly Summary
CRISPR Therapeutics AG closed at 62.3200 (-1.36% WoW) . Data window ends Fri, 19 Sep 2025.
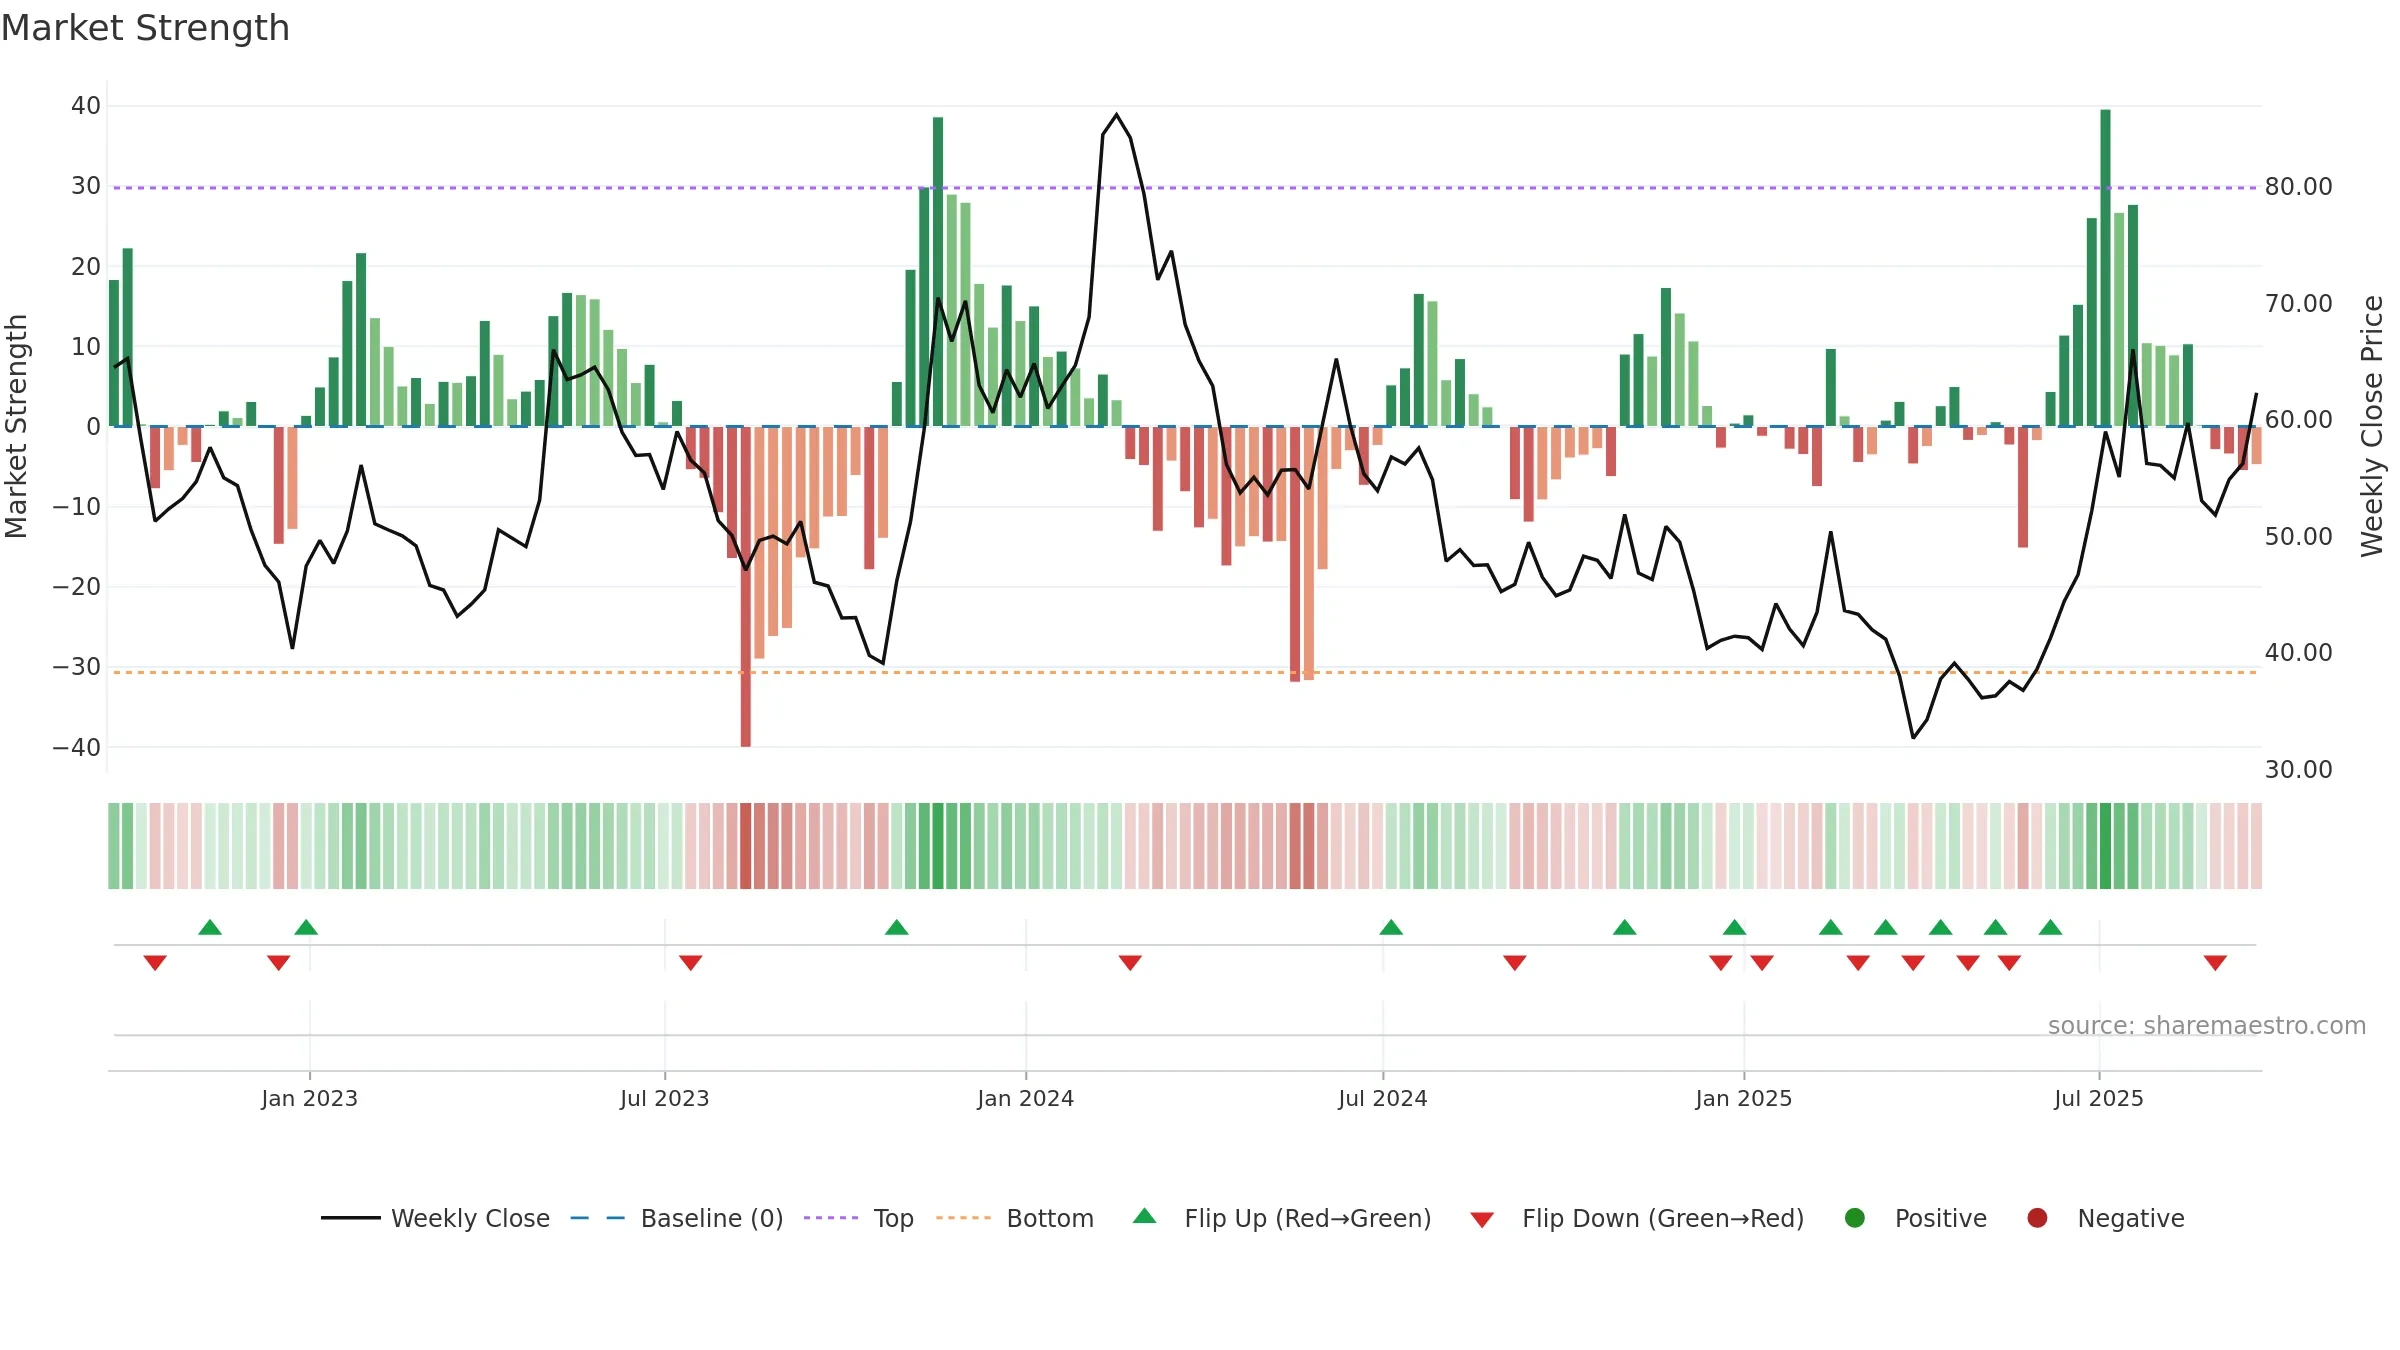
How to read this — Price slope is upward, indicating persistent buying over the window. Volume and price are moving in the same direction — a constructive confirmation. Price is stretched above its baseline; consolidation risk rises if activity fades. Fresh short-term crossover improves near-term tone. Price holds above key averages, indicating constructive participation.
Up-slope supports buying interest; pullbacks may be contained if activity stays firm.
Gauge maps the trend signal to a 0–100 scale.
How to read this — Gauge is elevated but momentum is rolling over; topping risk is rising.
Stay alert: protect gains or seek confirmation before adding risk.

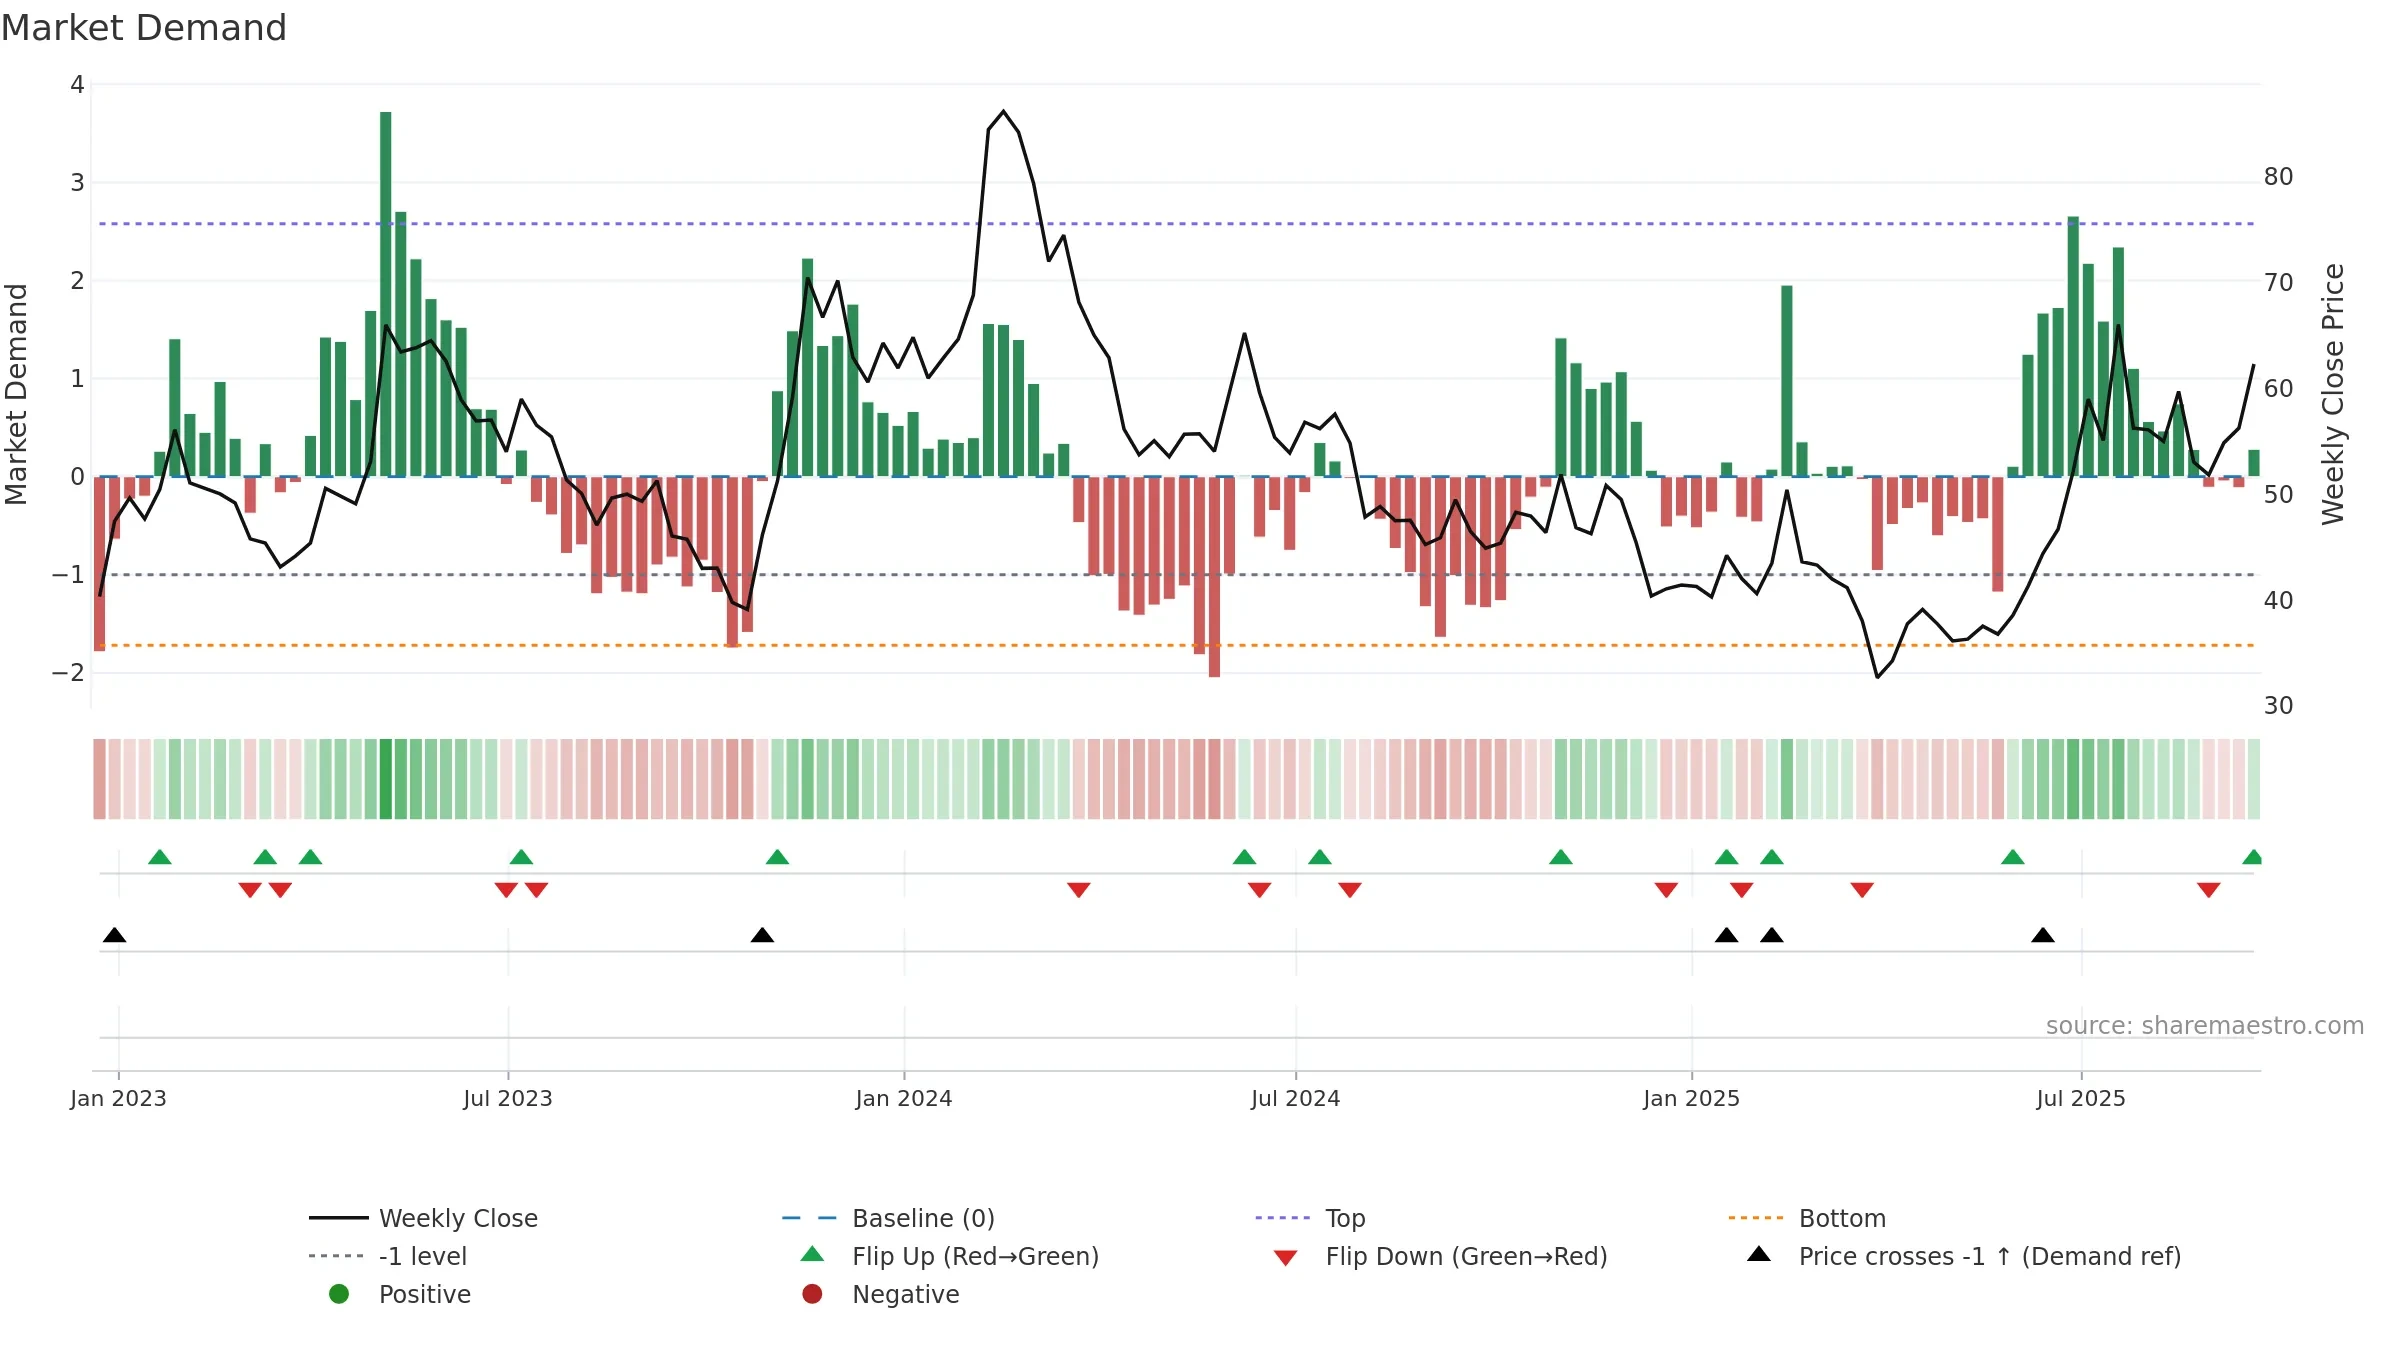
Relative strength is Positive
(> 0%, outperforming).
Latest MRS: 15.31% (week ending Fri, 19 Sep 2025).
Slope: Falling over 8w.
Notes:
- Holding above the zero line indicates relative bid.
- MRS slope falling over ~8 weeks.
Conclusion
Positive setup. ★★★★⯪ confidence. Trend: Uptrend at Risk · 11.11% over window · vol 2.27% · liquidity convergence · posture above · RS outperforming
- Momentum is bullish and rising
- Price holds above 8–26 week averages
- Liquidity confirms the price trend
- Solid multi-week performance
- High level but momentum rolling over (topping risk)
Why: Price window 11.11% over w. Close is 4.34% above the prior-window high. Return volatility 2.27%. Volume trend rising. Liquidity convergence with price. Trend state uptrend at risk. 4–8w crossover bullish. Momentum bullish and rising.
Tip: Most metrics include a hover tooltip where they appear in the report.