Haidilao International Holding Ltd.
6862 HKG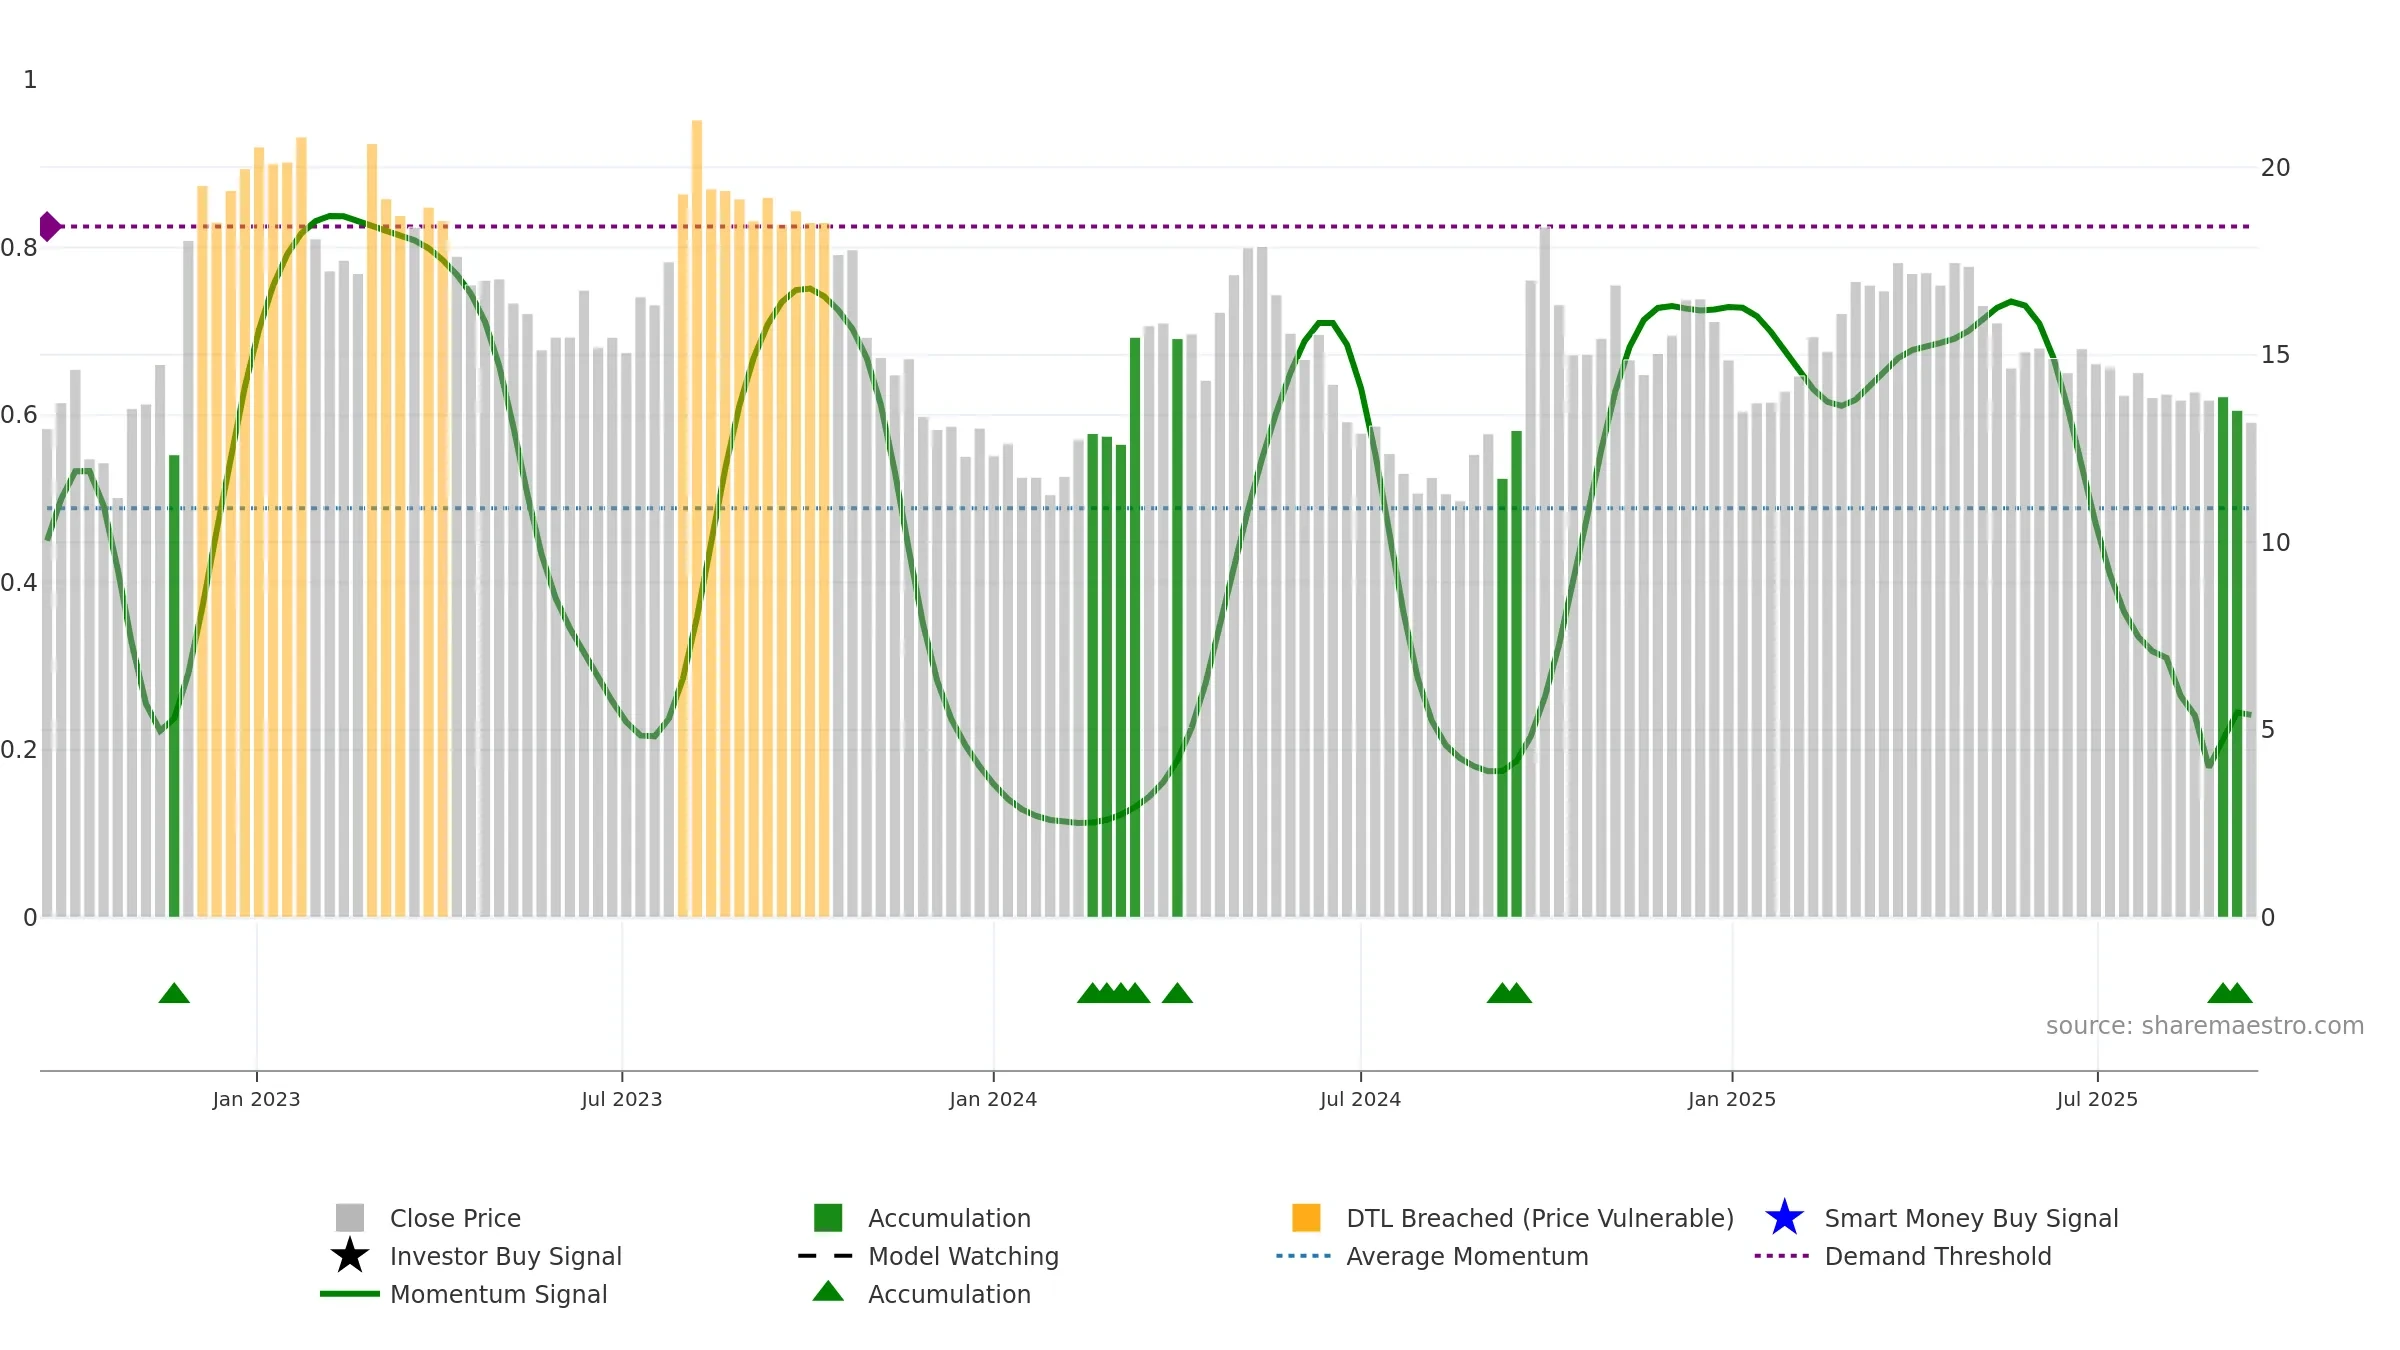
Weekly Report
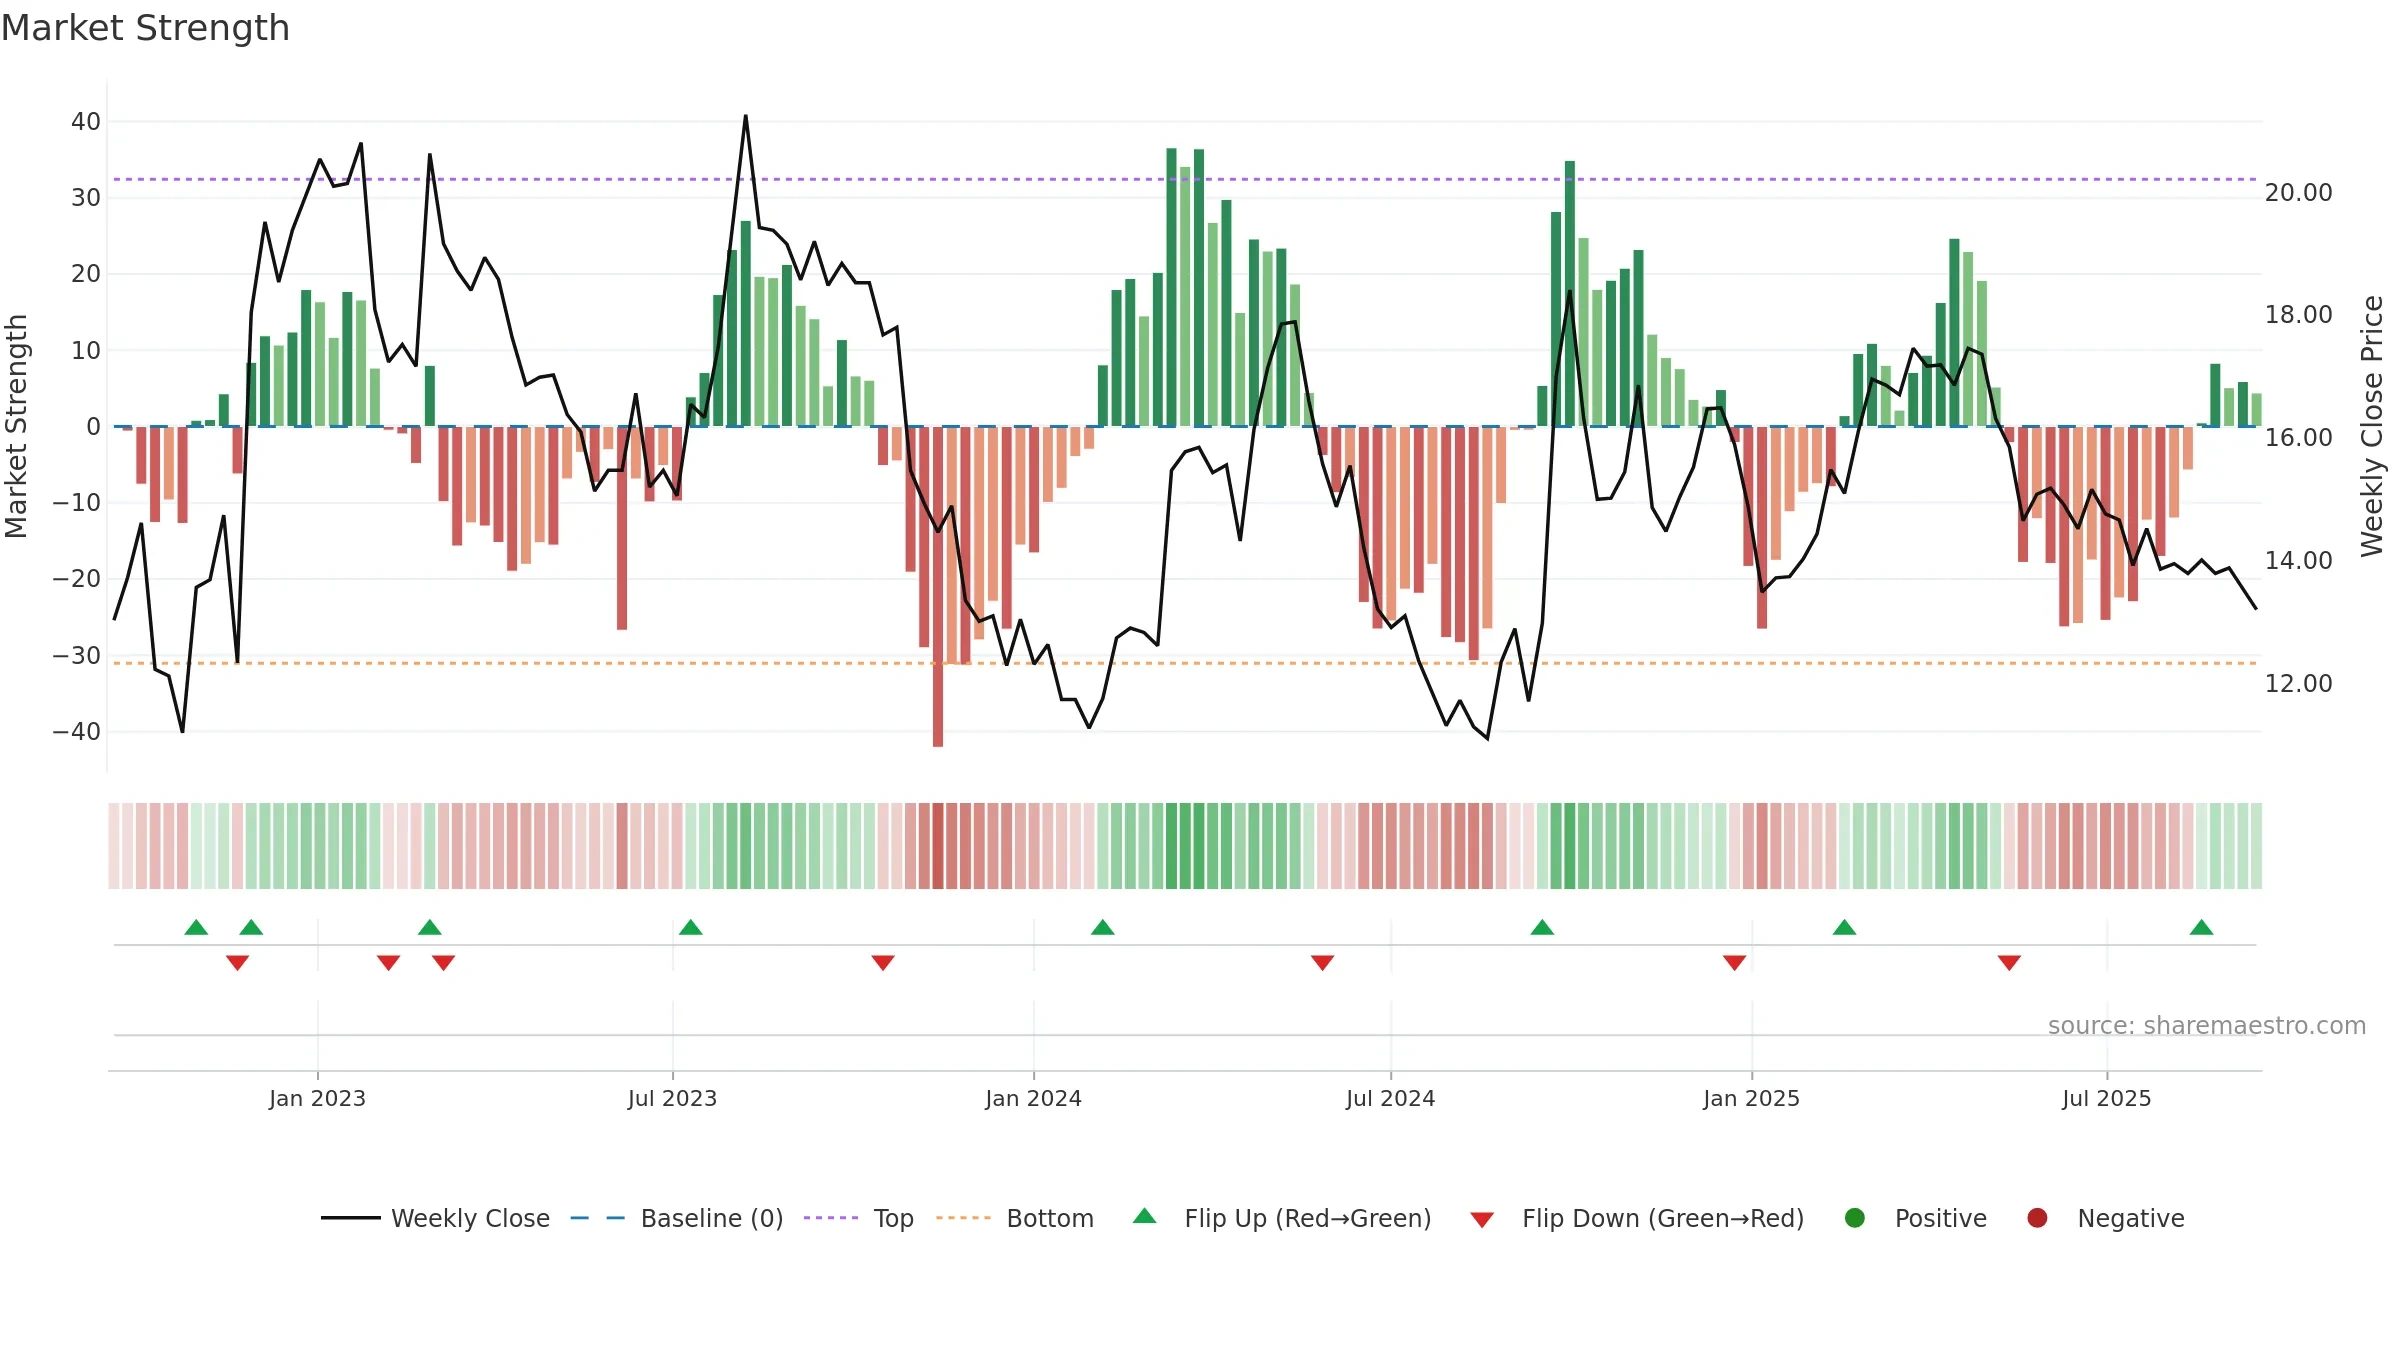
Haidilao International Holding Ltd. closed at 13.2000 (-1.64% WoW) . Data window ends Mon, 15 Sep 2025.
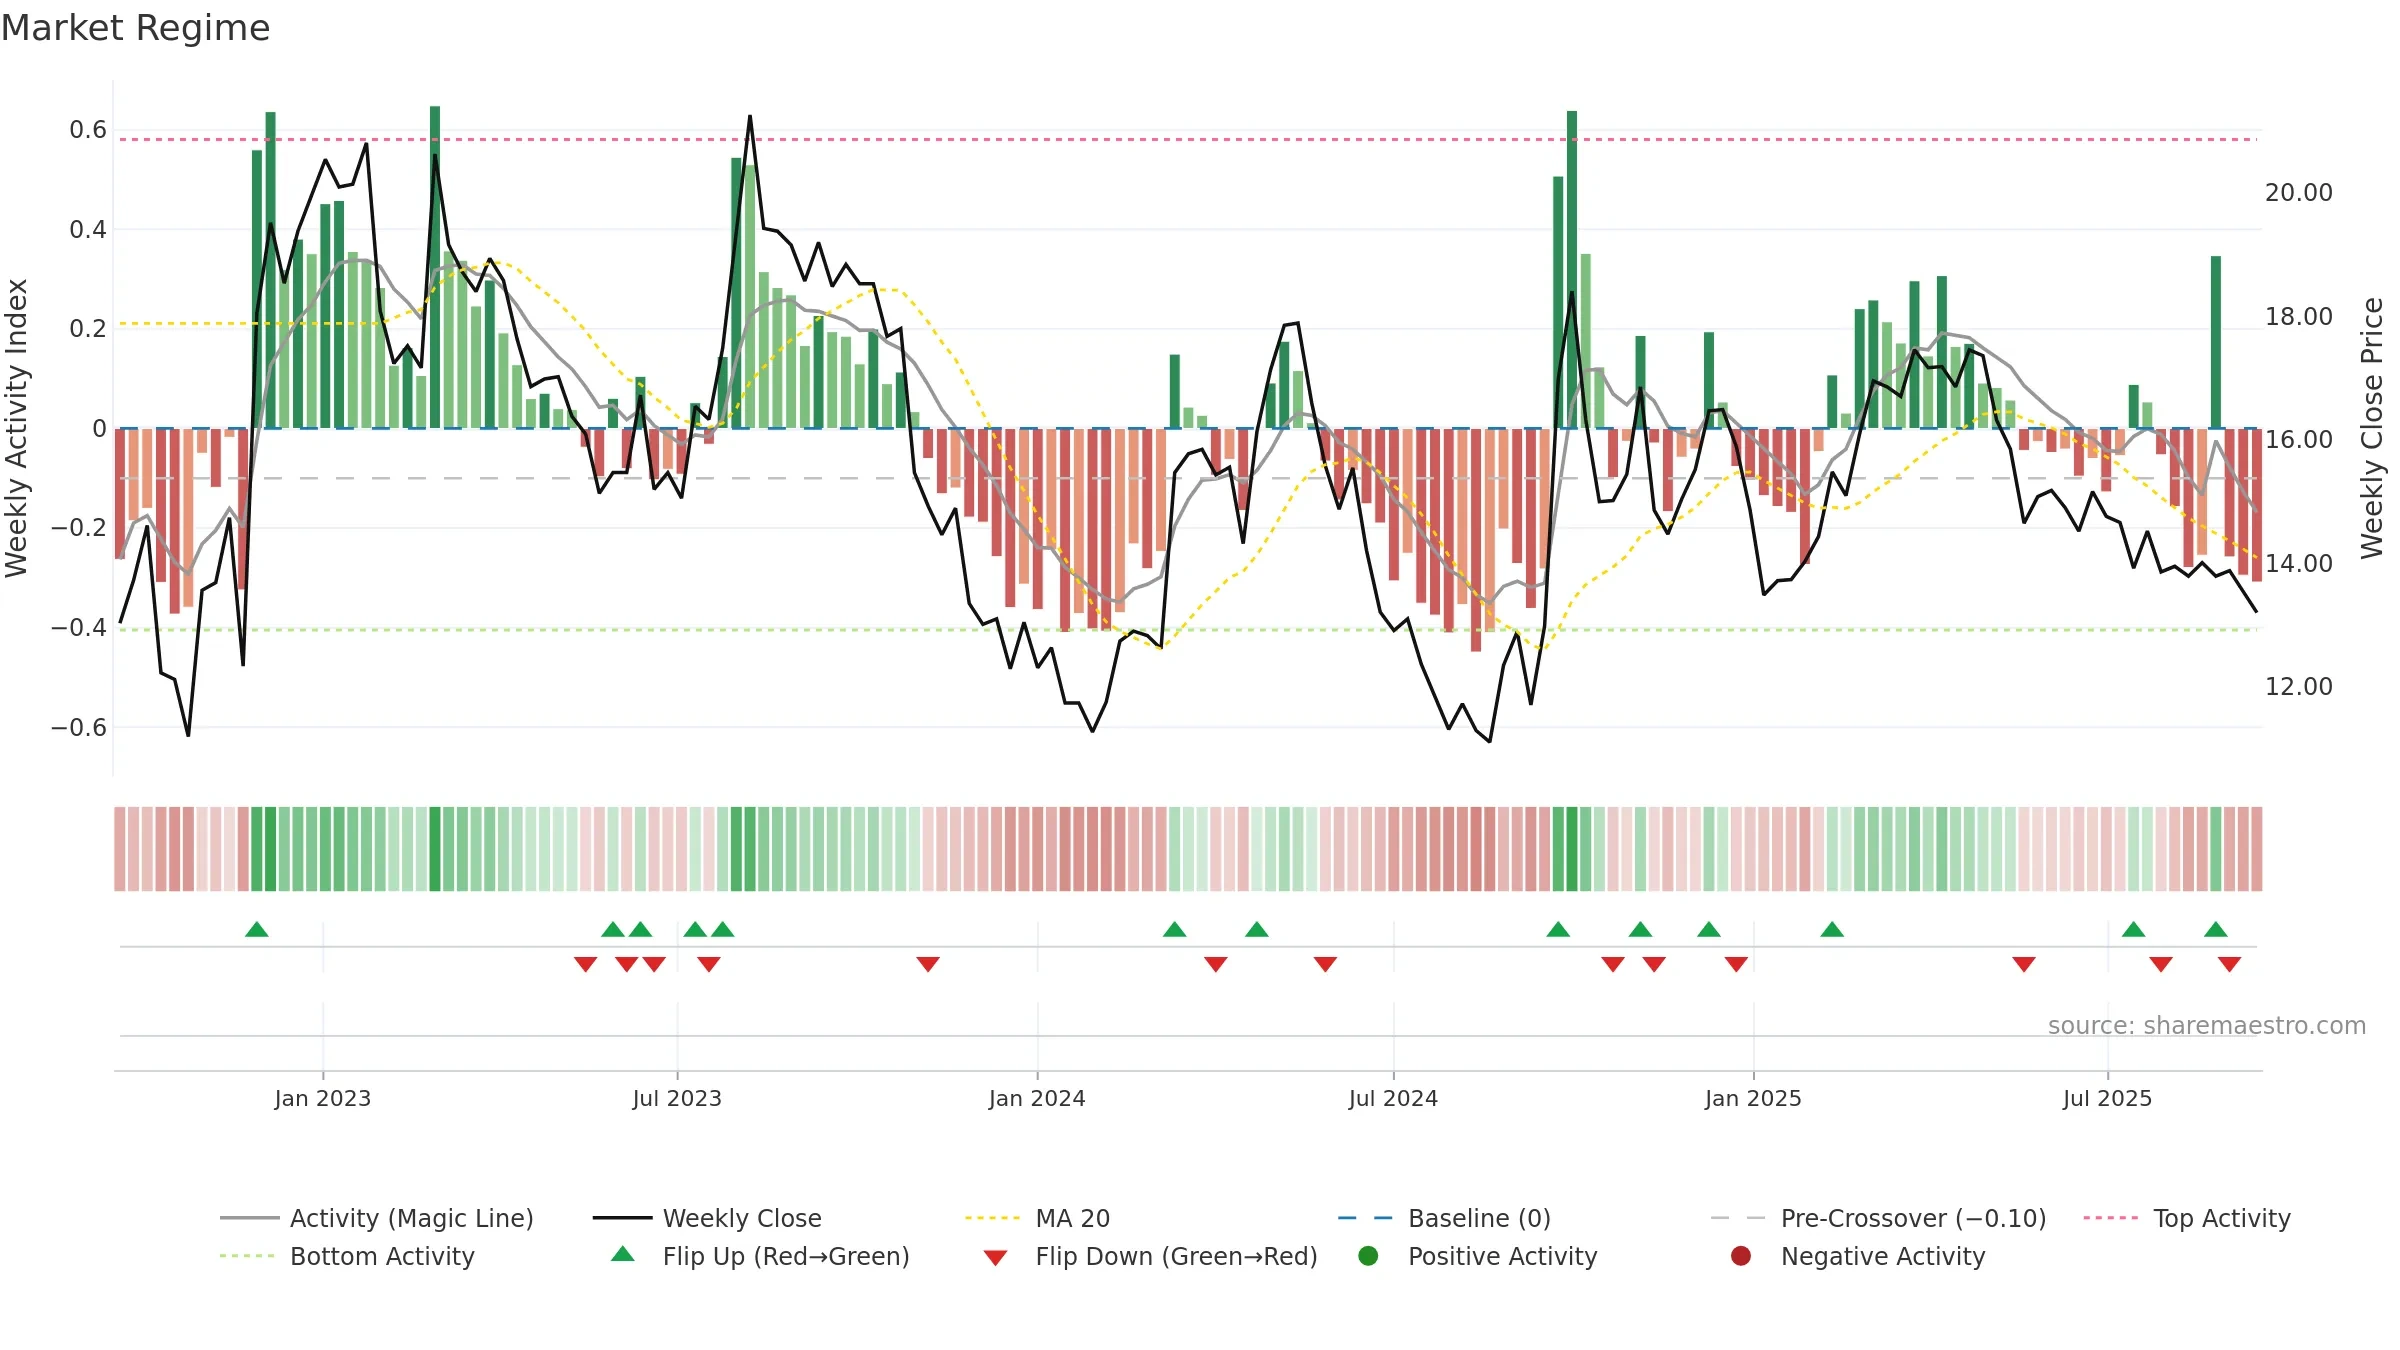
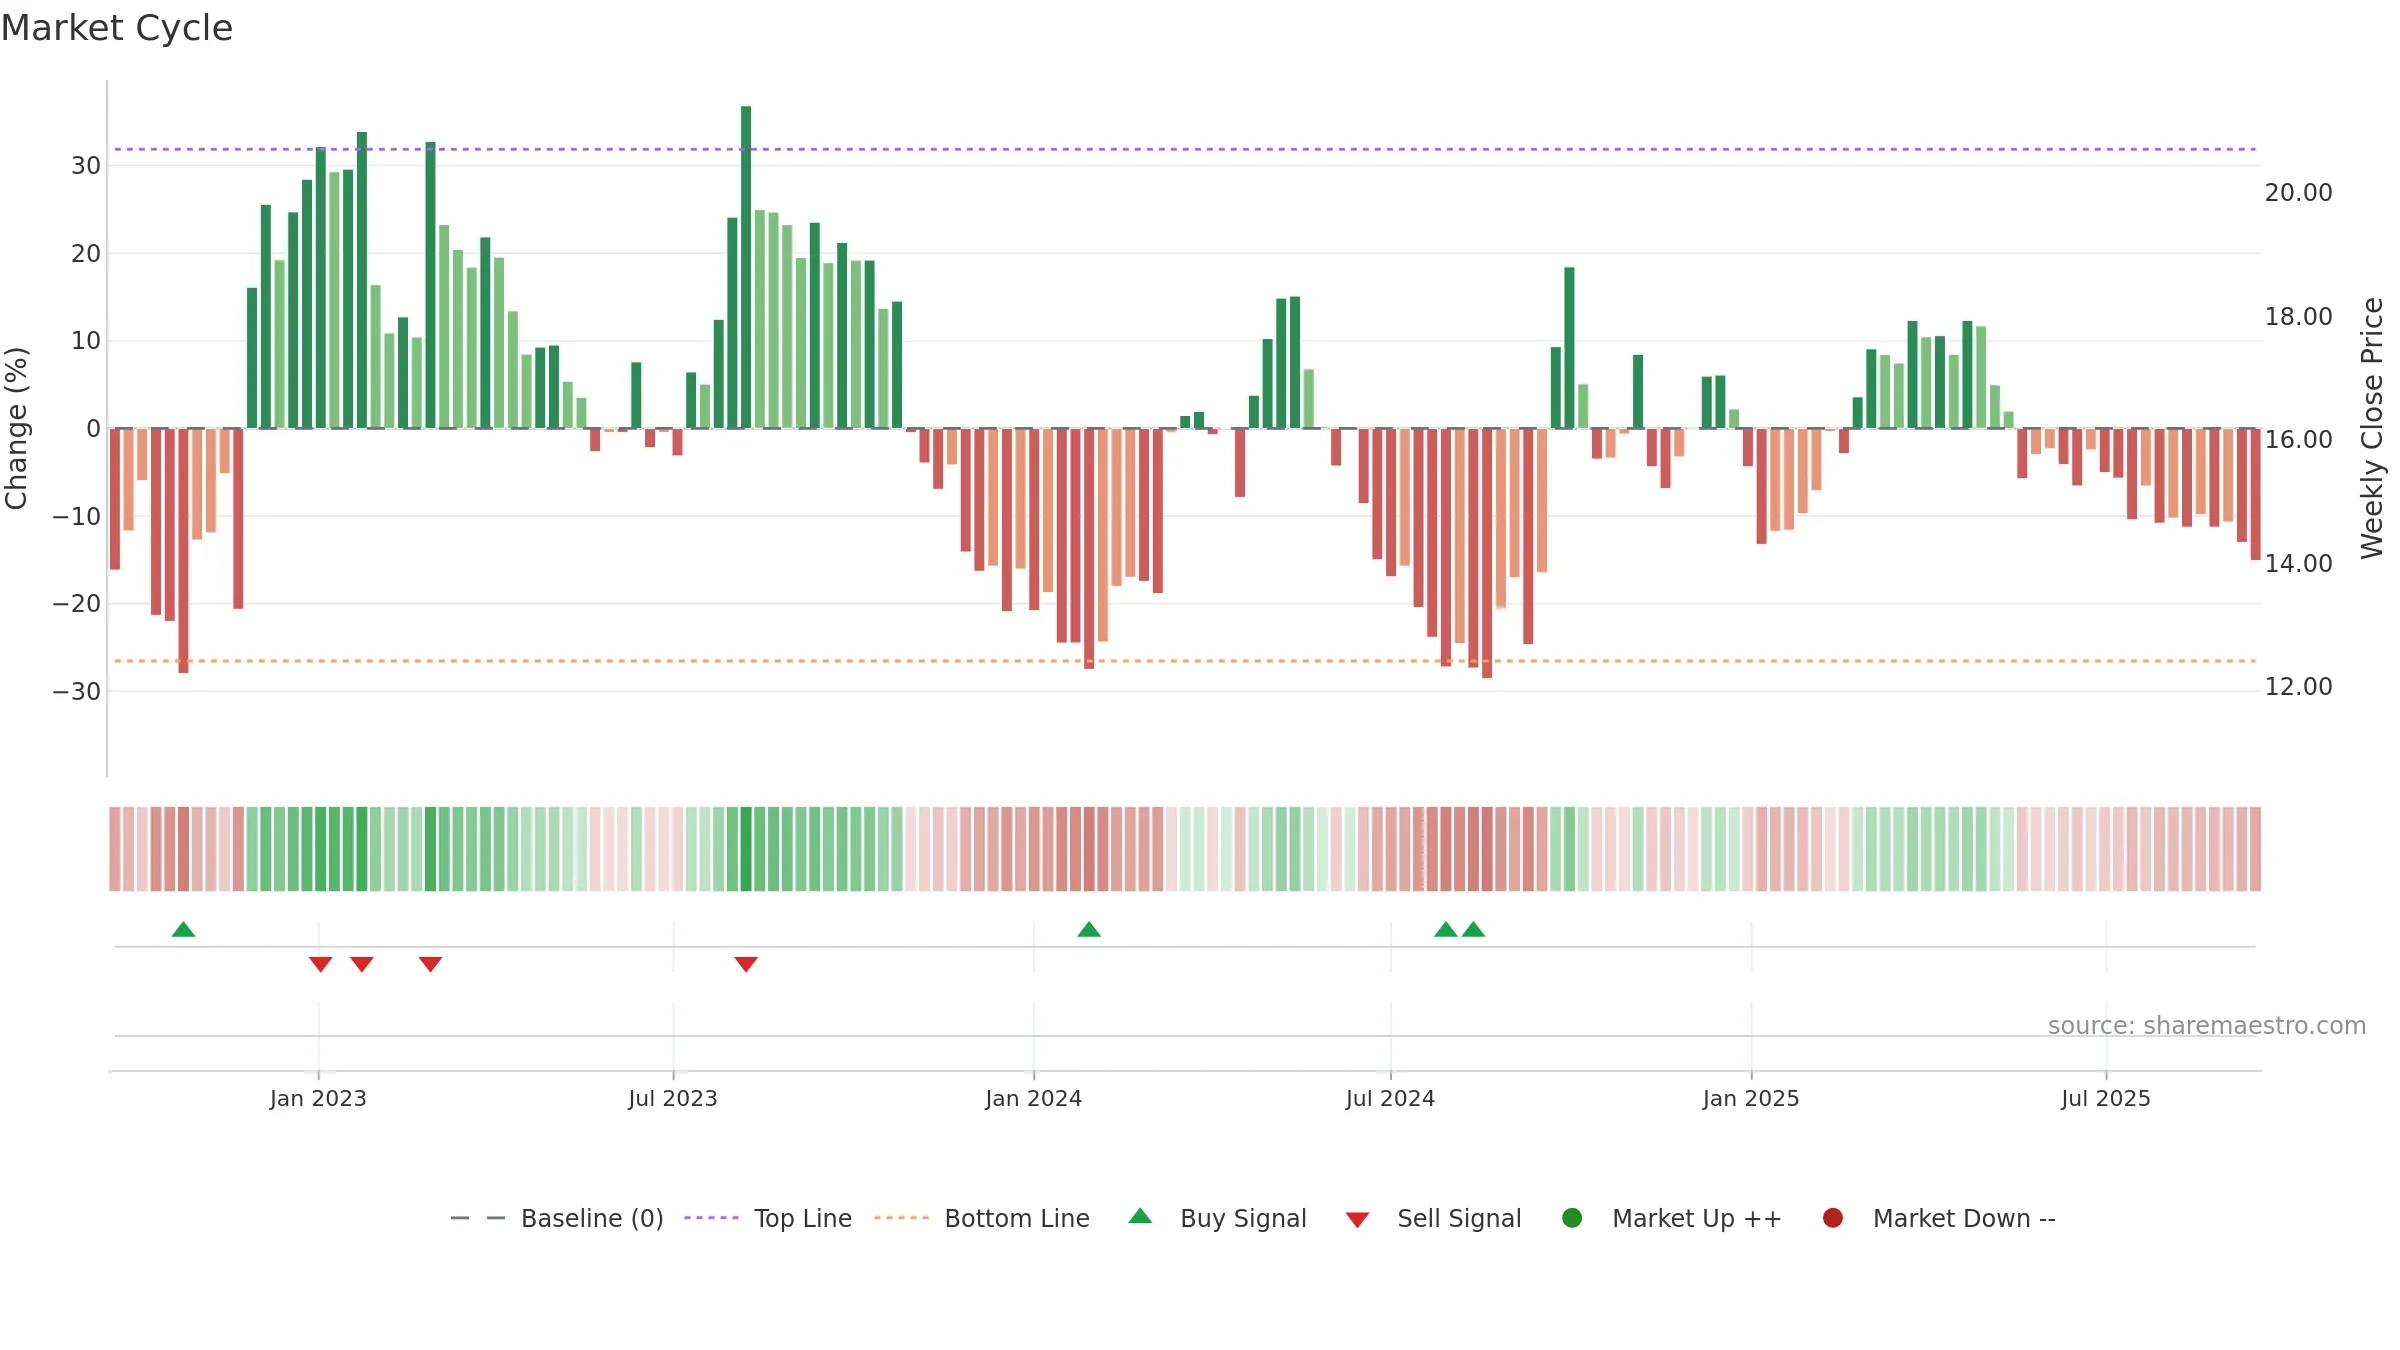
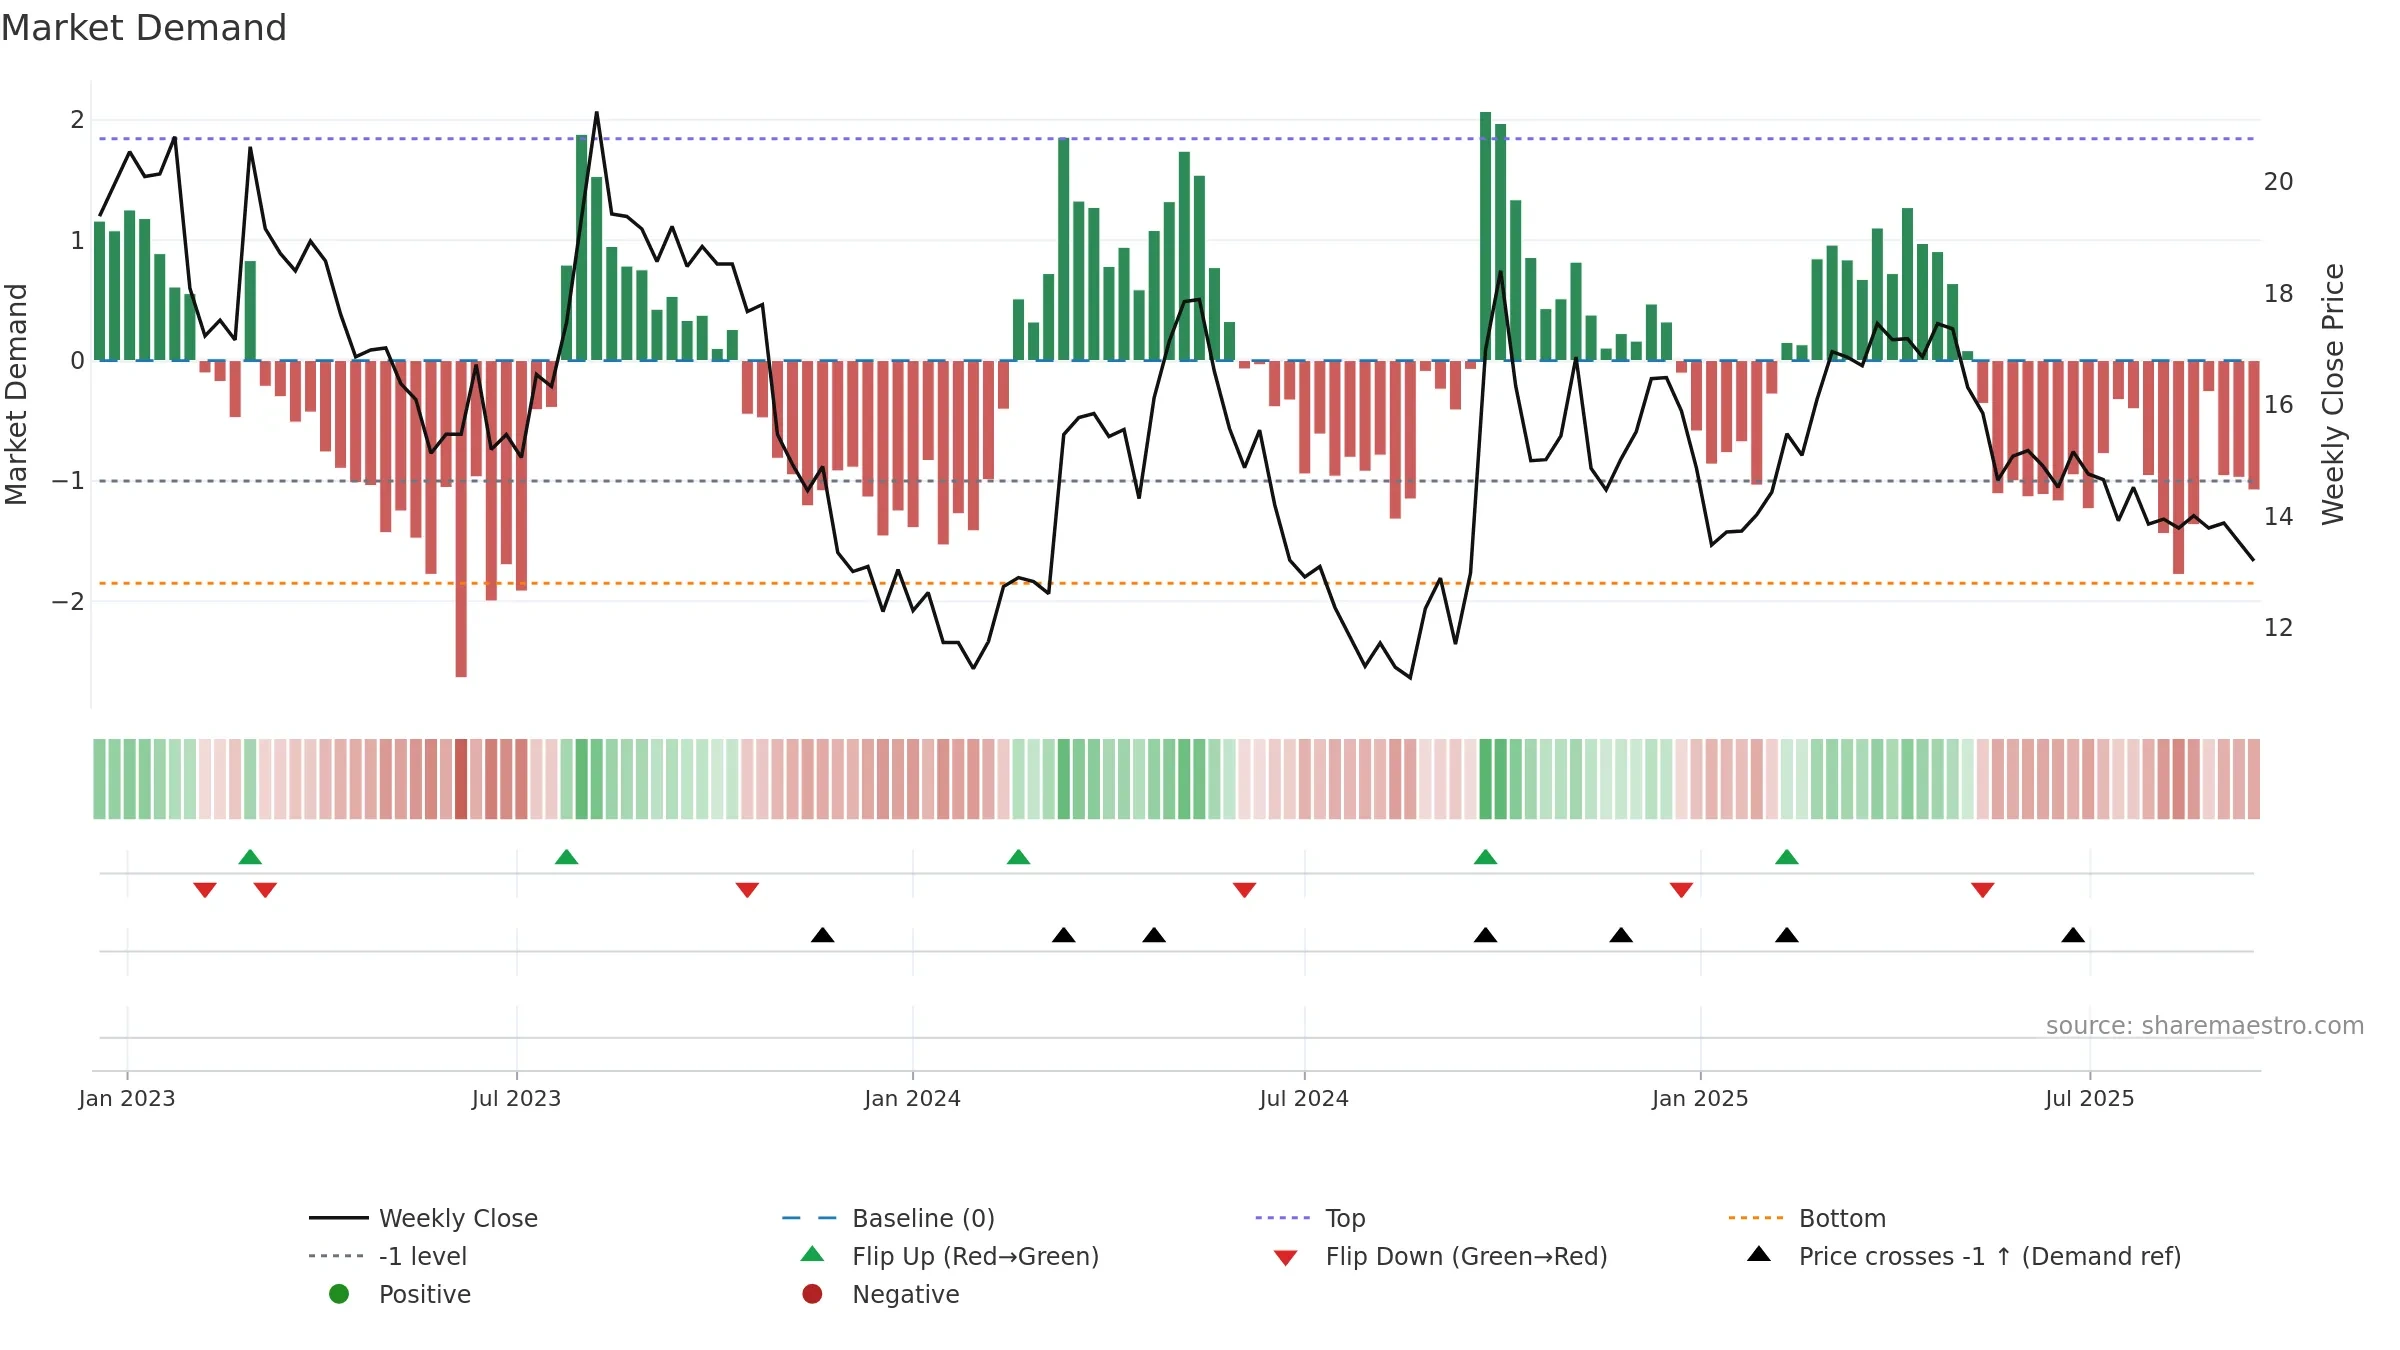
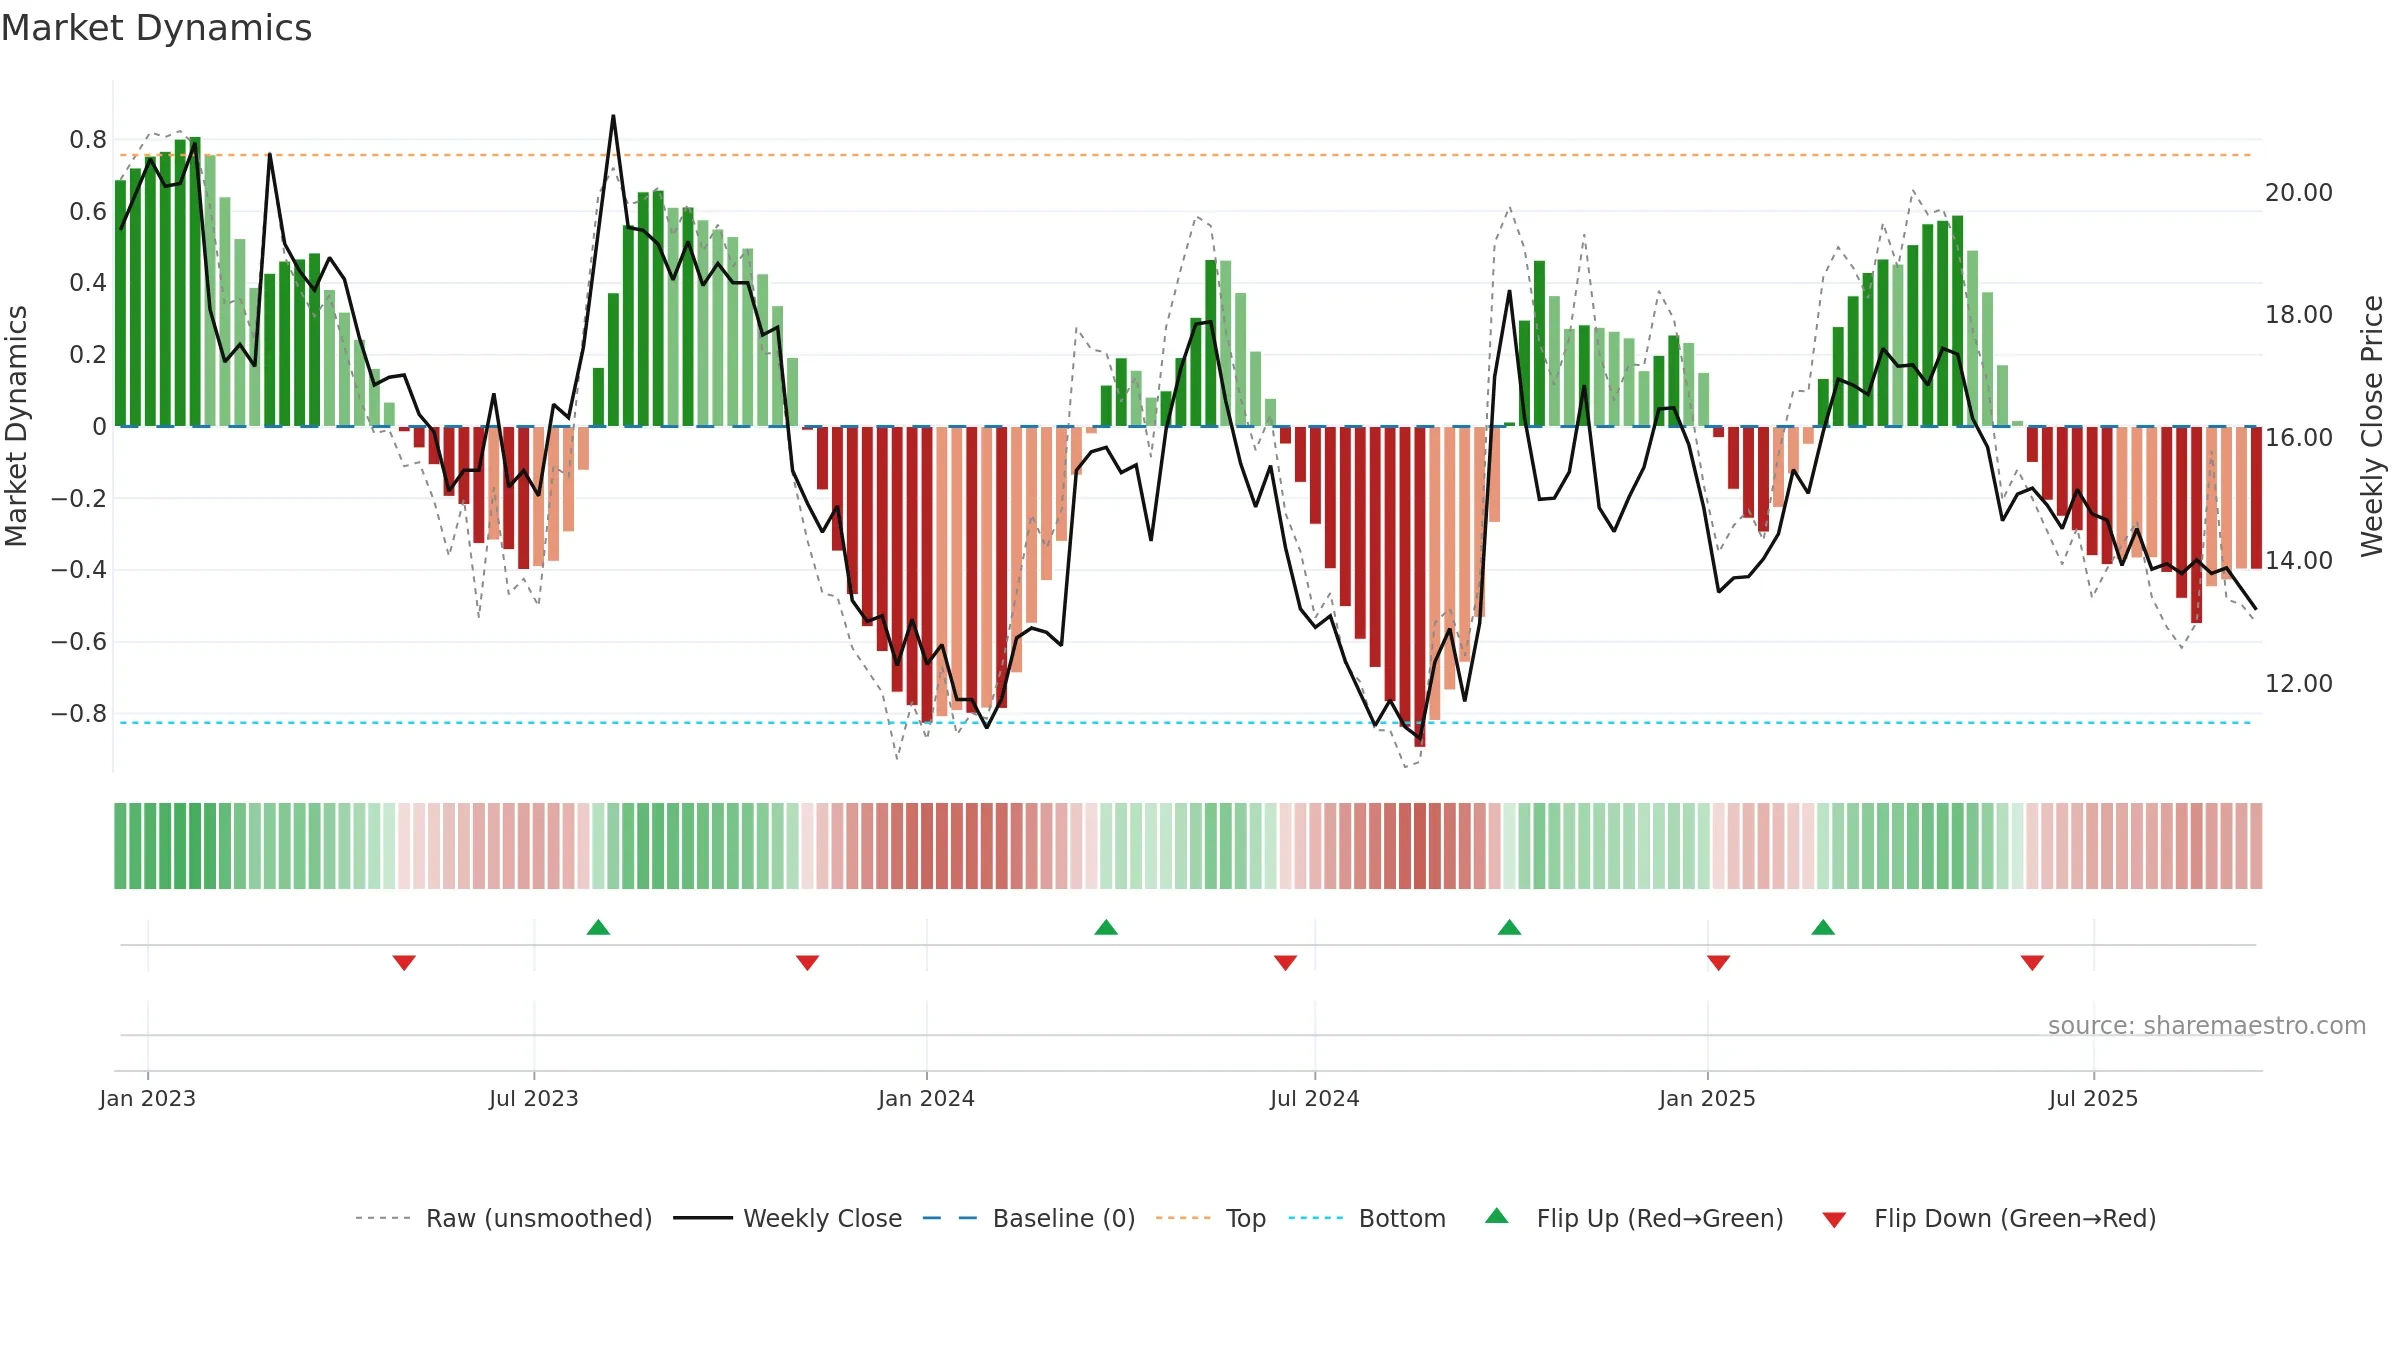
How to read this — Price slope is downward, indicating persistent supply pressure. Volume and price are moving in the same direction — a constructive confirmation. Returns are negatively correlated with volume — strength may come on lighter activity. Weak MA stack argues for caution; rallies can fail near the 8–13 week region. Price sits below key averages, keeping pressure on the tape.
Down-slope argues for patience; rallies can fade sooner unless participation improves.
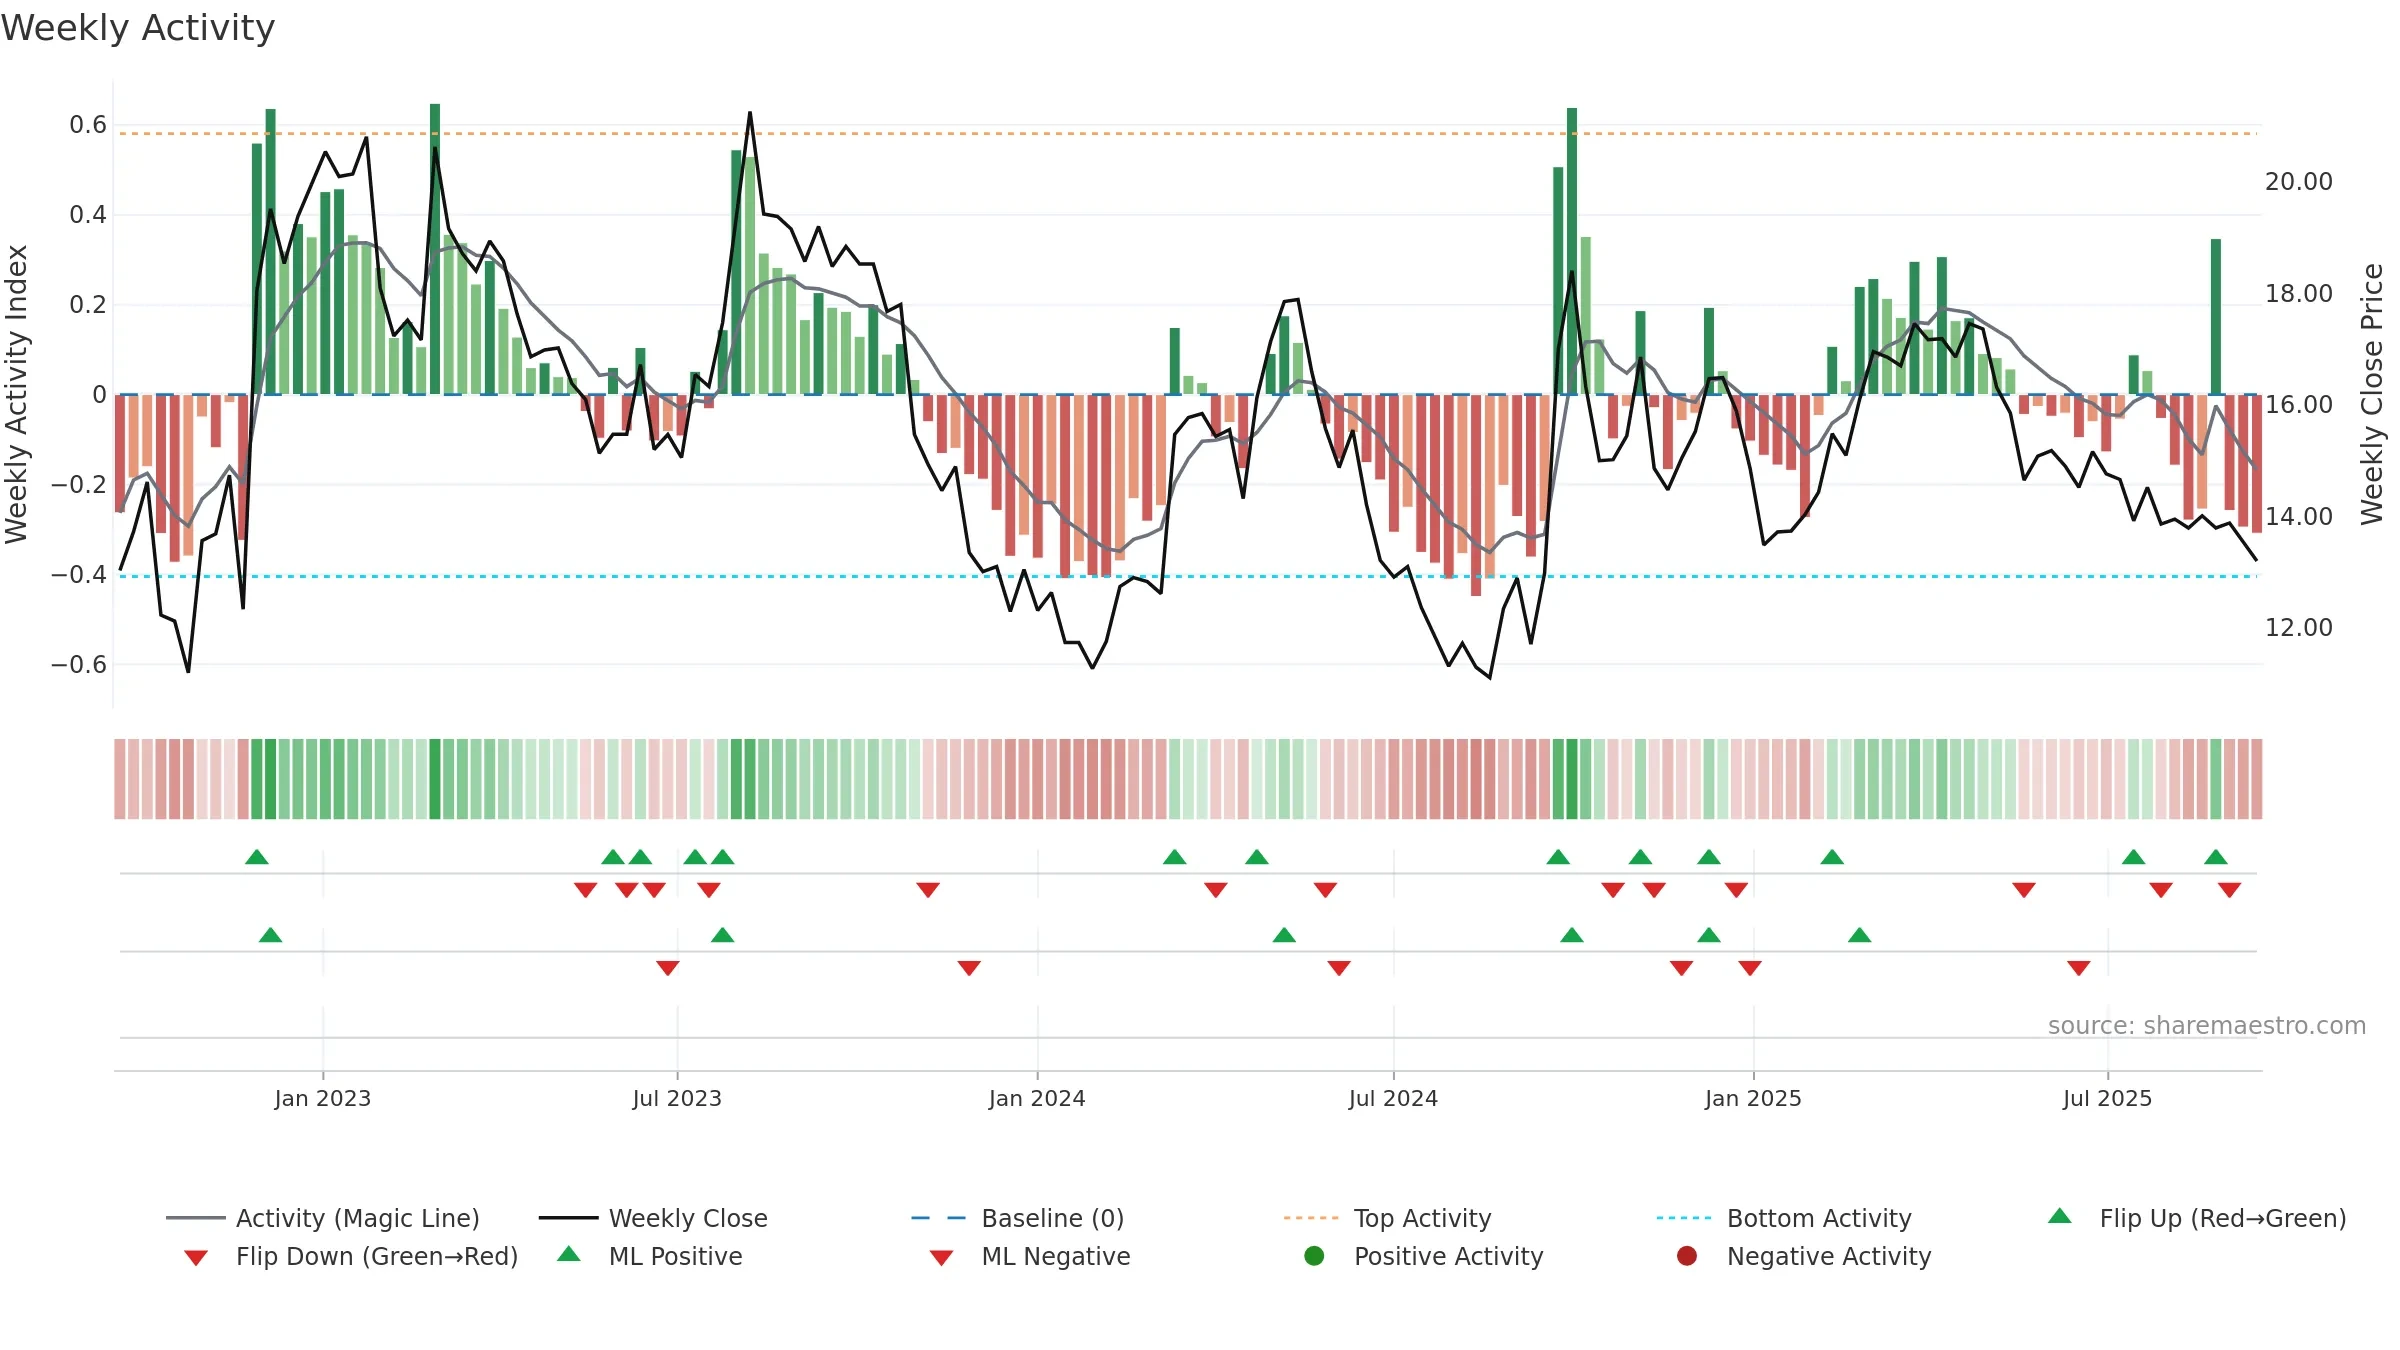
Gauge maps the trend signal to a 0–100 scale.
How to read this — Bearish backdrop but short-term momentum is improving; confirmation still needed.
Early improvement — look for a reclaim of 0.50→0.60 to validate.
Conclusion
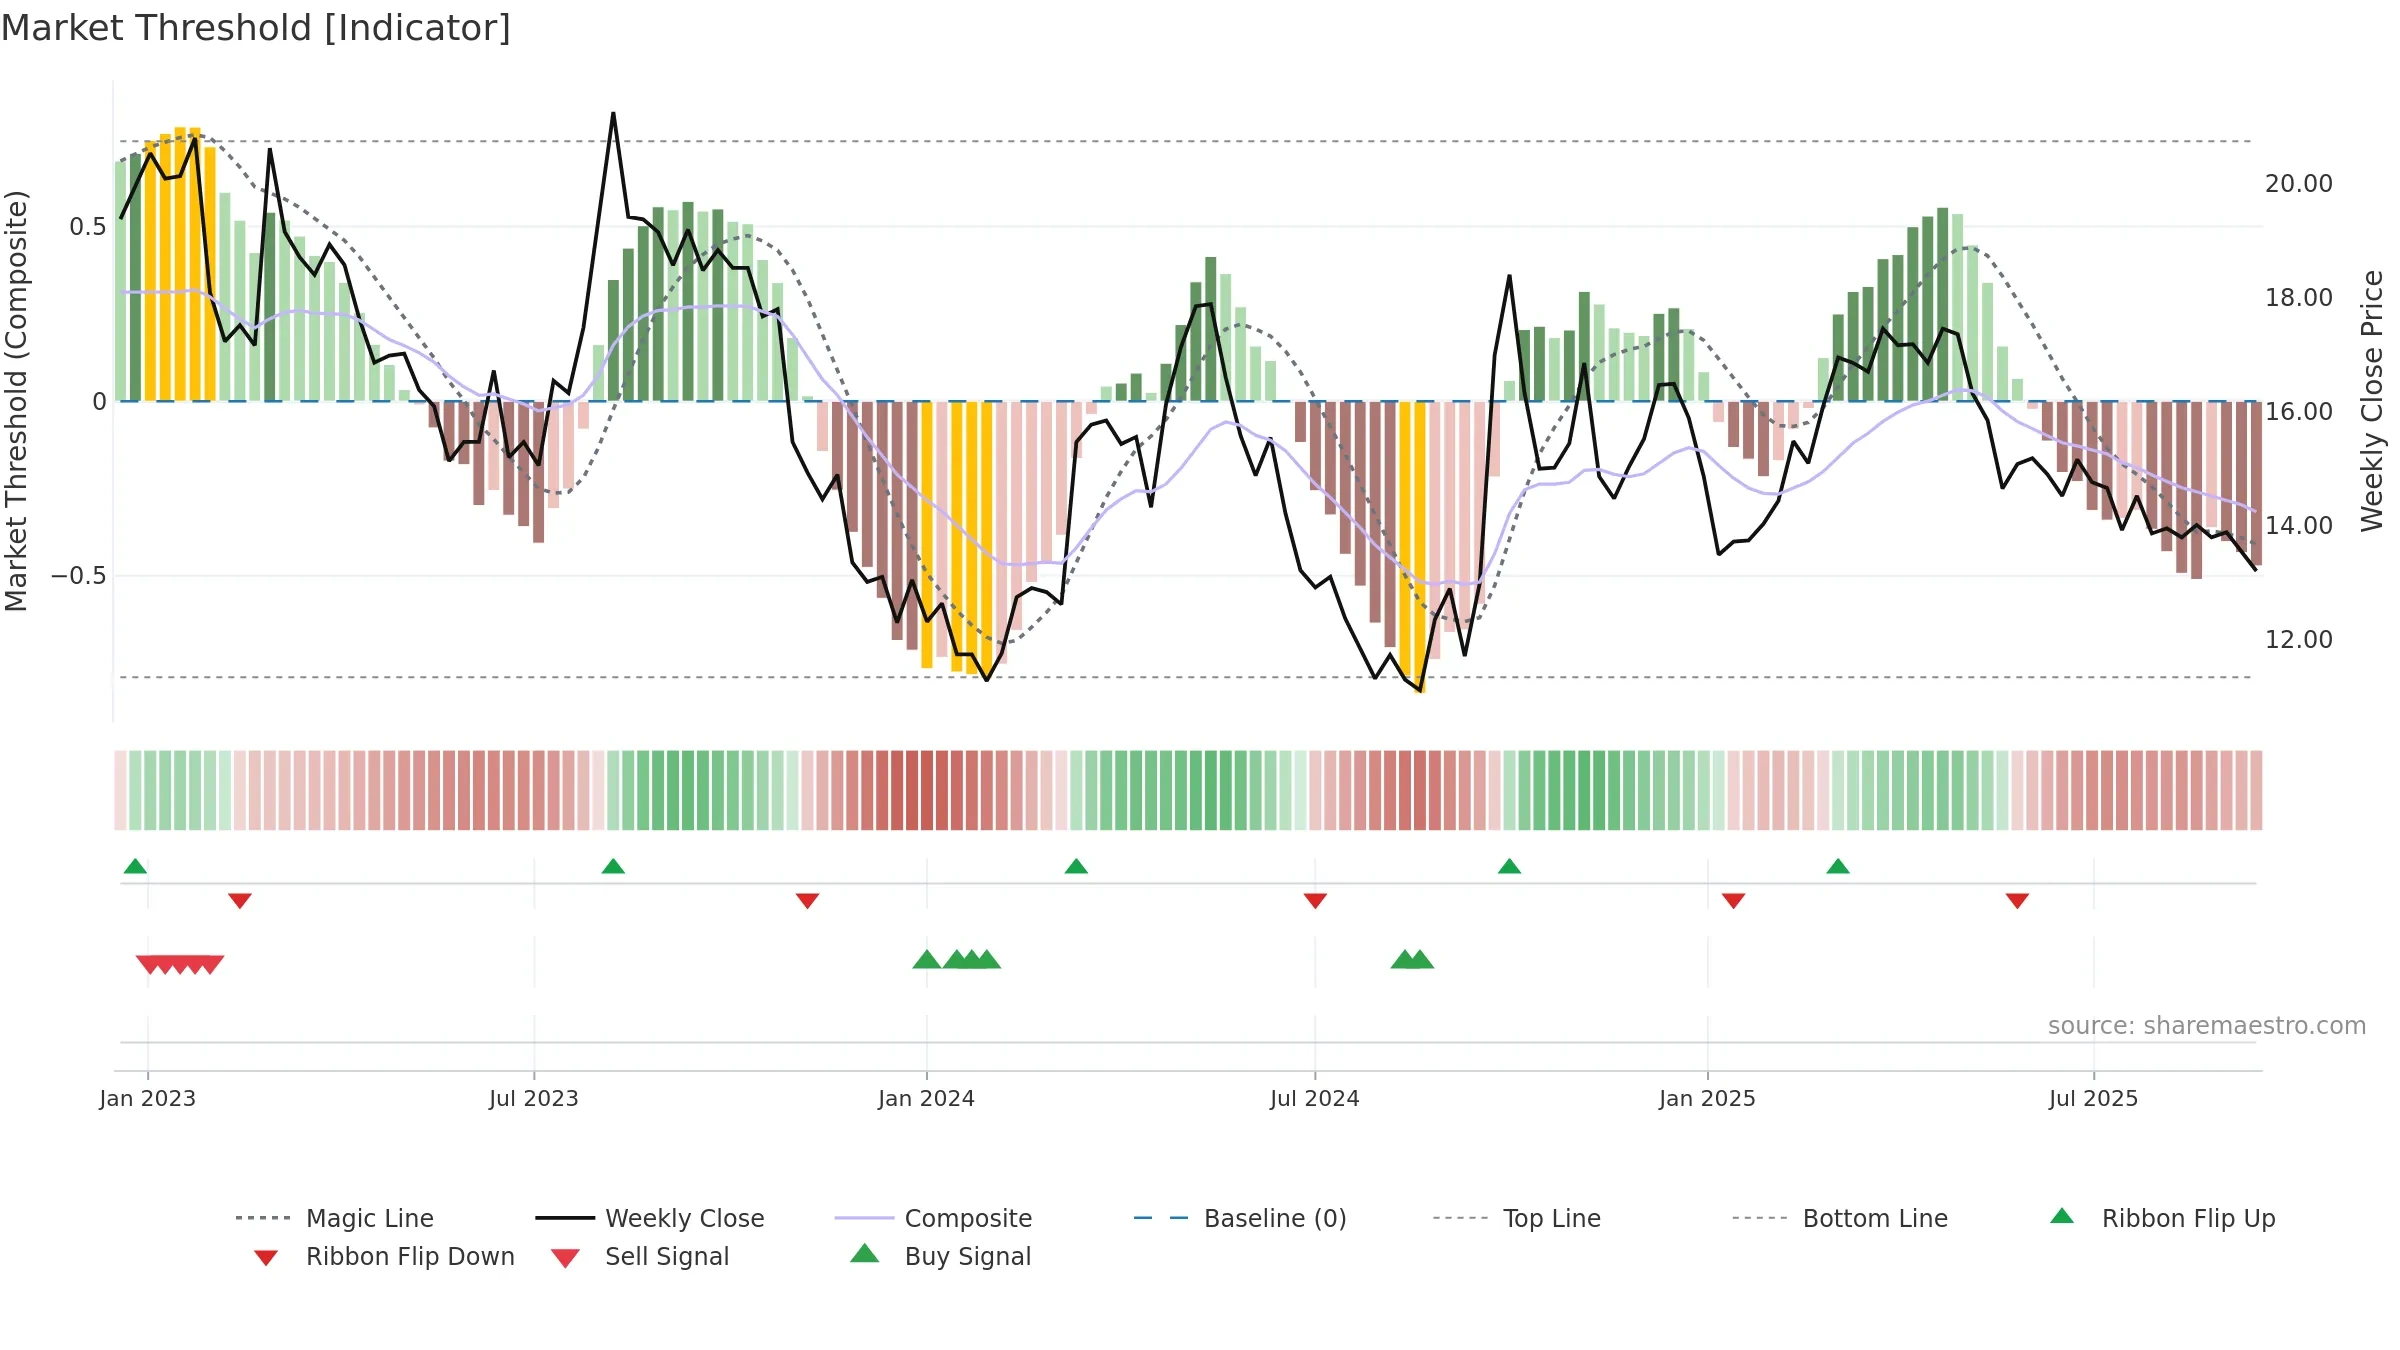
Negative setup. ★★☆☆☆ confidence. Price window: -4. Trend: Bottoming Attempt; gauge 24. In combination, liquidity confirms the move.
- Early improvement from bearish zone (bottoming attempt)
- Liquidity confirms the price trend
- Momentum is weak/falling
- Price is not above key averages
- Weak moving-average stack
- Negative multi-week performance
Why: Price window -4.76% over 8w. Close is -5.78% below the prior-window high. Return volatility 2.09%. Volume trend falling. Liquidity convergence with price. Trend state bottoming attempt. Low-regime (≤0.25) upticks 2/4 (50.0%) • Distributing. MA stack weak. Momentum bearish and falling.
Tip: Most metrics include a hover tooltip where they appear in the report.