AGP Málaga Socimi, S.A.
MLAGP EPA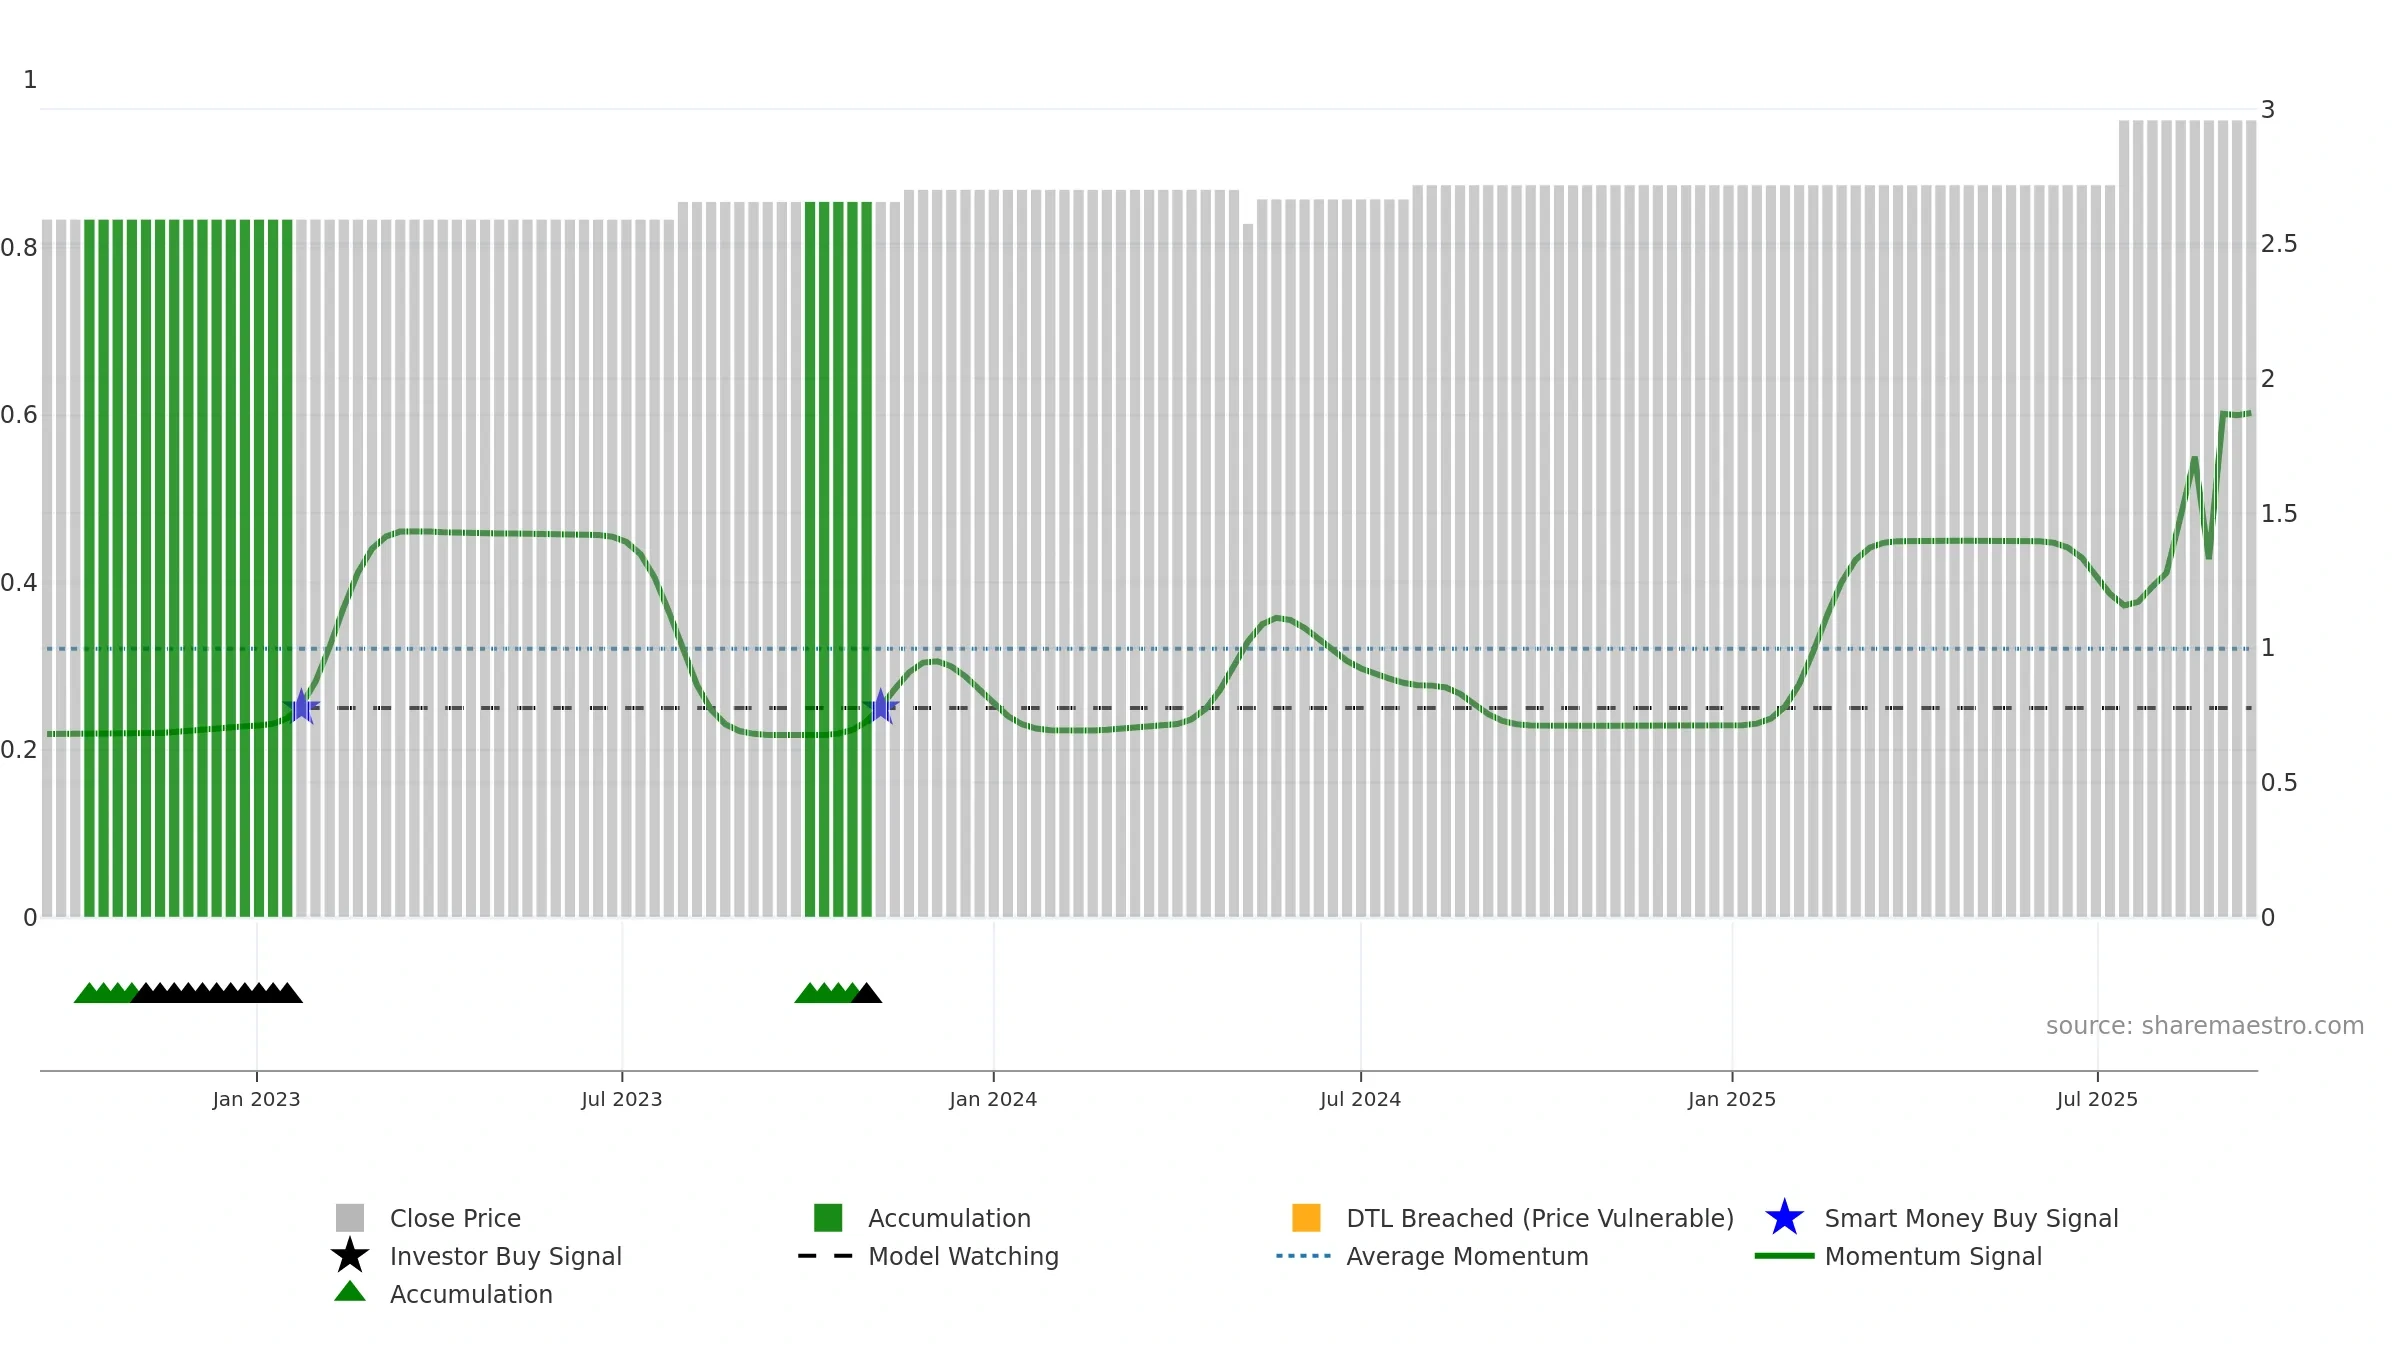

Weekly Report
AGP Málaga Socimi, S.A. closed at 2.9600 (0.00% WoW) . Data window ends Mon, 15 Sep 2025.
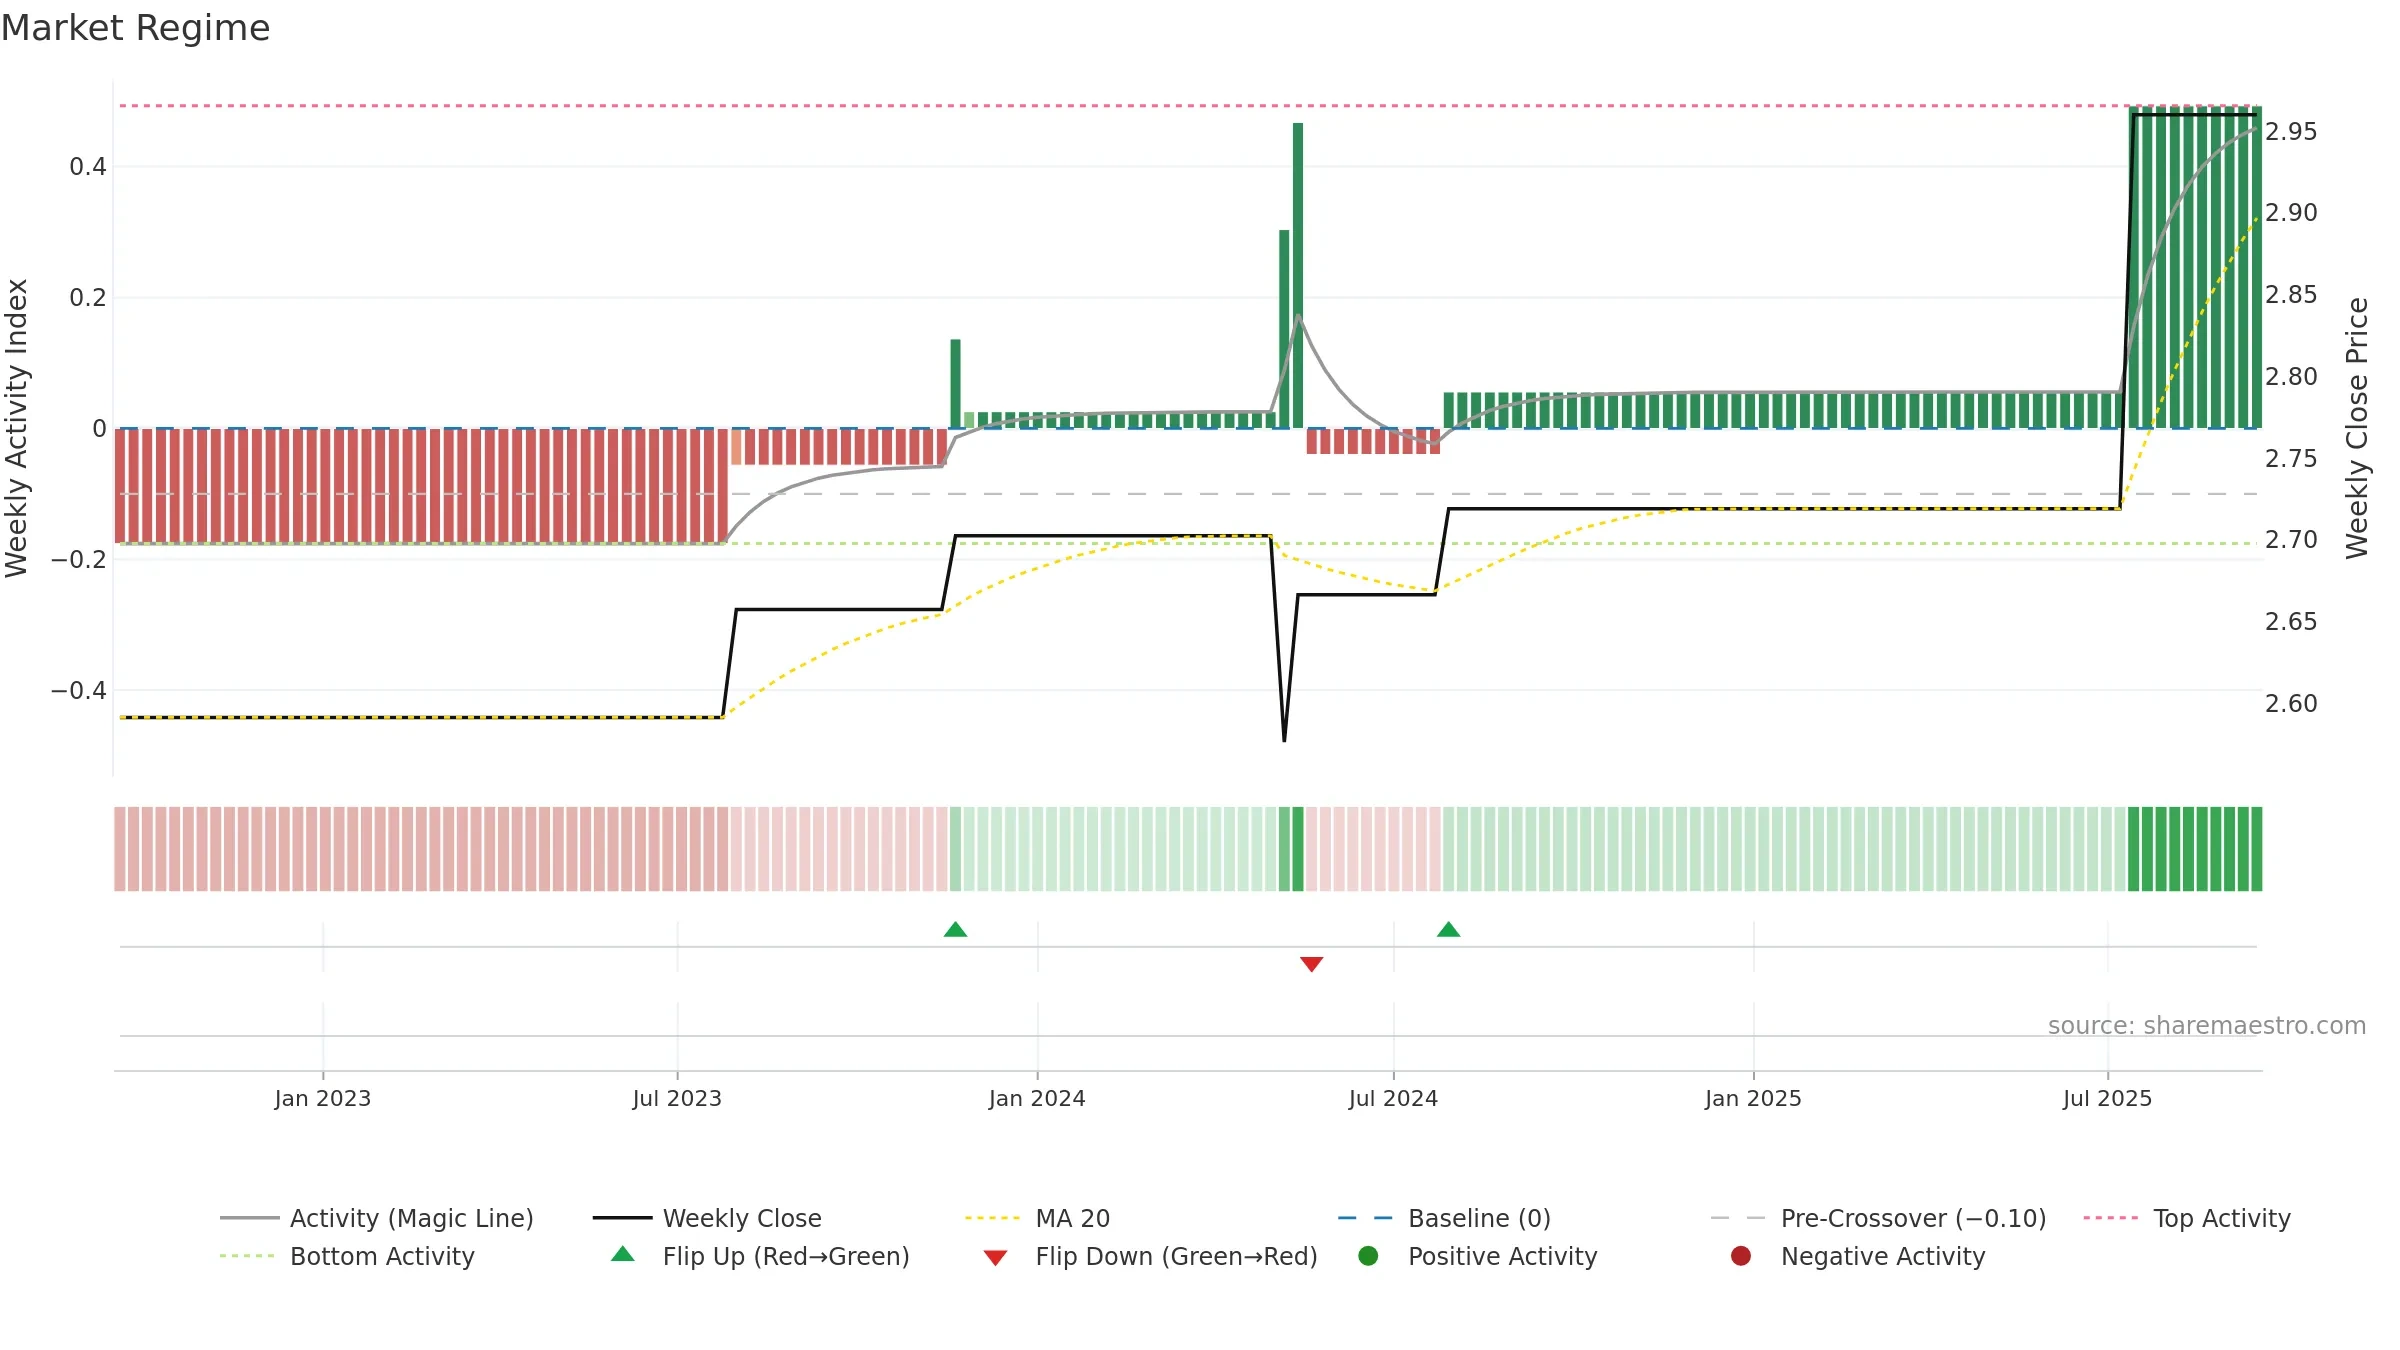
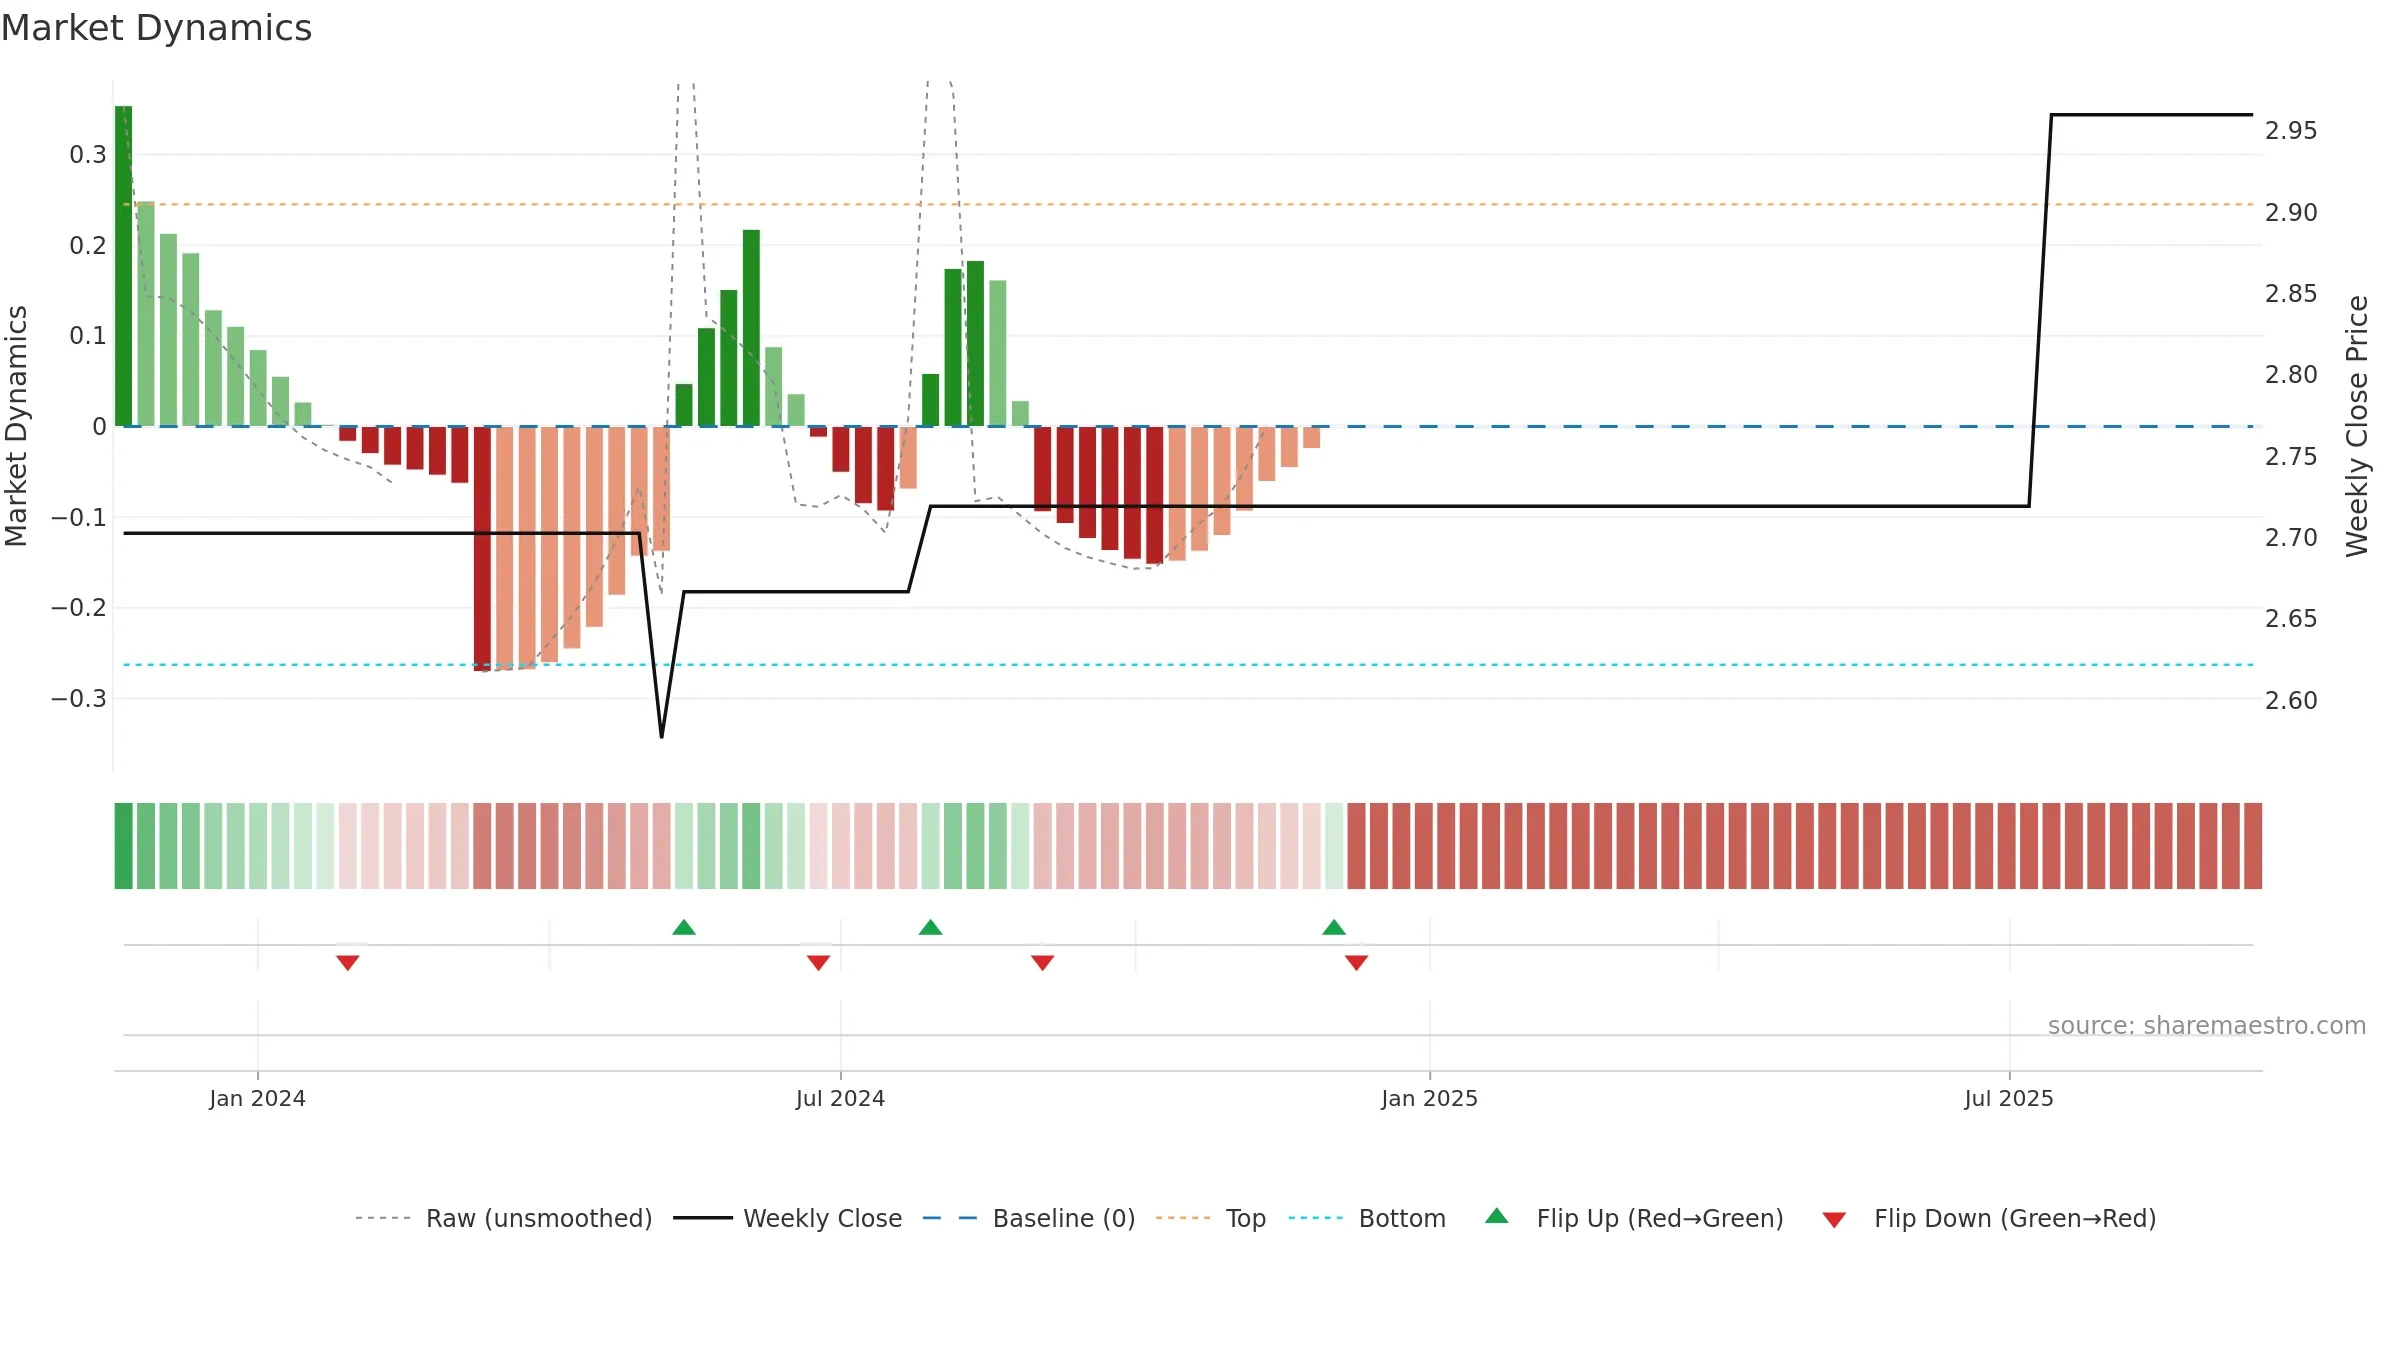
How to read this — Price slope is flat, suggesting balance between buyers and sellers. Low weekly volatility favours steadier follow-through. Volume or price is flat; confirmation from liquidity is limited. Distance to baseline is narrowing — reverting closer to its fair-value track.
Flat slope suggests a wait-and-see approach until the balance shifts.
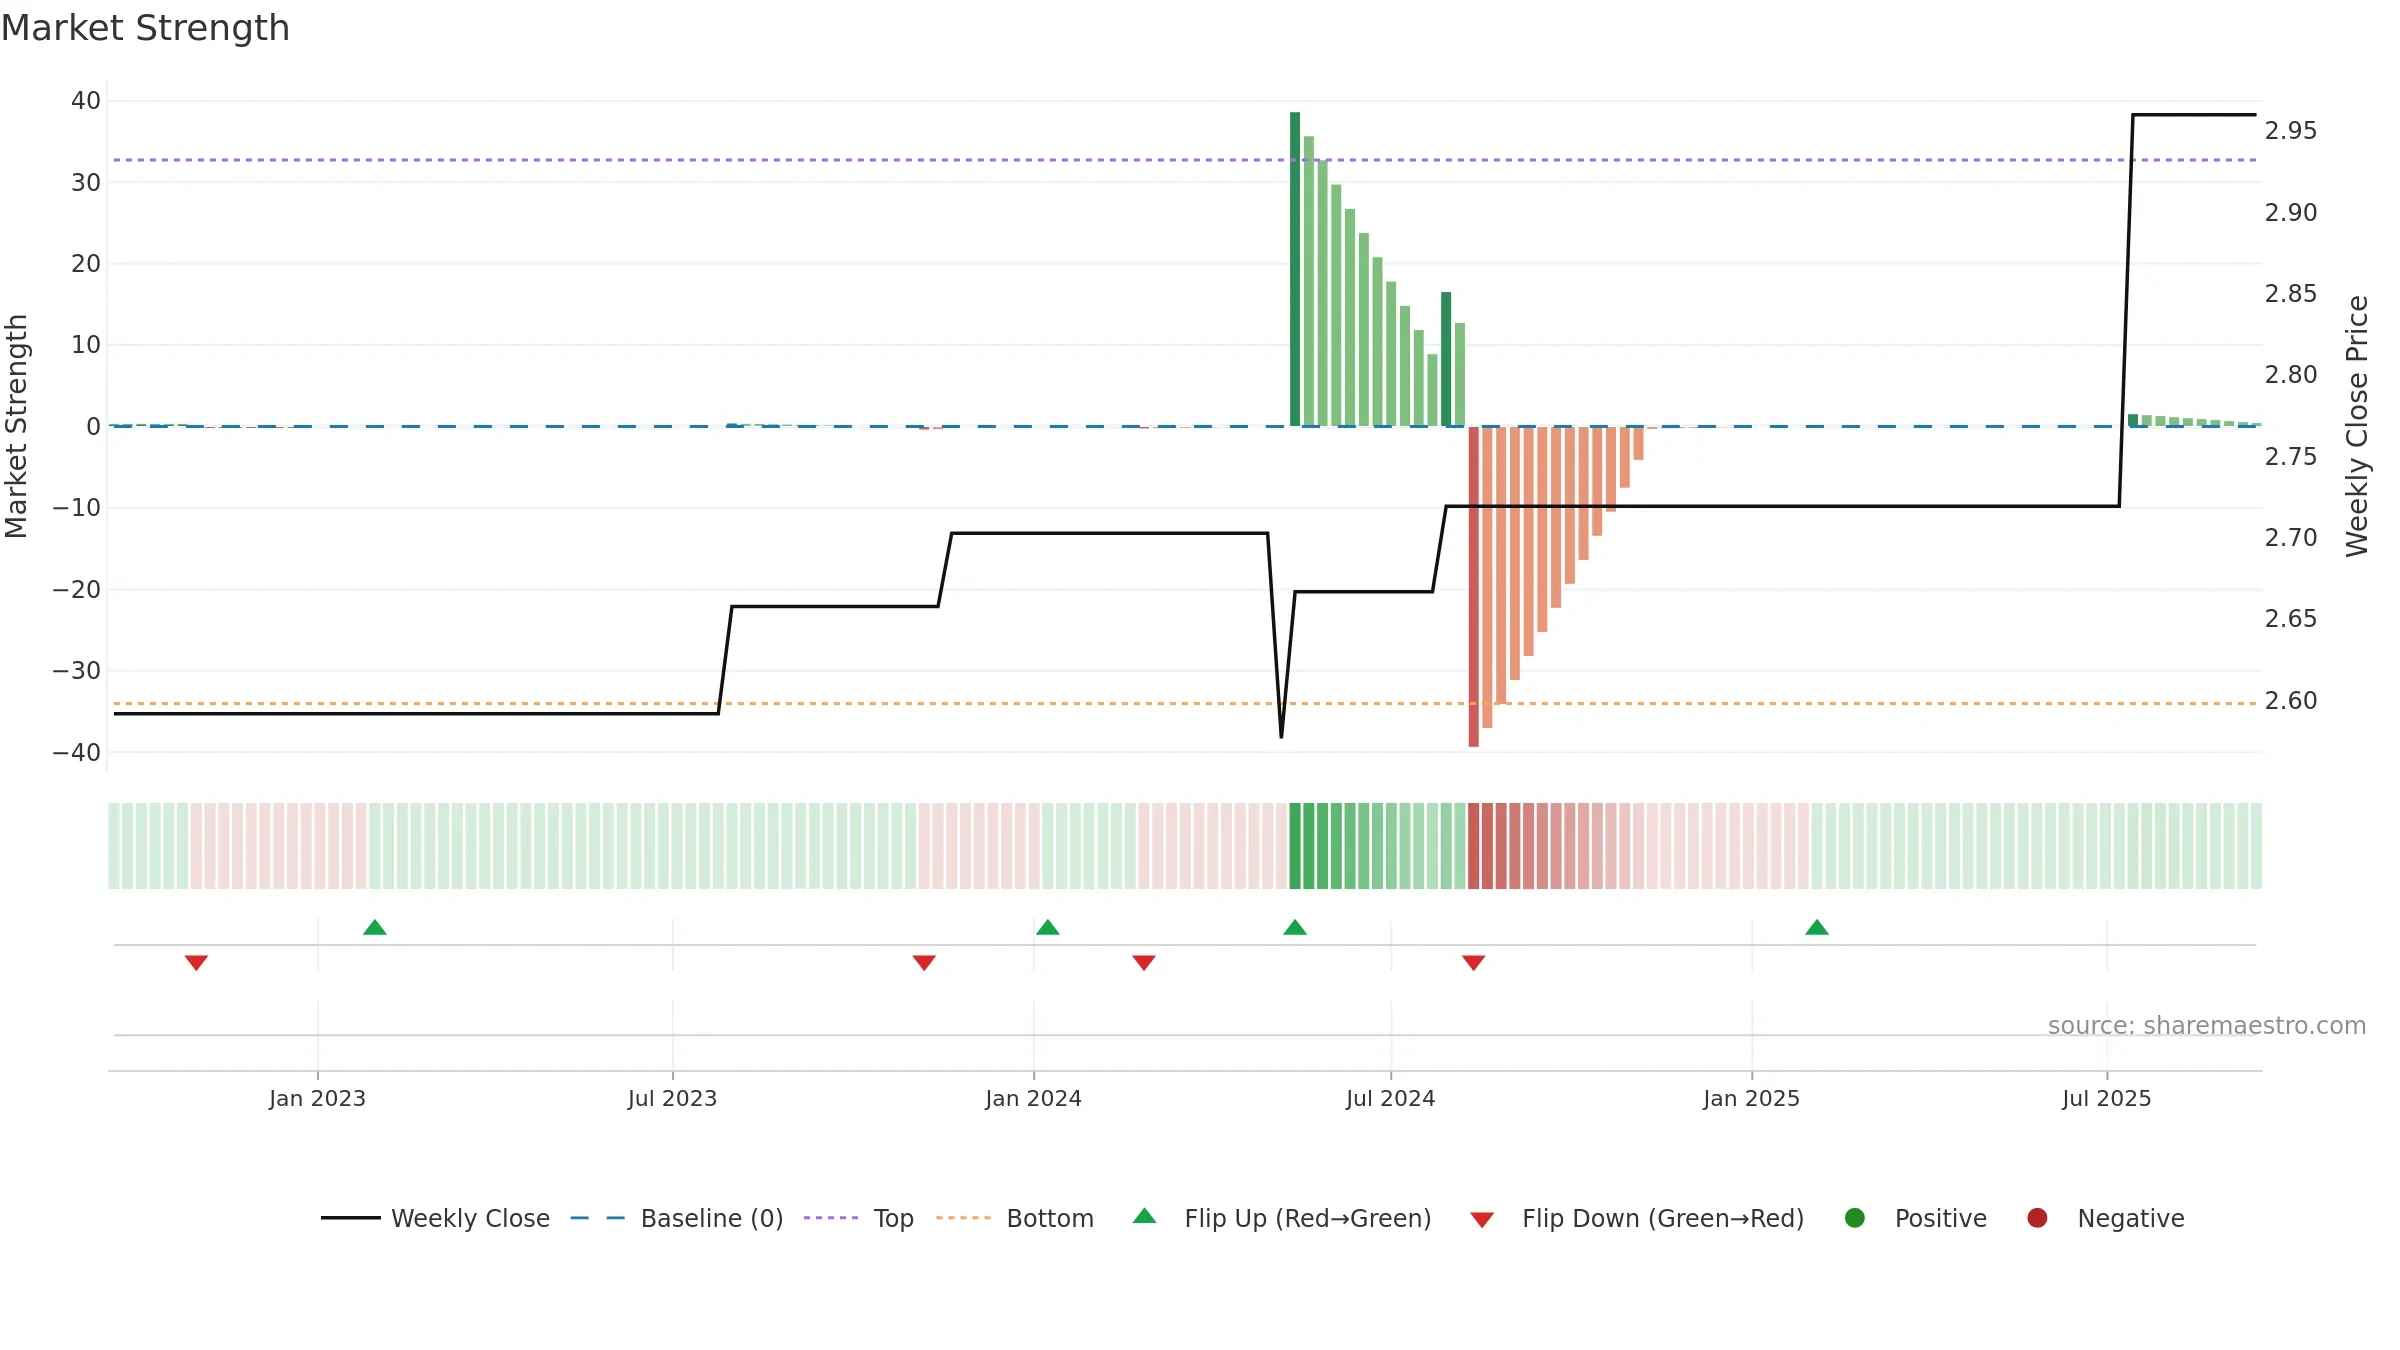
Gauge maps the trend signal to a 0–100 scale.
How to read this — Range-bound conditions; conviction is limited until a break or acceleration emerges.
Wait for a directional break or improving acceleration.
Conclusion
Positive setup. ★★★★☆ confidence. Price window: 0. Trend: Range / Neutral; gauge 60. In combination, liquidity confirmation is mixed.
- Momentum is bullish and rising
- Low return volatility supports durability
- Price is not above key averages
Why: Return volatility 0.00%. Liquidity flat with price. Trend state range / neutral. Momentum bullish and rising.
Tip: Most metrics include a hover tooltip where they appear in the report.