Studio City International Holdings Limited
MSC NYSE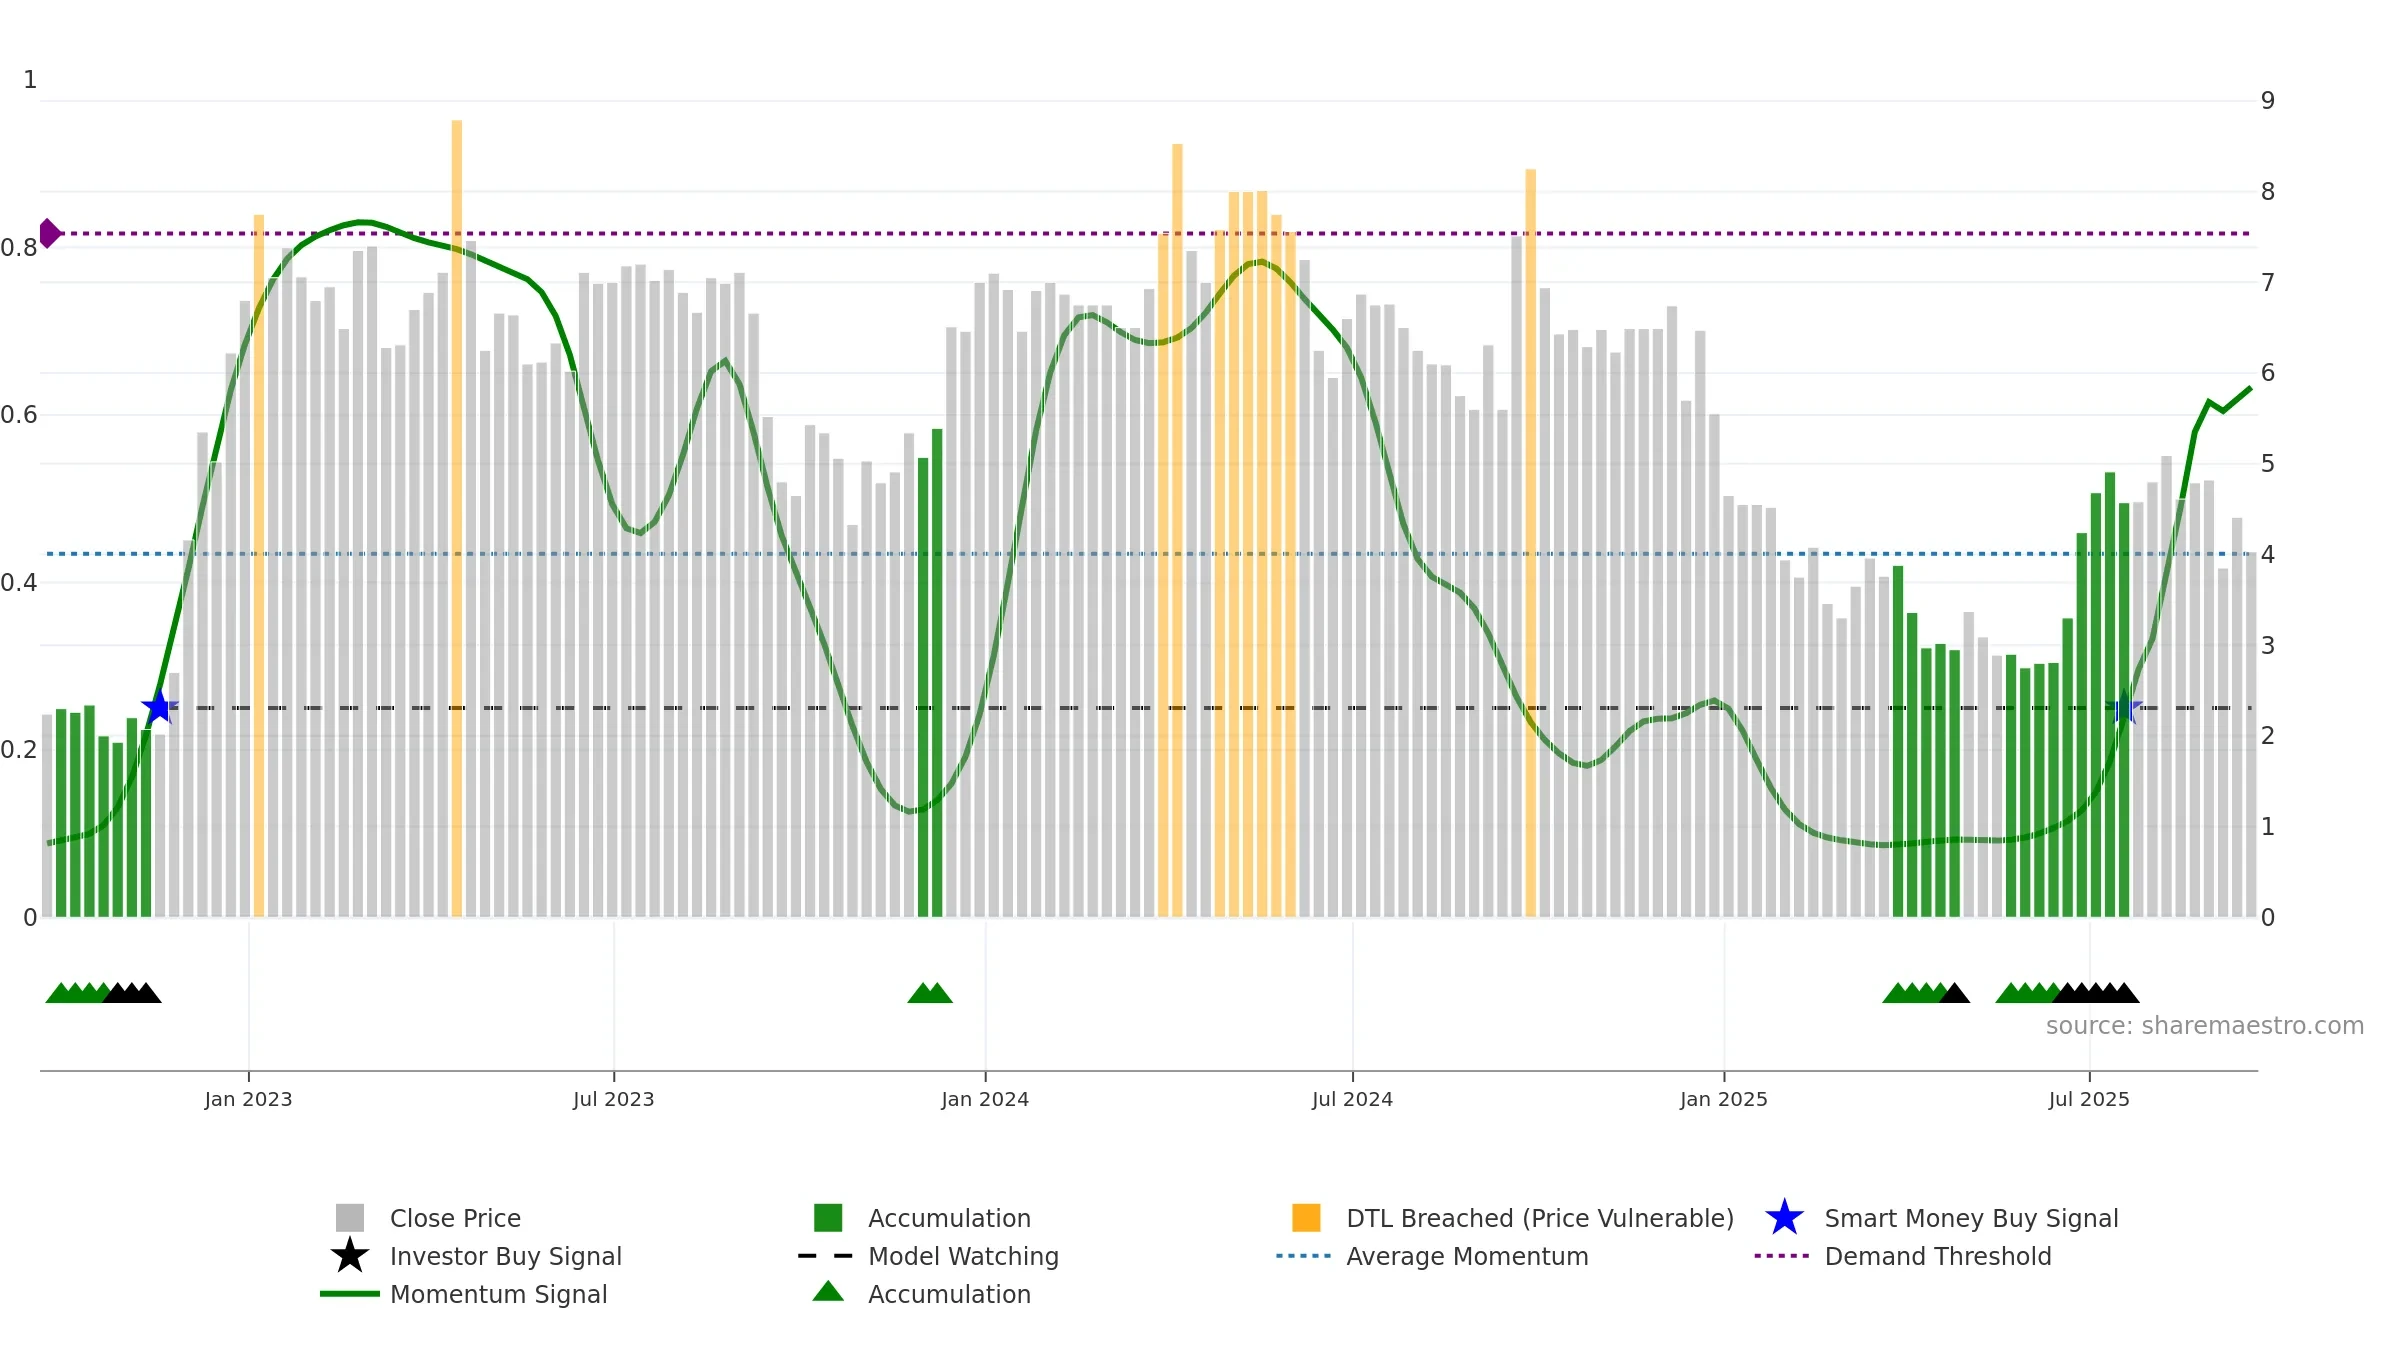
Weekly Report
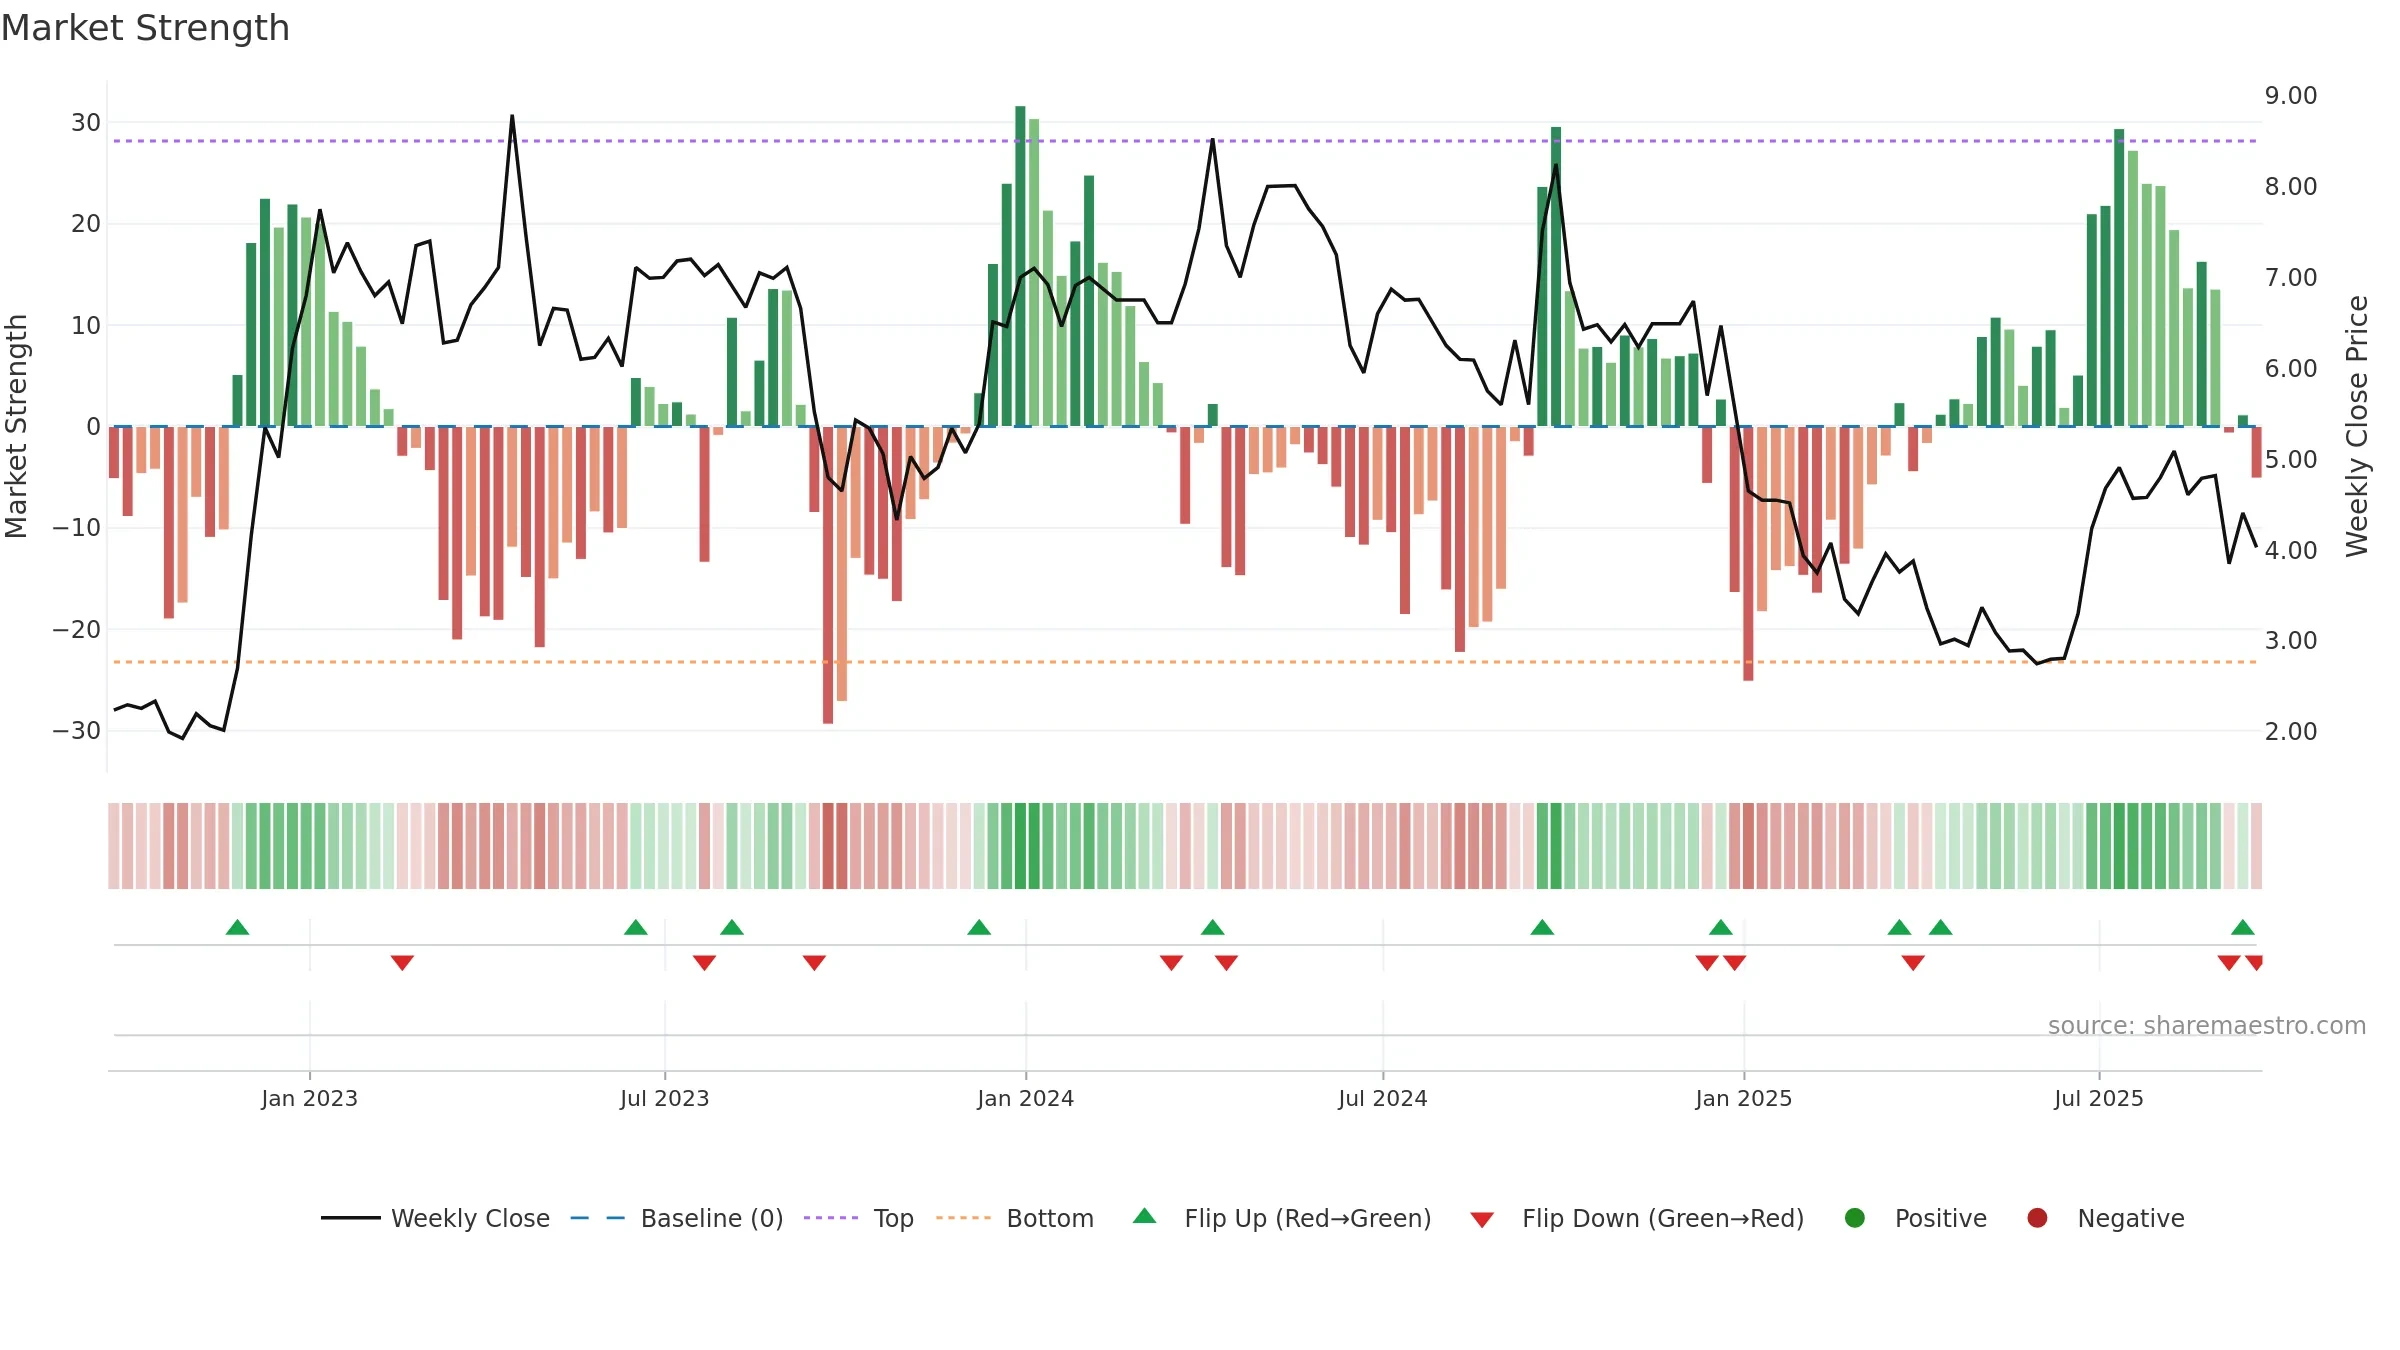
Studio City International Holdings Limited closed at 4.0300 (3.87% WoW) . Data window ends Fri, 19 Sep 2025.
How to read this — Price slope is downward, indicating persistent supply pressure. Volume trend diverges from price — watch for fatigue or rotation. Distance to baseline is narrowing — reverting closer to its fair-value track.
Down-slope argues for patience; rallies can fade sooner unless participation improves. Because liquidity isn’t confirming, prefer evidence of fresh demand before chasing moves.
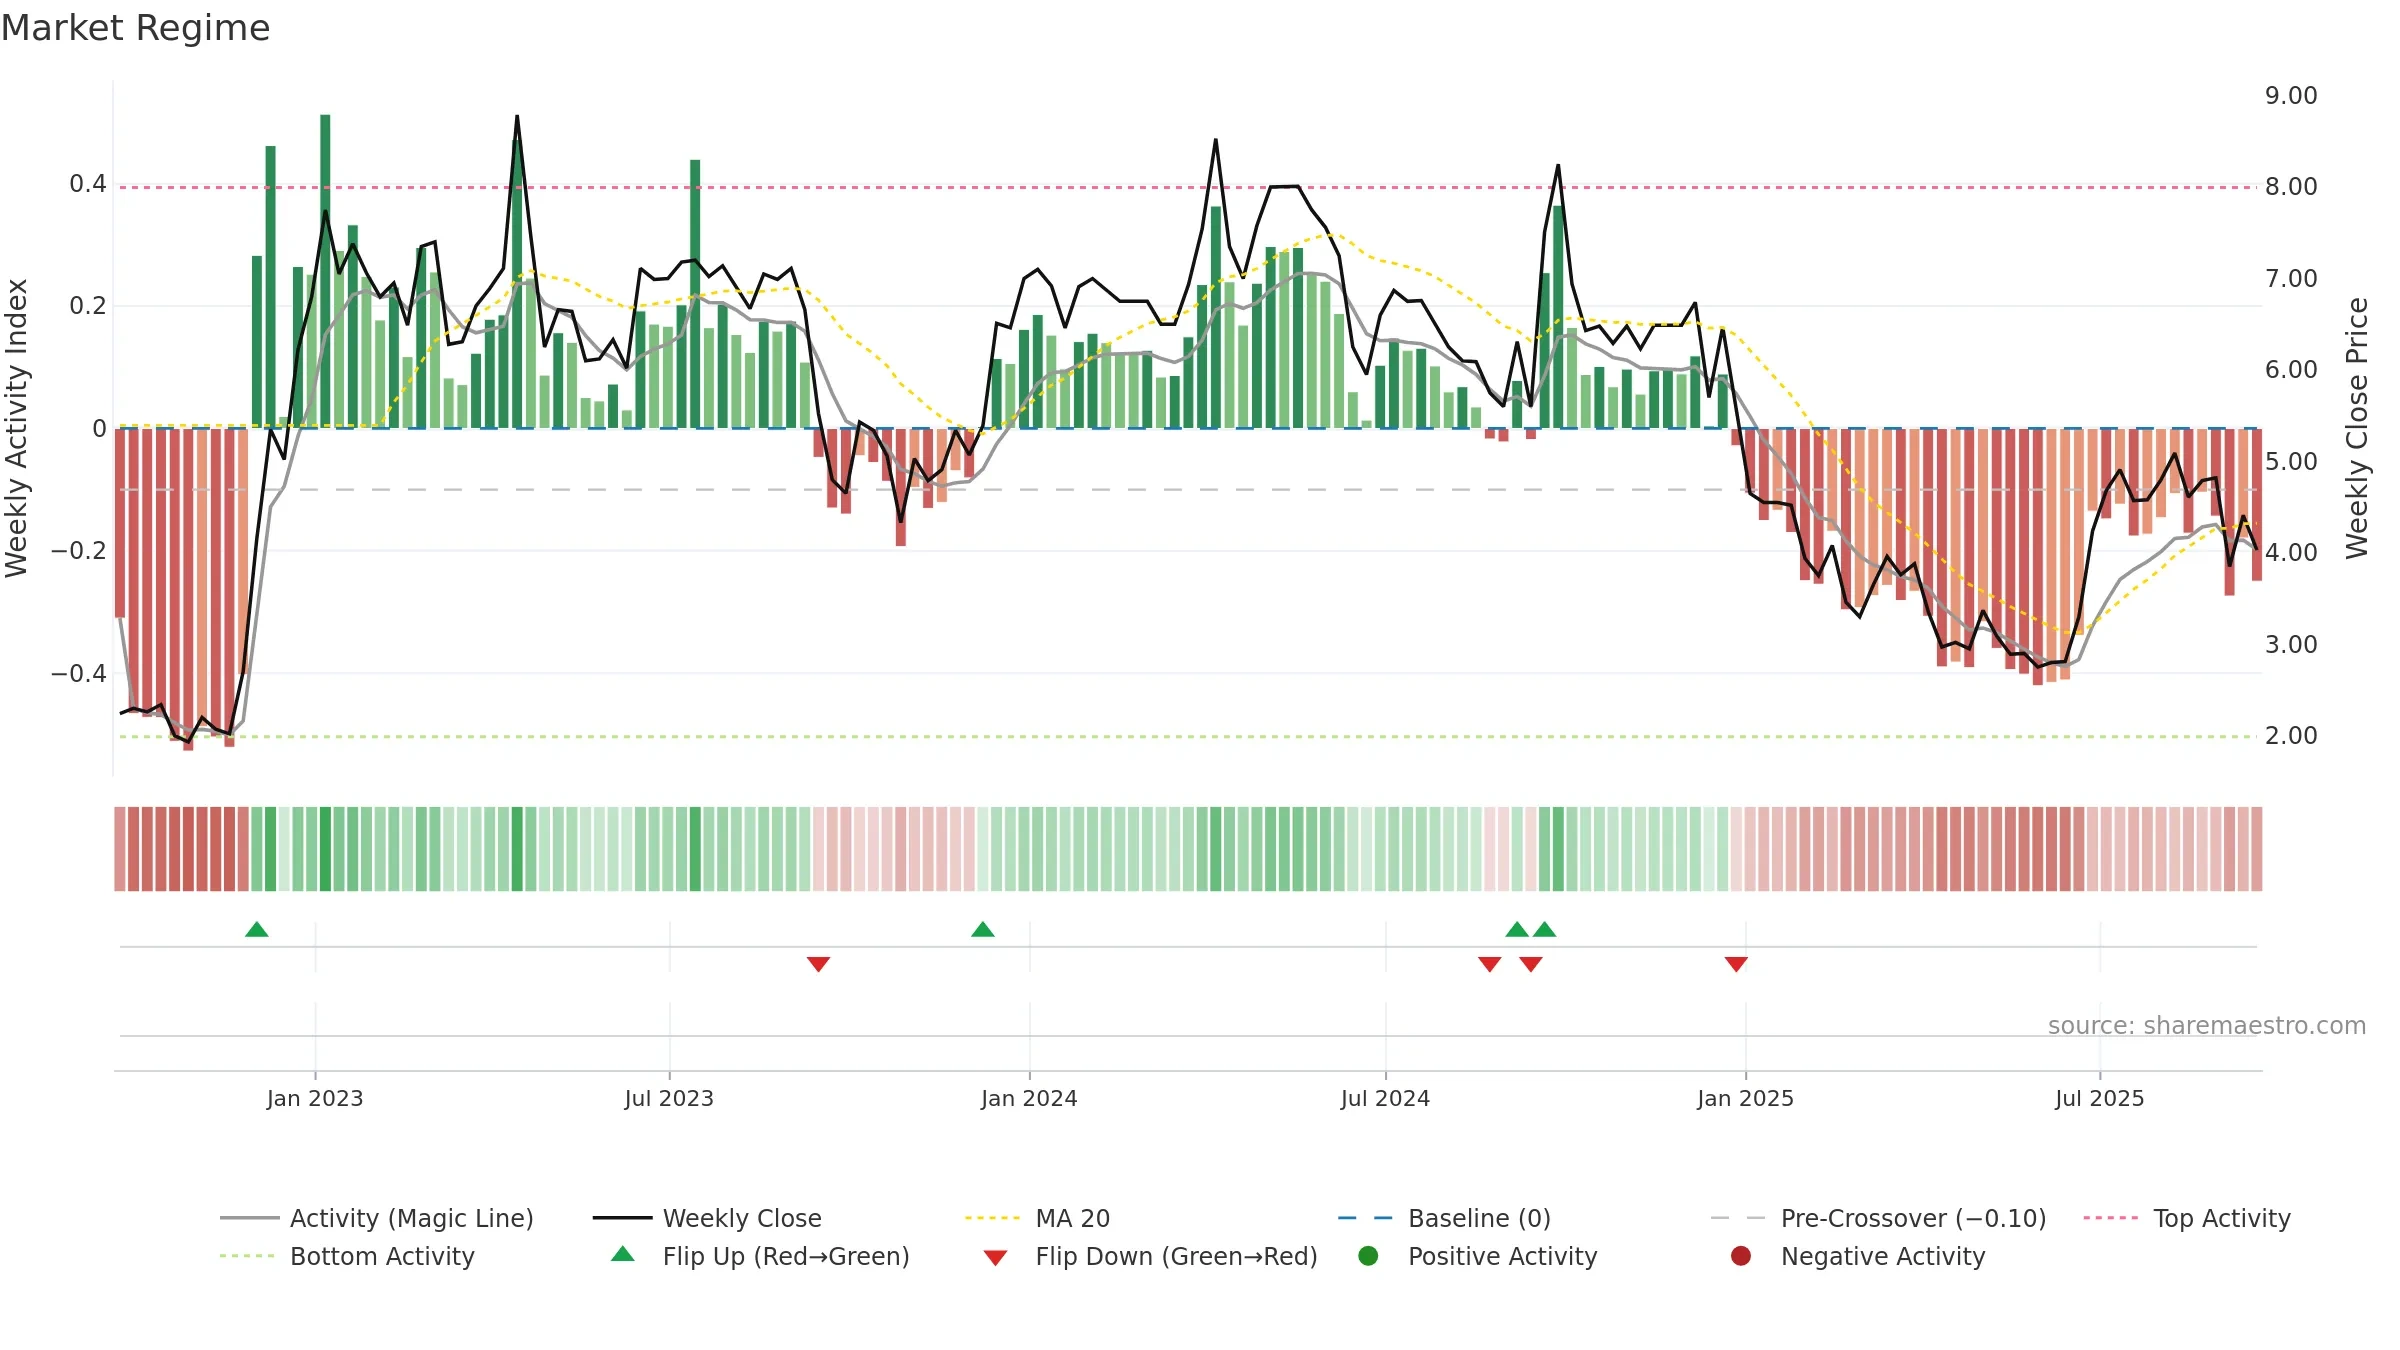
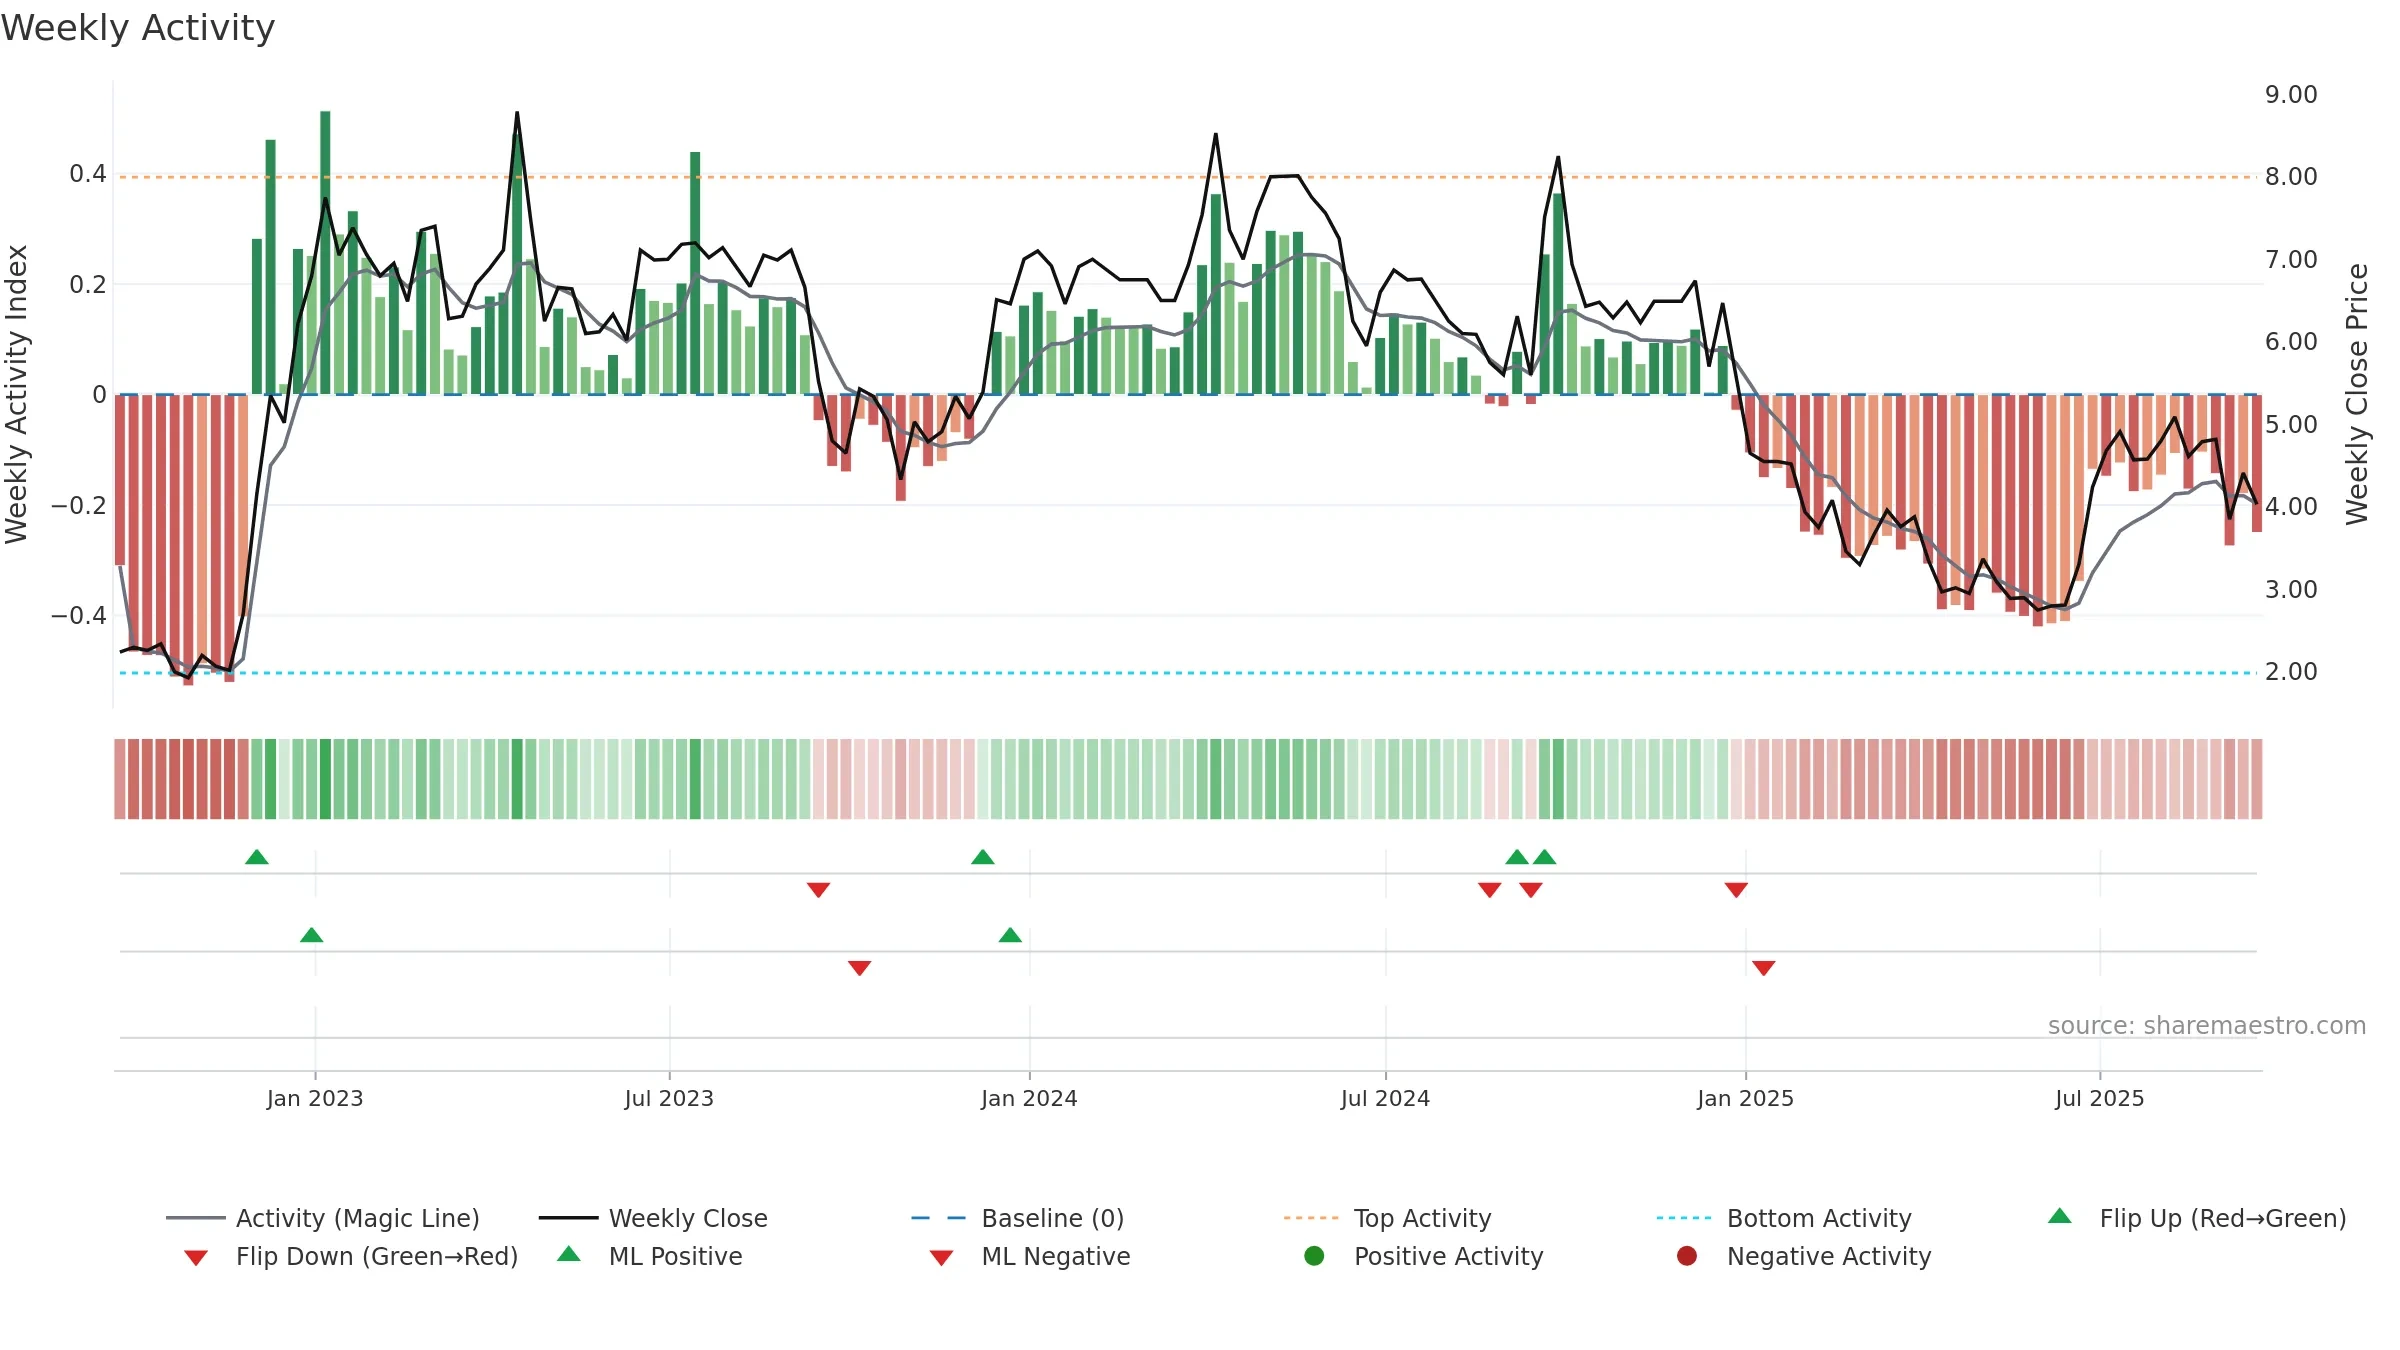
Gauge maps the trend signal to a 0–100 scale.
How to read this — Range-bound conditions; conviction is limited until a break or acceleration emerges.
Wait for a directional break or improving acceleration.
Conclusion
Neutral setup. ★★★☆☆ confidence. Price window: -16. Trend: Range / Neutral; gauge 63. In combination, liquidity diverges from price.
- Momentum is bullish and rising
- Price is not above key averages
- Liquidity diverges from price
- Negative multi-week performance
Why: Price window -16.04% over 8w. Close is -20.83% below the prior-window high. Volume trend rising. Liquidity divergence with price. Trend state range / neutral. Momentum bullish and rising.
Tip: Most metrics include a hover tooltip where they appear in the report.