JD.com, Inc.
JD NASDAQ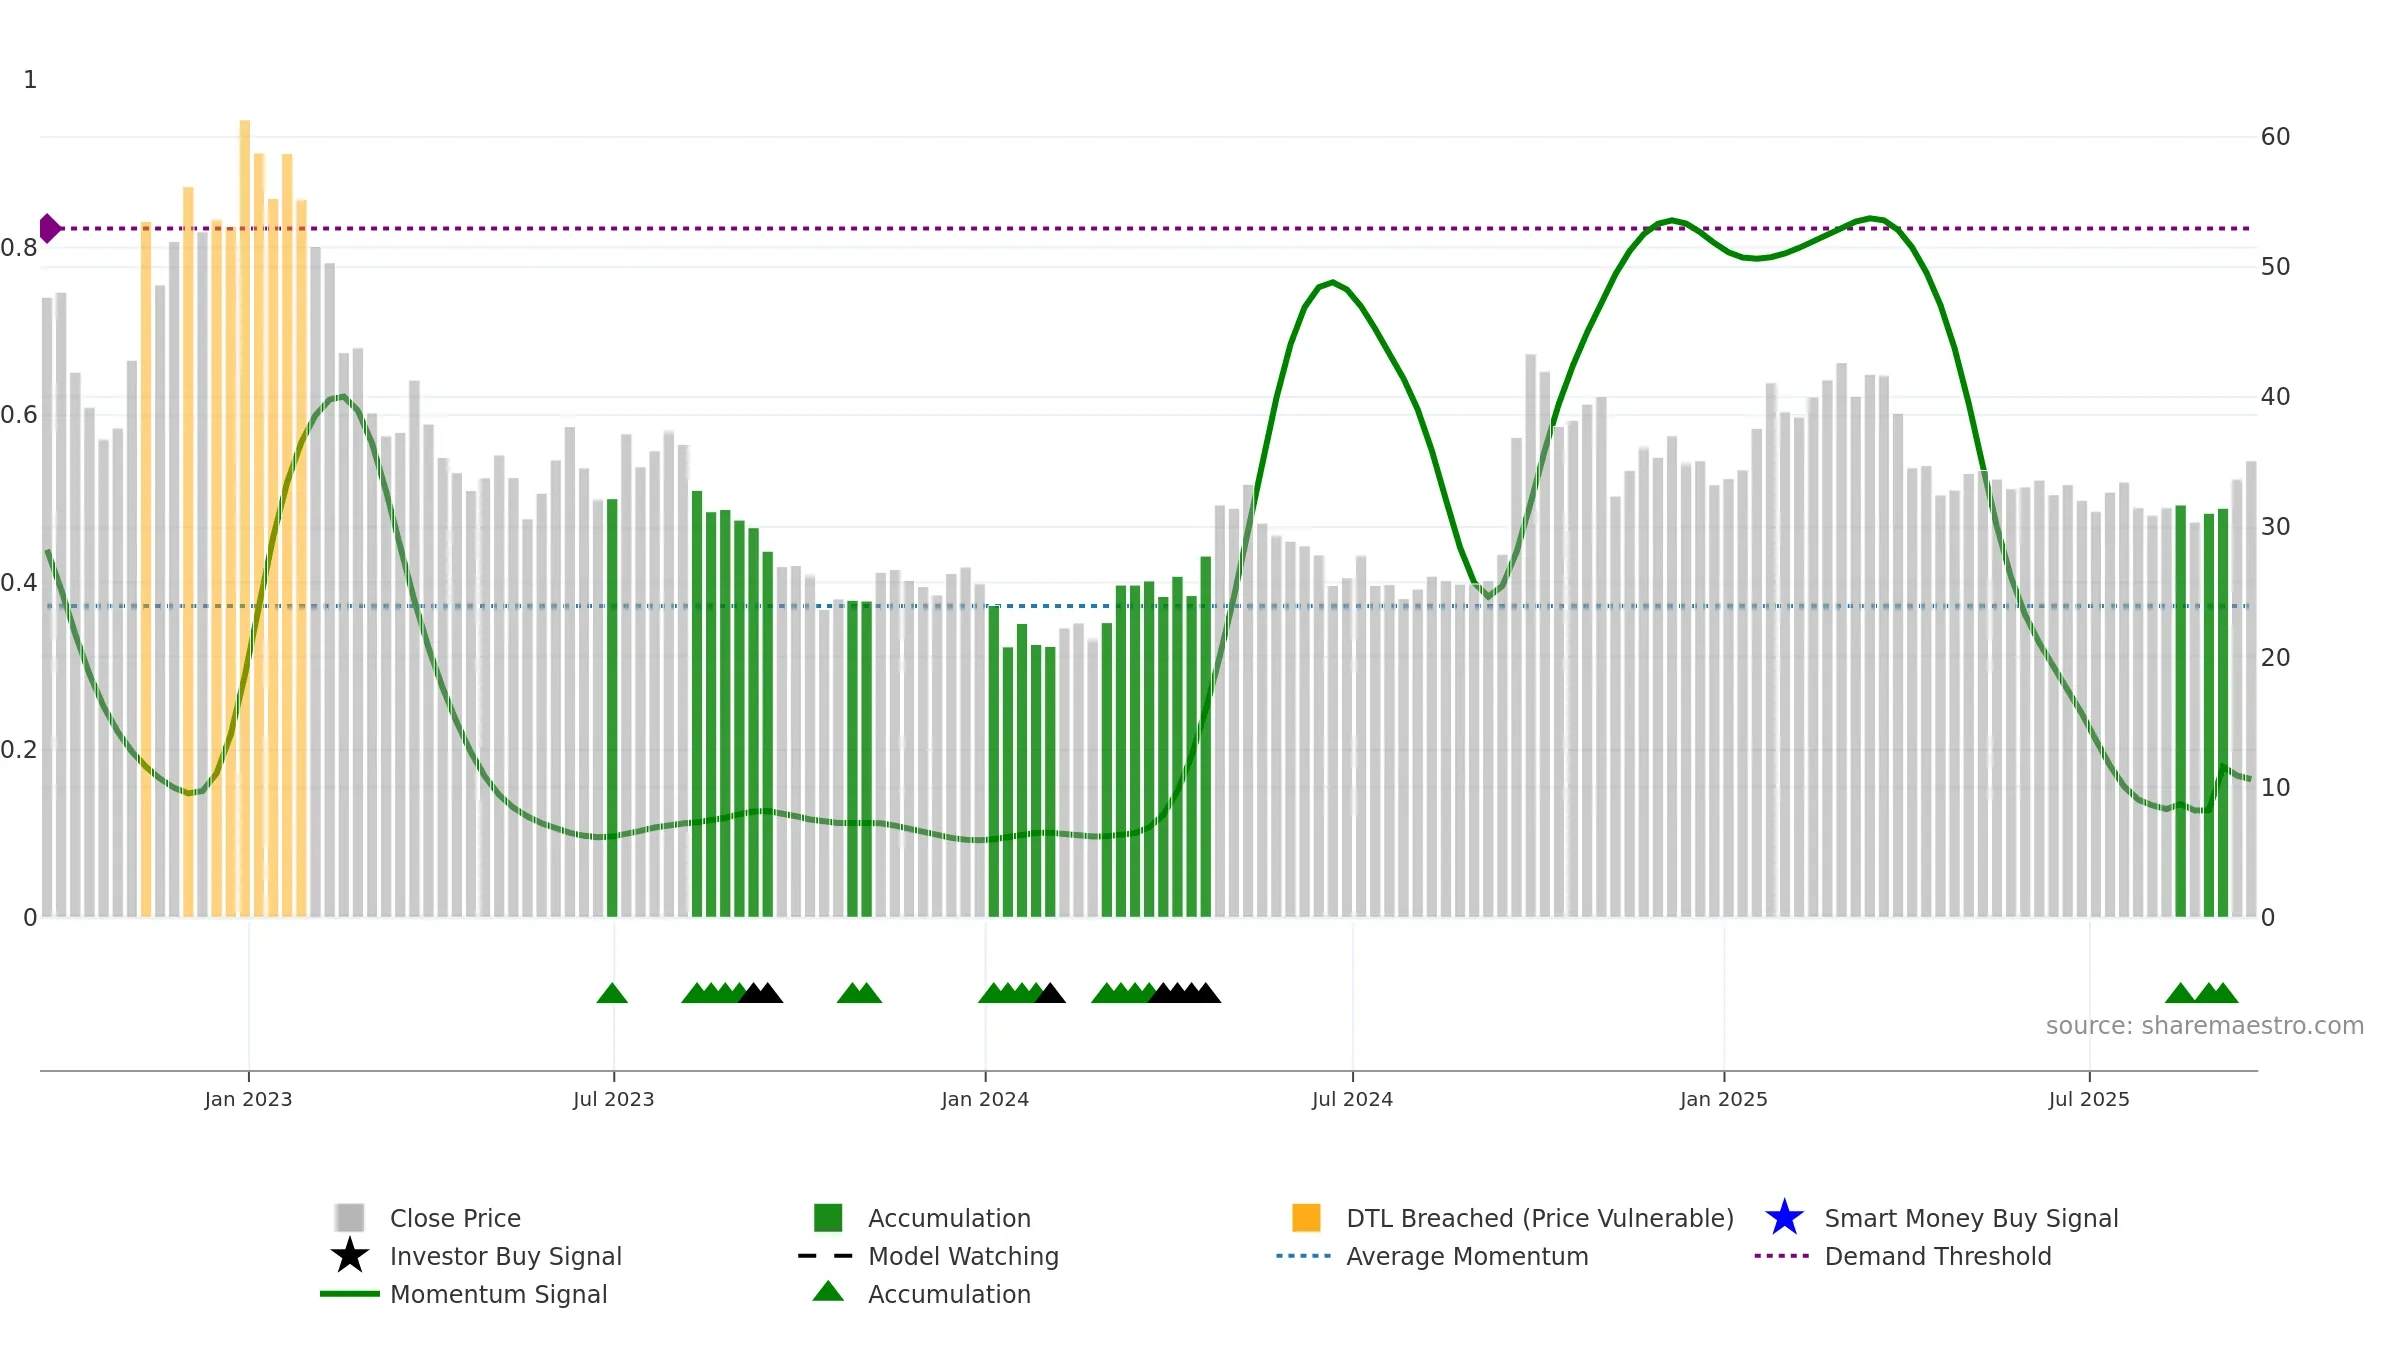
Weekly Report
JD.com, Inc. closed at 35.1000 (-1.76% WoW) . Data window ends Fri, 19 Sep 2025.
How to read this — Price slope is upward, indicating persistent buying over the window. Low weekly volatility favours steadier follow-through. Volume and price are moving in the same direction — a constructive confirmation. Returns are negatively correlated with volume — strength may come on lighter activity. Price holds above key averages, indicating constructive participation.
Up-slope supports buying interest; pullbacks may be contained if activity stays firm.
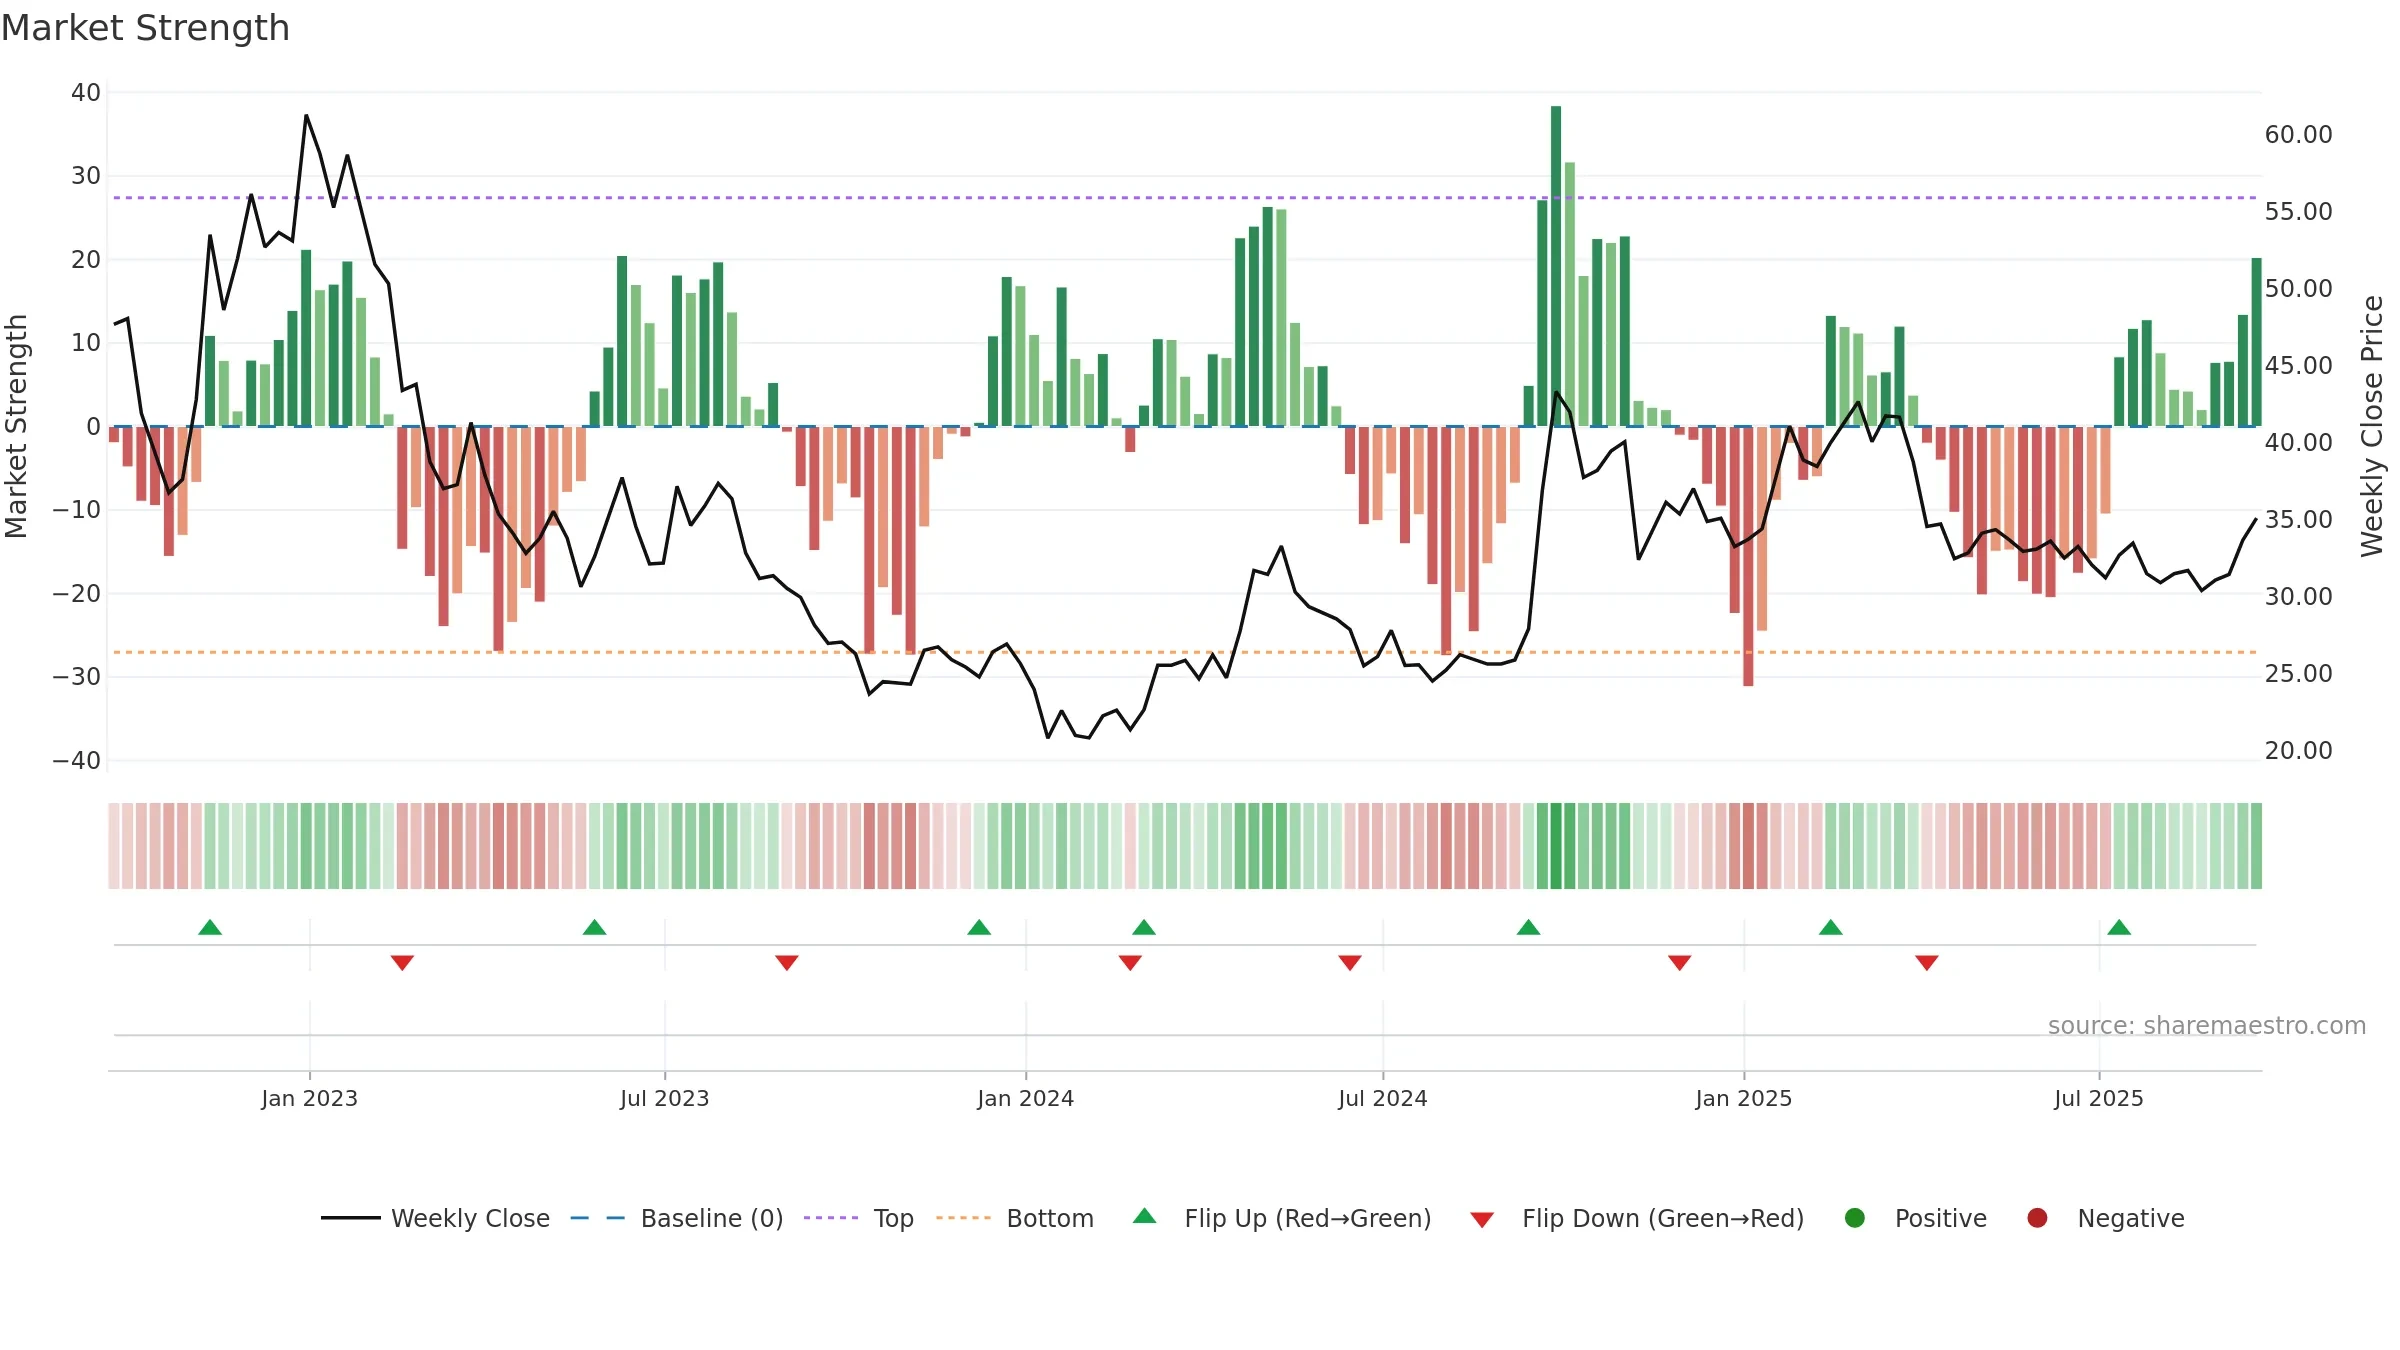
Gauge maps the trend signal to a 0–100 scale.
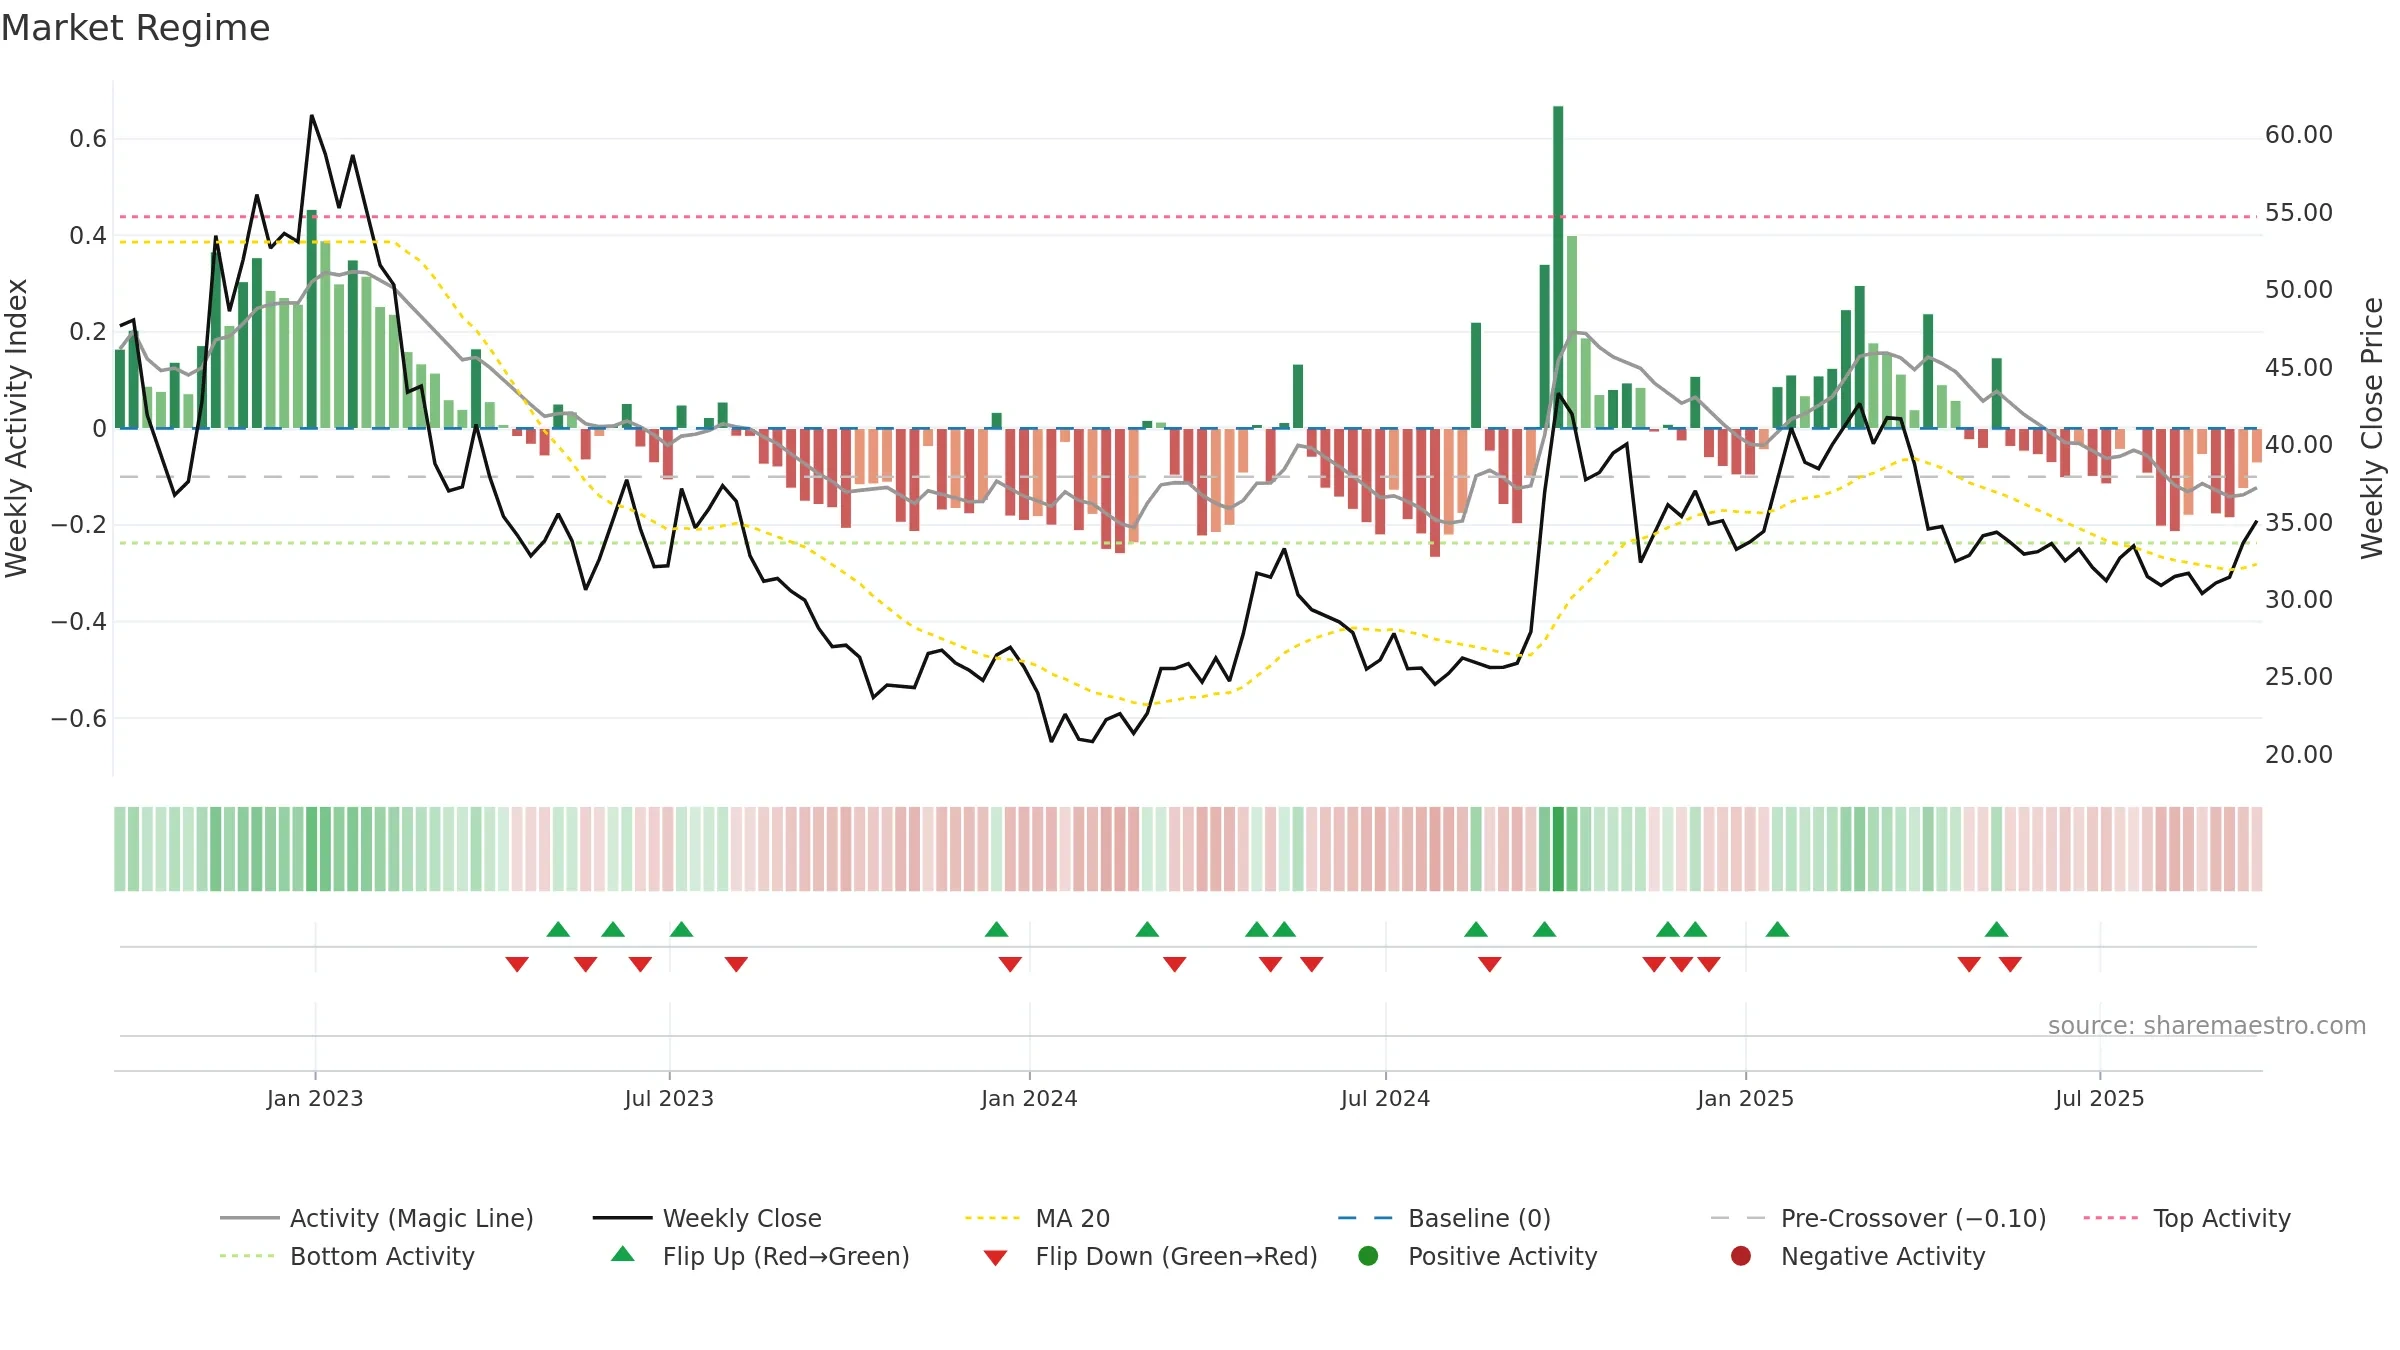
How to read this — Range-bound conditions; conviction is limited until a break or acceleration emerges.
Wait for a directional break or improving acceleration.
Conclusion
Neutral setup. ★★★☆☆ confidence. Price window: 13. Trend: Range / Neutral; gauge 16. In combination, liquidity confirms the move.
- Price holds above 8w & 26w averages
- Liquidity confirms the price trend
- Low return volatility supports durability
- Solid multi-week performance
- Momentum is weak/falling
Why: Price window 13.56% over 8w. Close is 4.25% above the prior-window high. Return volatility 1.49%. Volume trend rising. Liquidity convergence with price. Trend state range / neutral. Low-regime (≤0.25) upticks 3/7 (43.0%) • Distributing. Momentum bearish and rising.
Tip: Most metrics include a hover tooltip where they appear in the report.