Cathay No.1 REIT
01002T TPE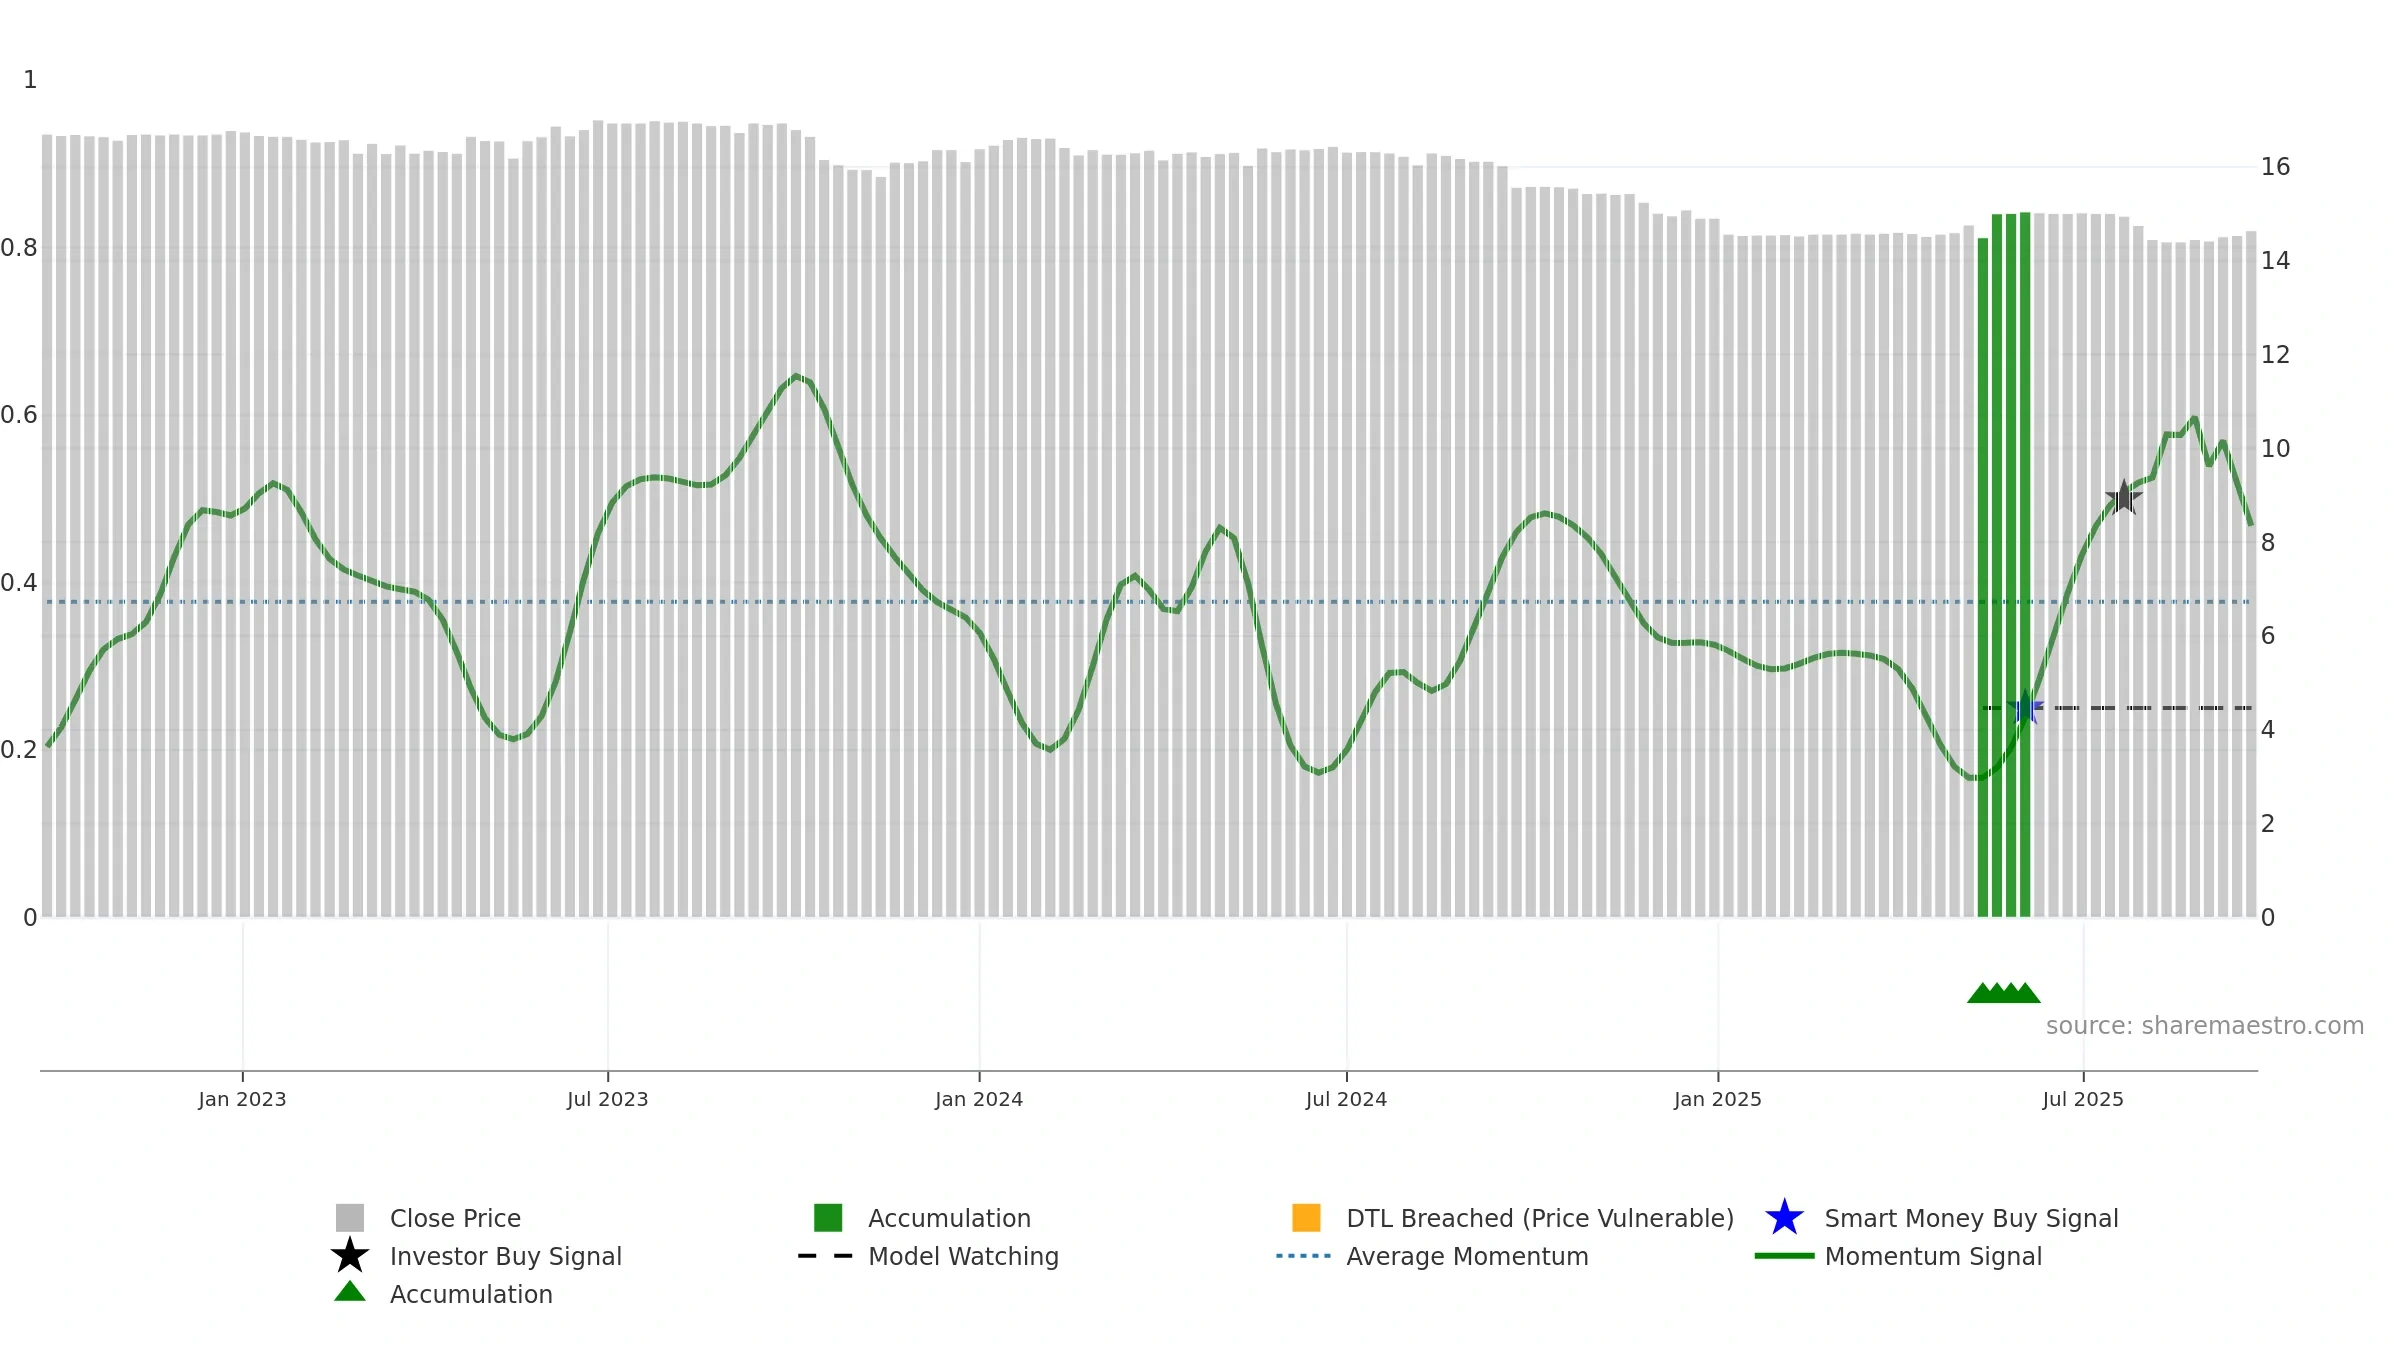
Weekly Summary
Cathay No.1 REIT closed at 14.6400 (-0.07% WoW) . Data window ends Mon, 22 Sep 2025.
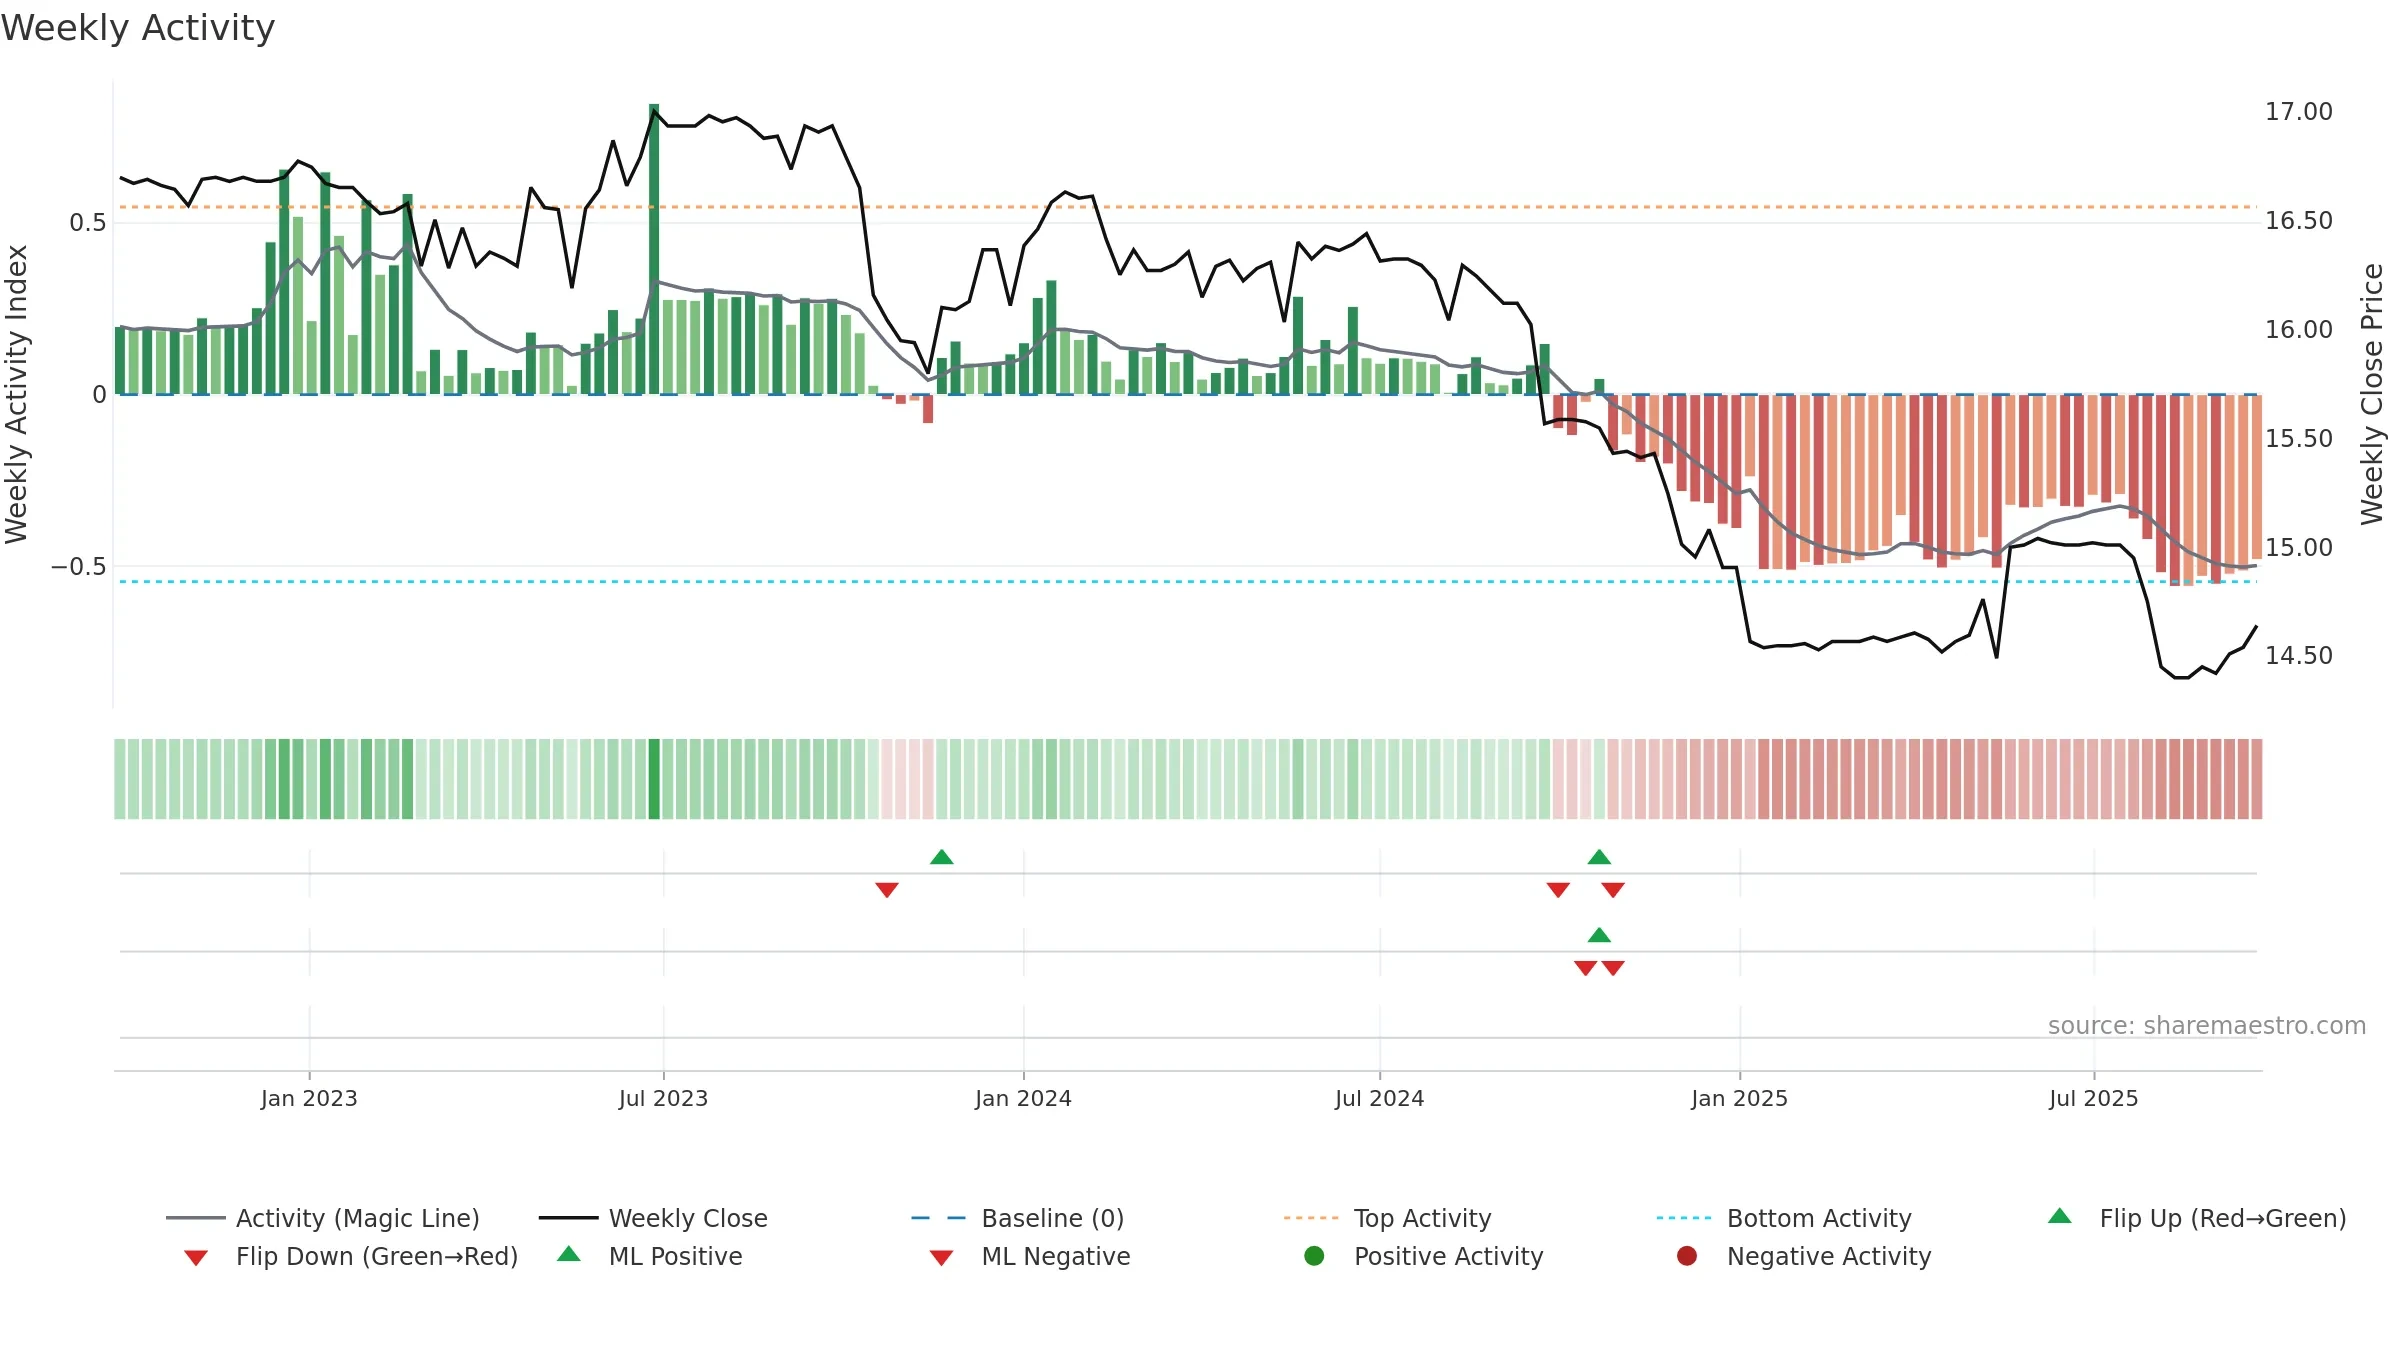
How to read this — Price slope is upward, indicating persistent buying over the window. Low weekly volatility favours steadier follow-through. Volume trend diverges from price — watch for fatigue or rotation. Returns are negatively correlated with volume — strength may come on lighter activity. Fresh short-term crossover improves near-term tone.
Up-slope supports buying interest; pullbacks may be contained if activity stays firm. Because liquidity isn’t confirming, prefer evidence of fresh demand before chasing moves.
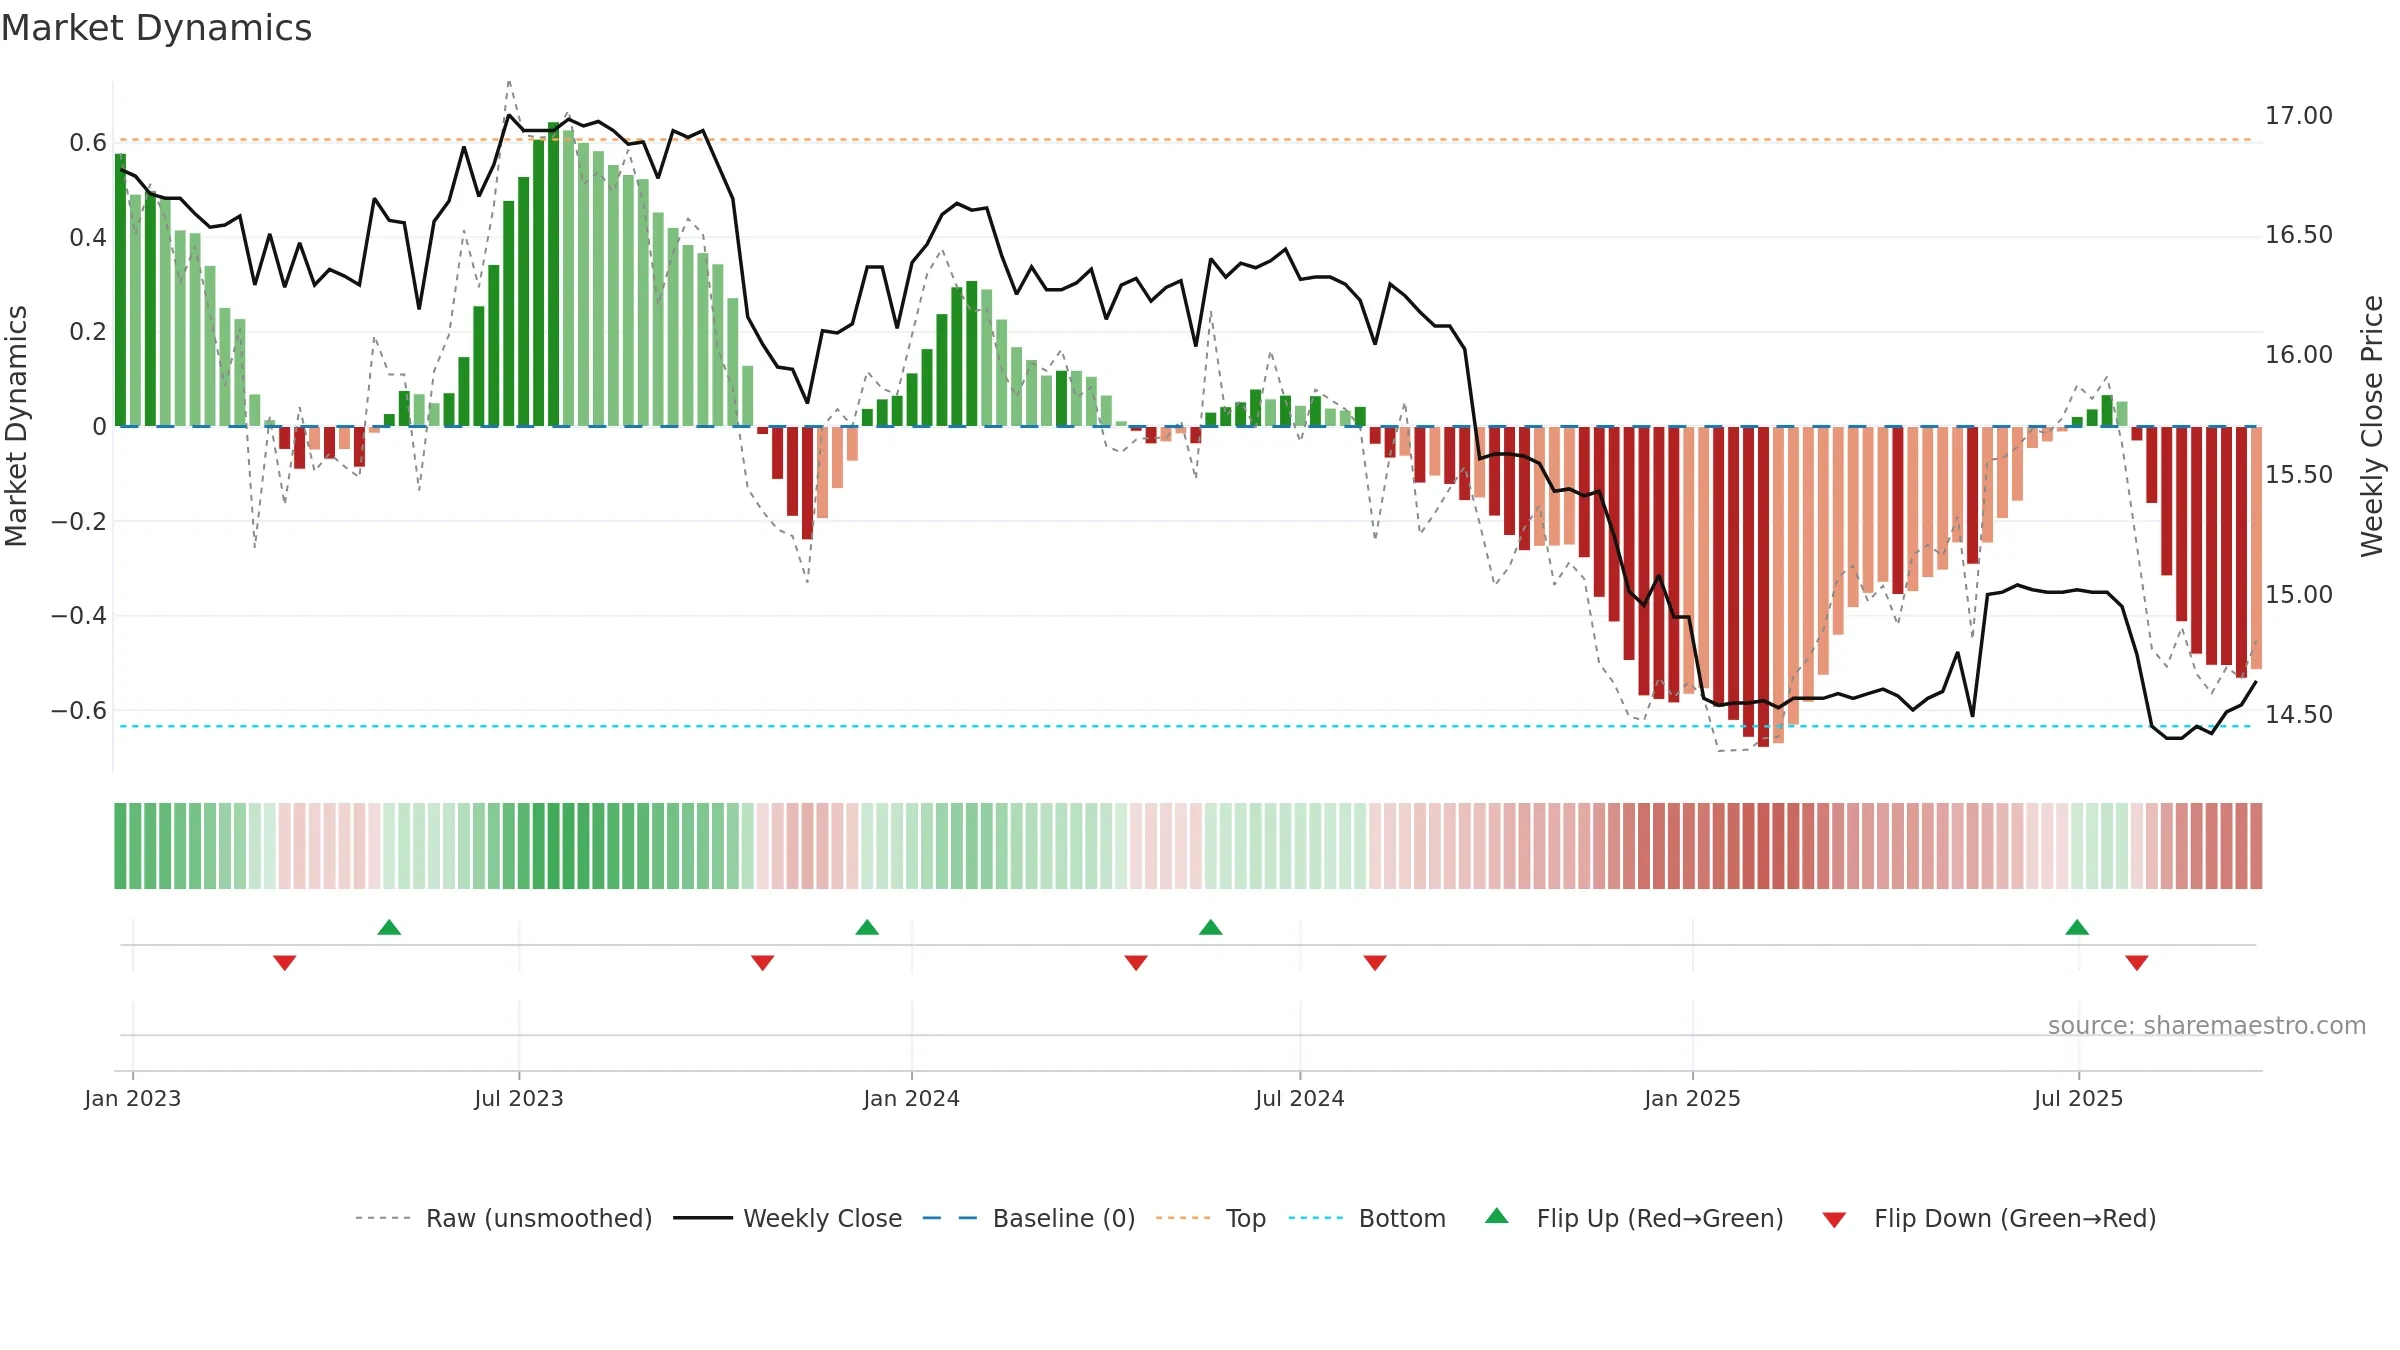
Gauge maps the trend signal to a 0–100 scale.
How to read this — Range-bound conditions; conviction is limited until a break or acceleration emerges.
Wait for a directional break or improving acceleration.

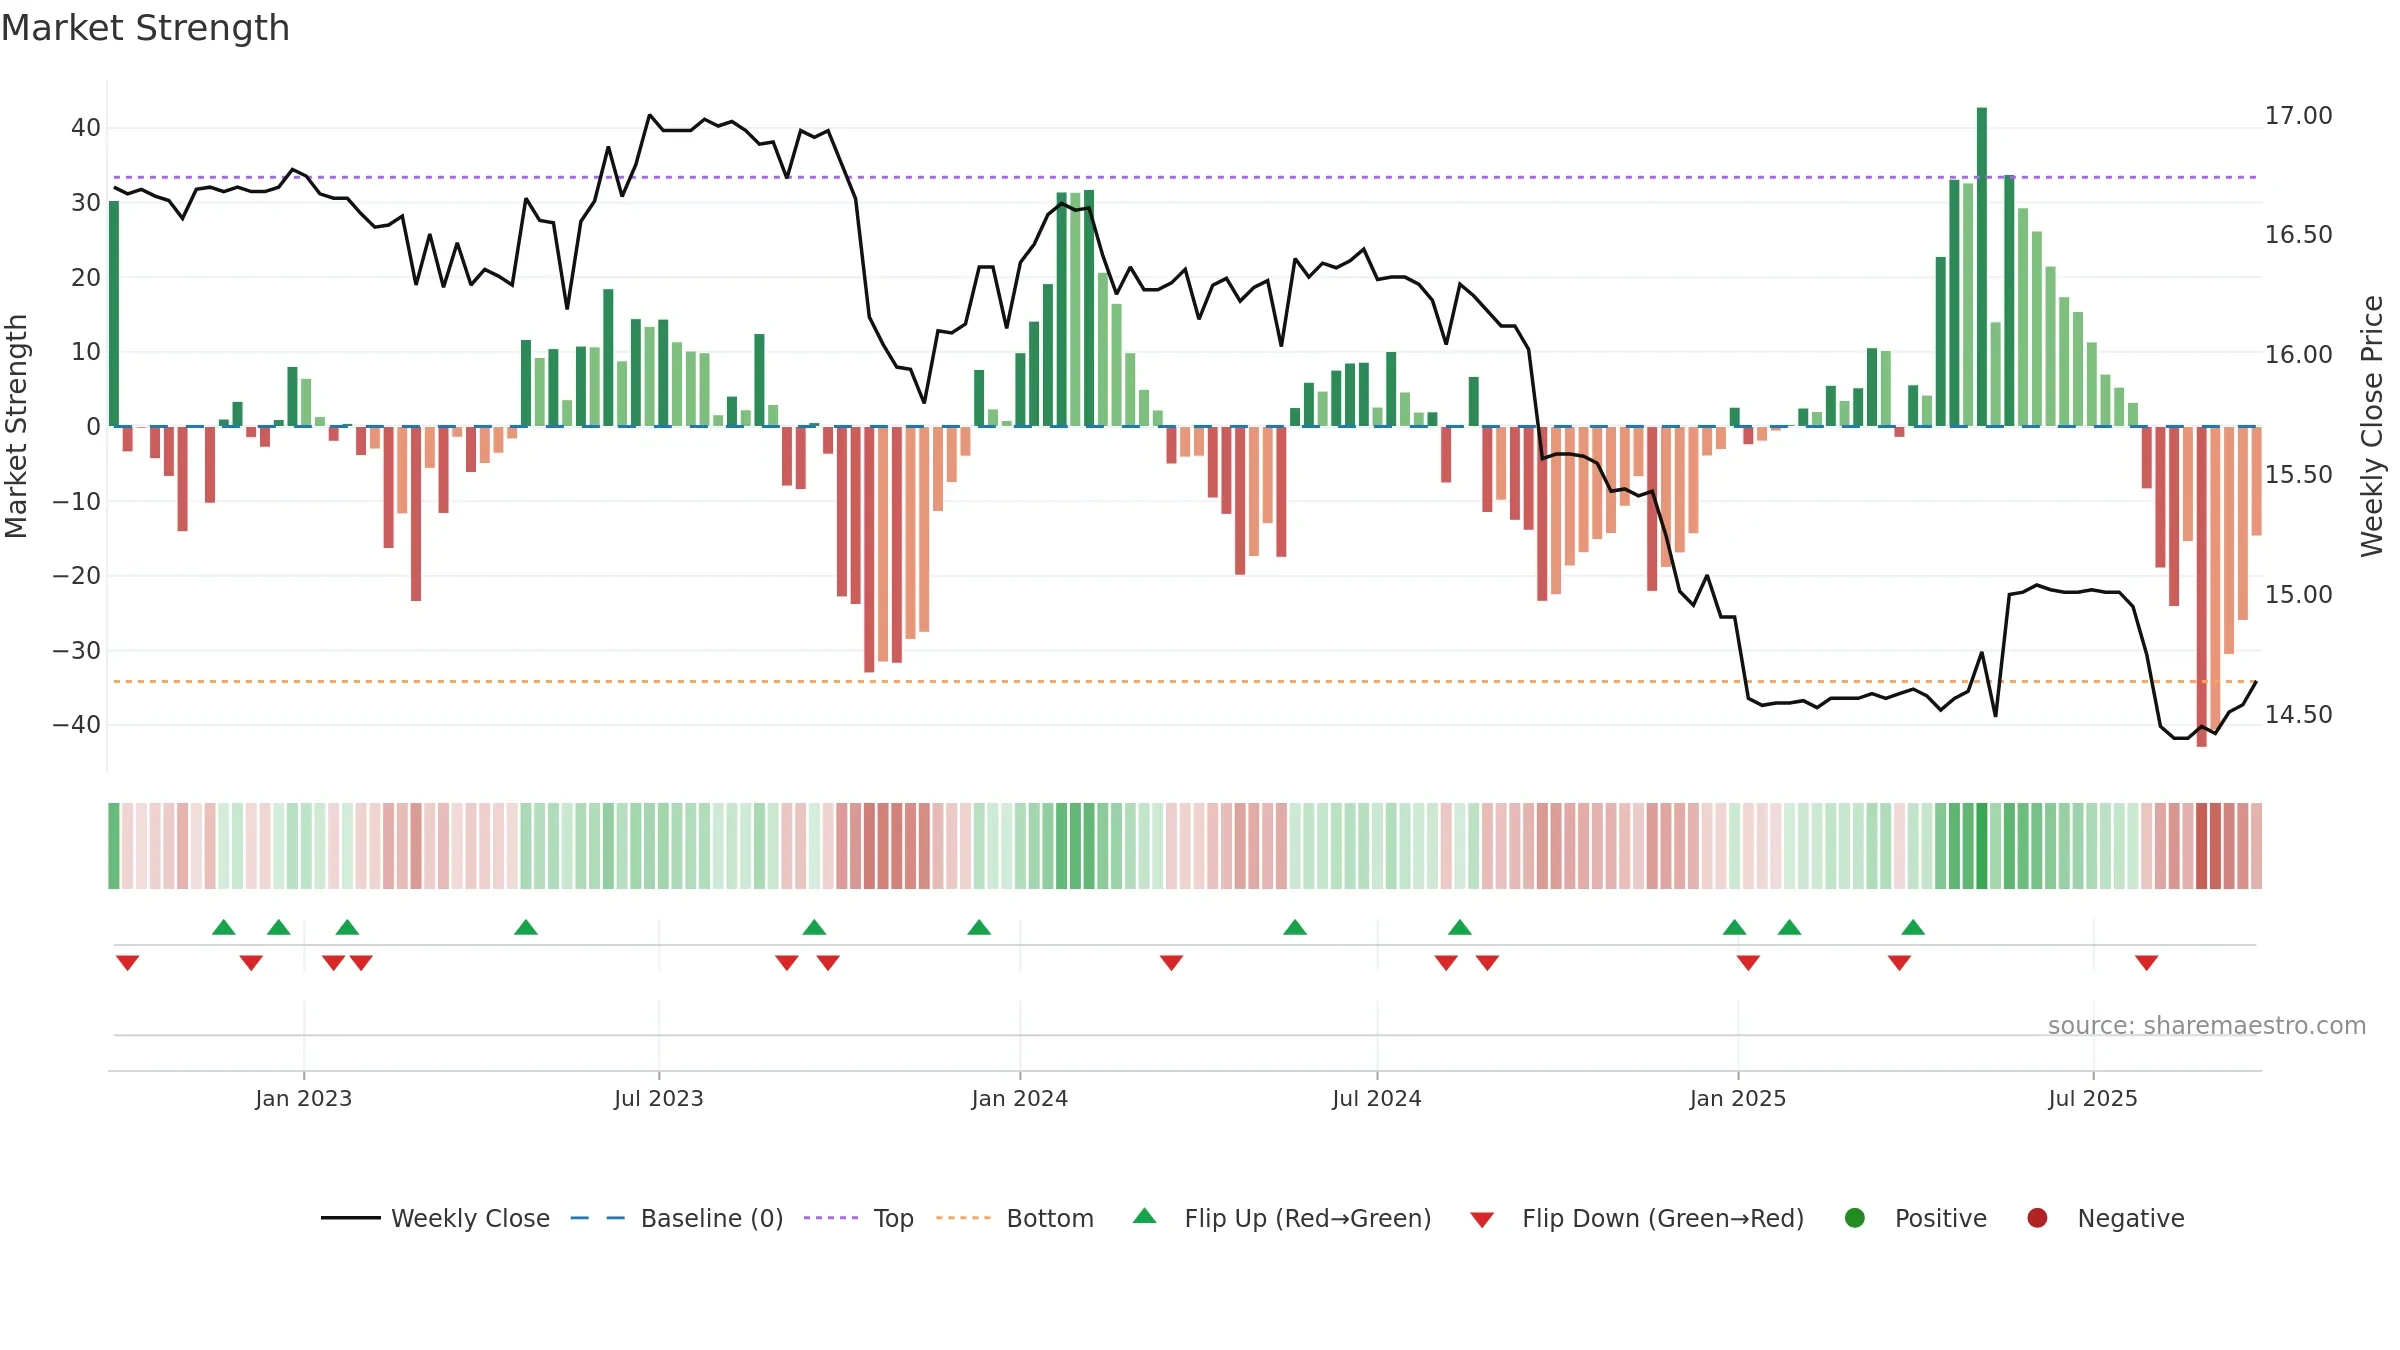
Relative strength is Negative
(< 0%, underperforming).
Latest MRS: -12.43% (week ending Fri, 19 Sep 2025).
Slope: Falling over 8w.
Notes:
- Below zero line indicates relative weakness vs benchmark.
- MRS slope falling over ~8 weeks.
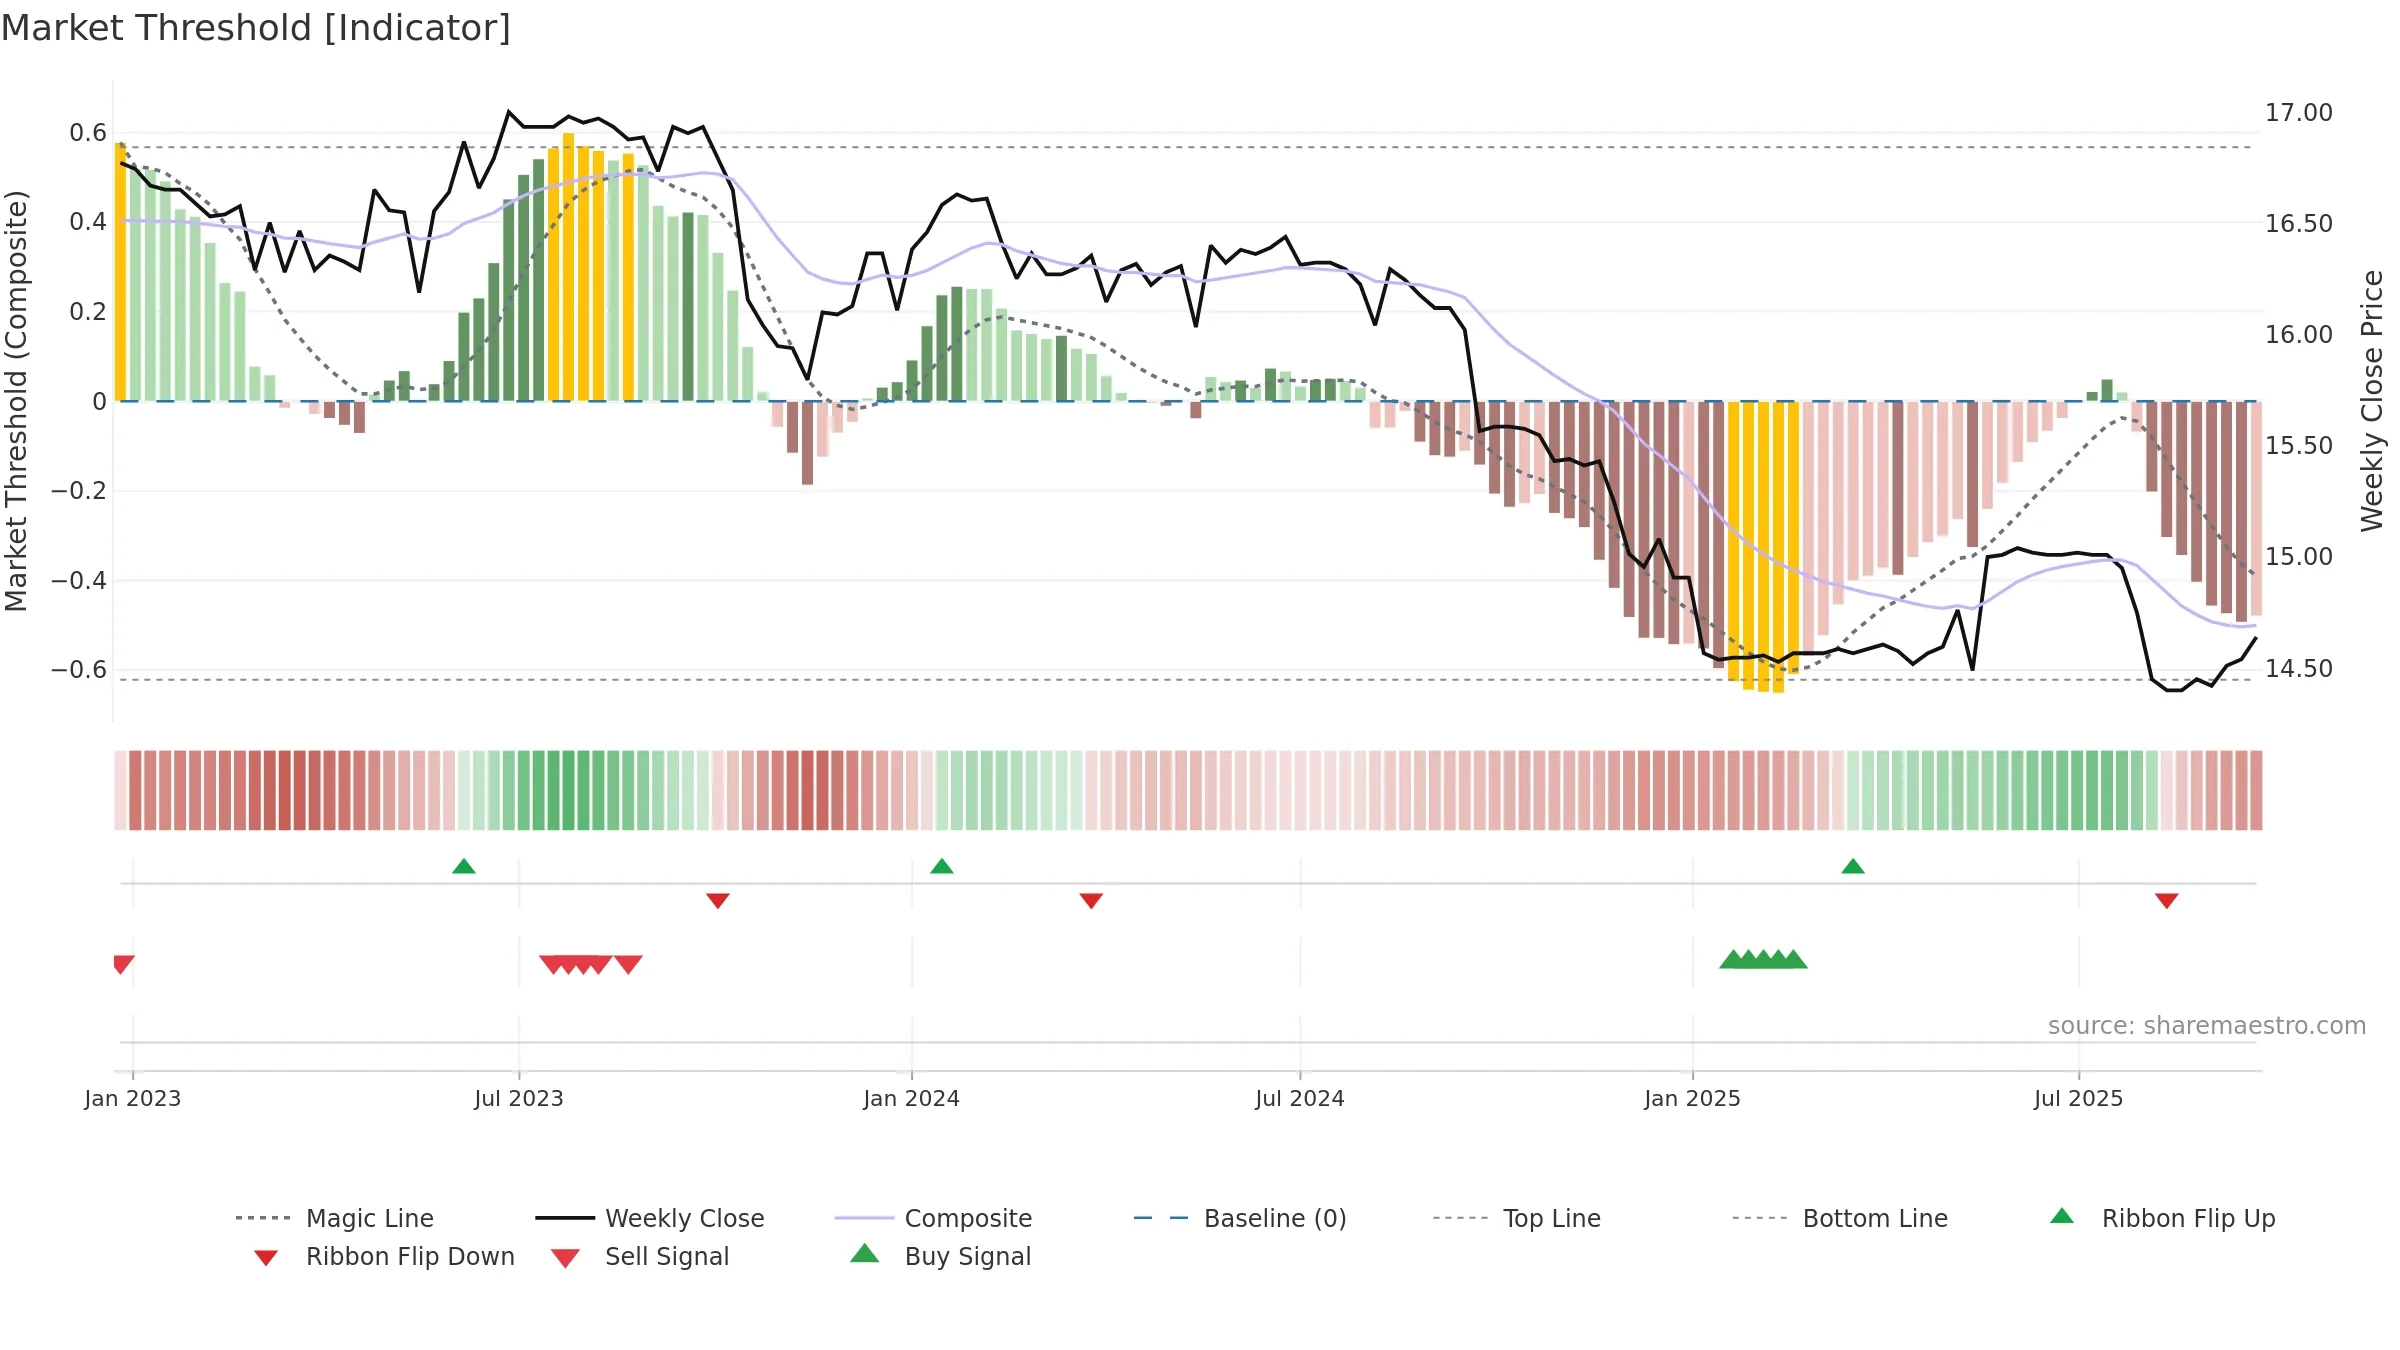
Conclusion
Negative setup. ★⯪☆☆☆ confidence. Trend: Range / Neutral · 1.31% over window · vol 0.53% · liquidity divergence · posture mixed · RS weak
- Low return volatility supports durability
- Momentum is weak/falling
- Price is not above key averages
- Liquidity diverges from price
- Mansfield RS: weak & falling
Why: Price window 1.31% over w. Close is 0.69% above the prior-window high. Return volatility 0.53%. Volume trend falling. Liquidity divergence with price. Trend state range / neutral. 4–8w crossover bullish. Momentum neutral and falling.
Tip: Most metrics include a hover tooltip where they appear in the report.